Harun Çiğ*![]() | Mehmet Tahir Güllüoğlu
| Mehmet Tahir Güllüoğlu![]() | Mehmet Bilal Er
| Mehmet Bilal Er![]() | Umut Kuran
| Umut Kuran![]() | Emre Can Kuran
| Emre Can Kuran![]()
© 2023 IIETA. This article is published by IIETA and is licensed under the CC BY 4.0 license (http://creativecommons.org/licenses/by/4.0/).
OPEN ACCESS
Delayed diagnosis of numerous diseases often results in postponed treatment, adversely affecting patient outcomes. By analyzing biological signals and patient photographs, critical information about an individual's health or the severity of a medical condition can be obtained for various diseases. Signals from Electroencephalography (EEG), Electrocardiography (ECG), and Electrooculography (EOG) can be used to predict and diagnose disorders related to the brain, heart, eyes, muscles, and nervous system. Additionally, biomedical images acquired through X-ray, ultrasound, and magnetic resonance imaging can be utilized for disease diagnosis and detection with the help of image processing techniques, artificial intelligence, and deep learning methods. In this study, we propose a novel approach that combines the Contrast Limited Adaptive Histogram Equalization (CLAHE) algorithm and Multi-Objective Cuckoo Search (MOCS) with Convolutional neural networks (CNNs) to achieve highly accurate disease classification using chest X-ray images. Our method begins by applying a contrast enhancement strategy, specifically, the CLAHE algorithm, with MOCS for optimal parameter selection to attain the highest classification performance. Subsequently, contrast-enhanced images are fed into the CNNs to further improve image quality and classification accuracy. Our approach is employed to categorize three types of chest X-ray images, namely, unhealthy, normal (healthy), and pneumonia. To assess the performance of our proposed method, we utilize the widely-used "COVID-19 Radiography" dataset. Experimental results yield an accuracy rate of 99.16%, a precision rate of 99.20%, and a sensitivity rate of 98.99%. These findings demonstrate that our proposed model outperforms existing techniques in the literature and can be effectively employed for disease detection and classification.
multi-objective cuckoo search algorithm optimization (MOCS), Convolutional neural network (CNN), hybrid CNN
The initial outbreak of COVID-19, often characterized by difficulty breathing and elevated body temperature, emerged in Wuhan, China, in the latter half of 2019 [1]. The virus rapidly spread worldwide, causing high mortality rates in numerous countries and prompting the World Health Organization (WHO) to classify it as a pandemic [2, 3]. Unlike SARS, COVID-19 not only affects respiratory system organs such as the lungs and throat but also causes detrimental effects on vital organs like the liver and kidneys. Consequently, elderly individuals and those with pre-existing medical conditions, such as hypertension, heart disease, chronic lung disease, and obesity, are at a higher risk of infection and mortality compared to younger, healthier individuals [4]. Prominent symptoms among COVID-19 patients include high body temperature, dyspnea, fatigue, and dry cough [5]. Signs of infection typically appear within a few days after exposure to the virus [6]. Given that COVID-19 is highly transmissible, it is crucial to rapidly identify carriers to minimize the spread of the virus.
The Reverse Transcriptase Polymerase Chain Reaction (RT-PCR) test is a widely used method for diagnosing COVID-19 by detecting the presence of viral RNA patterns [7, 8]. This technique is particularly significant for detecting the virus at low concentrations in the body. During the RT-PCR test, a swab sample is collected from the person's throat and nostril for analysis [7, 9]. However, two major drawbacks of the RT-PCR test are the lengthy duration required for obtaining results and the occurrence of false-positive or false-negative results, which reduce the test's accuracy and reliability [10, 11].
Due to the limited availability of test kits in many countries, accurate disease diagnosis may be significantly delayed [2]. Researchers from various disciplines have been seeking faster and more reliable alternatives to the RT-PCR test, with biomedical imaging emerging as a potential solution [12]. Radiology images have demonstrated higher success rates in diagnosing COVID-19 when test results are negative despite patients exhibiting symptoms [11]. Artificial intelligence and machine learning techniques have been applied to radiography images of human lungs to determine the presence of COVID-19 [13]. Chest X-ray images and computed tomography (CT) scans are commonly used for detecting pneumonia caused by COVID-19, as they are effective in examining respiratory system-related diseases such as pneumonia and tuberculosis [14]. A close examination of X-ray and CT images reveals their potential for diagnosing COVID-19 when combined with artificial intelligence, machine learning, and deep learning methods [15]. However, each technique presents its own advantages and disadvantages. In comparison, chest X-ray images are less expensive and more commonly used, and X-ray machines are more portable and practical than CT scanners [13].
Numerous researchers have sought to develop techniques for identifying COVID-19 infected patients using chest X-ray images. In our proposed method, we employ a multi-objective cuckoo search (MOCS) algorithm for contrast enhancement on the original images to achieve the highest classification accuracy [16]. Following this, contrast-enhanced images are input into Convolutional neural networks (CNNs). The main contributions of our study can be summarized as follows:
We utilize a MOCS algorithm to optimize the overall contrast of the original images by finding the optimal parameters for the Contrast Limited Adaptive Histogram Equalization (CLAHE) technique. Our results demonstrate that a hybrid system, which combines CLAHE, MOCS, and CNNs, can classify COVID-19 cases more accurately.
Due to the efficient results obtained from our experiments, our proposed method can serve as an alternative to COVID-19 test kits for distinguishing COVID-19 cases from healthy individuals and those with pneumonia.
The remainder of this paper is organized as follows: Section 2 provides an overview of state-of-the-art methods for classifying COVID-19 cases. In Section 3, we present a detailed description of our proposed method. Section 4 compares our method with existing techniques in the literature based on experimental results. Finally, Section 5 concludes the paper.
There are a huge number of leading-edge techniques based upon the usage of machine learning and deep learning together exploited in the context of disease detection by means of medical images. Most of the techniques are based on deep learning, especially on pretrained models. Some methods also make use of machine learning algorithms together with deep learning, which are known as hybrid methods.
The researchers [17] employed ResNet-50, ResNet-101, ResNet-152, InceptionV3 and Inception-ResNetV2 models for diagnosing the disease of COVID-19 cases. Examining over the experimental results gained, the ResNet-50 has proven to have the best classification accuracy rate in comparison with the remaining models. For the diagnosis of disease, The researchers [18] employed, the transfer learning algorithms VGG-19, Inception, MobileNetV2, Xception, and InceptionResNetV2. There are 1427 chest X-rays, in sum, exploited in dataset during the course of study. An accuracy rate of 96.78% and a sensitivity value of 98.66% gained in the experiments. The researchers [19] employed a deep learning oriented method in order to categorize COVID-19 patients based on the chest radiology images. Experiments started under the guidance of a previously created dataset that consists of 5000 chest X-ray images opened to public. Previously trained CNNs, namely, ResNet-18, ResNet-50, DenseNet-121, and SqueezeNet were utilized so as to determine the disease of patients depending on these pictures. Having used these networks, 90% of specificity value and 98% of sensitivity value were found on average. The researchers [20] enhanced a transfer learning based strategy for increasing the predictive performance of classification task for COVID-19 infected people. With the help of the SqueezeNet1.0 and DenseNet121 structures employed in the proposed method, it was shown that the classification accuracy rates are dramatically higher in terms of both positive samples and negative samples. It can be seen that, studies conducted on using pretrained models lead to a superior performance, which have achieved an accuracy rate above 96%.
The researchers [21] examined over the diagnostic value and the stability of chest CT as opposed to using RT-PCR specimen. It was shown that high sensitivity values are obtained in the end of experiments. Therefore, chest CT might likely to be employed as a plausible and fundamental means for the diagnosis of COVID-19 in the regions where it is relatively significant to determine whether or not a patient is infected by the COVID-19 virus immediately. The researchers [22] defined and identified prominent CT results obtained from a group of patients infected by the nCov virus in China with the overall purpose of enabling radiologists to recognize this newly explored epidemic. In this manner, this will in turn end up with early diagnosis to start the medical treatment and fast isolation of virus-infected patients from healthy people in community. It is also observed that COVID-19 virus has resemblance in terms of visible aspects with the same viral family members such as pneumonia, Sars and Mers. The study [23] showed that, as the rate of patients that are infected by the COVID-19 virus grows faster, the need for an alternative swift technique for the diagnosis of COVID-19 becomes a dramatically significant purpose due to the lack of sufficient amount of test kits as well as the necessity for the isolation of patients from those of healthy ones in a short period of time. As a consequence, they come up with a better method in order to enable radiologists and clinical practitioners recognize the patients more accurately and quickly. Their suggested method has an overall accuracy rate of 95% for the 3-class classification where the classes include COVID-19, pneumonia, and normal. The researches [1] recommended a deep transfer learning method so as to categorize people infected virus. Moreover, having exploited a top-2 smooth loss function with cost-sensitive attributes, they were able to manage the problems caused by noisy and imbalanced datasets. Finally, they obtained efficient results in comparison with its counterparts employed in the context of supervised learning models. The study [24] extract features using ResNet50 and SVM classifier along with a linear kernel function, and obtain an overall accuracy rate of 94.7%. It was shown that the proposed method has a huge impact on the detection of COVID-19 infected patients based upon employing a distinct set of local texture descriptors. The study [25] used 10 widely used pre-trained CNN models to predict positive cases. Best performance is obtained using ResNet-101, which successfully distinguished positive COVID-19 cases from other atypical and viral pneumonia diseases, with an accuracy rate of 99.51%. Using ResNet-101 also provided a low cost solution and high sensitivity. The study [26] proposed a patch-based CNN model for classifying the chest X-ray images for COVID-19. Preprocessed data are supplied to segmentation network, which extracts the lung area from the image. Then, classification is made using the extracted area by employing majority voting. In addition, a global saliency map is created using gradient-weighted class activation map (Grad-CAM). The study [27] proposed a multiscale attention guided deep network with soft distance regularization (MAG-SD) in their study. They also used a deep network, MA-Net, for prediction task and creation of the attention from multiscale feature maps. Augmentation is applied on the data. The findings demonstrated that the proposed MAG-SD model has advantage over other state-of-the-art methods. The study [28] employed MobileNet, which is a deep transfer learning model. The proposed model provided a fast convolution operation and a prediction time less than 0.1 seconds (s) besides that it provided a high accuracy rate, which reached 96.33%. The study [29] proposed a model based on decision tree (DT) classifiers and CNNs. 3 DT models are used together with 3 CNNS, where each DT is trained by corresponding CNN. First DT classifies images as normal or abnormal, second DT identifies tuberculosis and third DT identifies COVID-19. First DT, second DT and third DT reached accuracy rates of 98%, 80% and 95%, respectively. The study [30] exploited CovidNet and occlusion sensitivity maps (OSM). OSM is used to demonstrate the parts important in chest X-ray images, for CovidNet classification decision. An input layer size of 448×448 is selected for capturing more features from grayscale images. An accuracy rate of 99.96% is achieved using CovidNet, on average. The study [31] used different CNN architectures, which are trained using ImageNet to be used in feature extraction from chest X-ray pictures. After that, the CNNs are integrated various machine learning algorithms. The highest accuracy rate obtained from the MobileNet with a linear kernel SVM, which achieved 98.5%. Deep learning models, especially pretrained models, CovidNet and ResNet-101, achieved an accuracy rate of nearly 100%. Success rates of hybrid methods or machine learning based methods are not as high as of those deep learning based methods’ success rate. Among the reviewed studies in this paragraph, the best accuracy rate is 98%, which is obtained using DT. The studies showed that it would be a plausible reason to use deep learning models in order to achieve higher accuracy.
The transfer learning architectures are costly due to their need to huge amount of data and high number of layers for the training phase, which will cause more complexity although they are suitable when they have been already trained [32]. However, classical CNNs are usually less complex, which can be combined with an enhancement method. It can be observed that metaheuristic methods can enhance the image in a short time with a high success [33, 34]. An optimized and high performance model can help health experts to diagnose COVID-19 more efficiently. With this motivation, in this paper, a method combining MOCS-CLAHE with CNN is proposed for deriving a light-weight solution.
Applications It is essential to improve the quality of chest X-ray images and increase the accuracy rates of the supervised models, according to the studies [35, 36]. In our method, we employed a multi-objective cuckoo search (MOCS) [37] based contrast limited adaptive histogram equalization (CLAHE) [38] which is known as (MOCS-CLAHE), which is proposed by Kuran and Kuran [16]. In this section, this method will be explained with its components.
3.1 Multi-Objective Cuckoo Search algorithm (MOCS)
MOCS [37] is a multi-objective metaheuristic optimization method which is motivated by the actions of cuckoo birds and appendage of the classical cuckoo search (CS) algorithm [39]. Positions that belong to solutions are represented as cuckoos’ eggs, and like CS, MOCS uses Lévy flights to determine positions of the cuckoos. Fitness scores of the cuckoos are evaluated using a predetermined fitness function (as known as objective function). Fitness function is selected according to the problem type. For MOCS, since it is a multi-objective algorithm, multiple fitness functions could be determined. Hence, multiple solutions are obtained and these solutions are fit in a Pareto front. A set of non-dominated solutions form the Pareto front, that is, if we accept two solution vectors as v and t, no component of v is larger than the complementary part of t, and one or more of the components are smaller. Therefore, Pareto front for an optimization problem can be given as in Eq. (1), where s is the solution and S is the solution set. In multi-objective version of CS algorithm, each of the cuckoos lays K eggs instead of one egg.
$P F=\left\{s \in S \mid \exists s^{\prime} \in S: s^{\prime}<s\right\}$ (1)
Cuckoos behave in a parasitic way. Hence, an intruding cuckoo would lay its egg to other cuckoo’s nest, since the algorithm imitates brood parasitism. The host cuckoo bird might become aware of an intruding cuckoo’s eggs with a probability pa. If the host cuckoo becomes aware, it could either throw the egg from the nest or perform a Lévy flight to build a completely new nest. A simple Lévy distribution formula can be given as Eq. (2).
$L(s, \gamma, \mu)=\left\{\begin{array}{c}\sqrt{\frac{\gamma}{2 \pi}} \exp \left[-\frac{\gamma}{2(s-\mu)}\right] \frac{1}{(s-\mu)^{3 / 2}} \text { if } 0<\mu<s<\infty, \\ 0 \text { if } s<0\end{array}\right.$ (2)
In Eq. (2), μ is the minimum step parameter, γ is the scale parameter. As s→∞, we can have Eq. (3).
$\mathrm{L}(\mathrm{s}, \gamma, \mu)=\sqrt{\frac{\gamma}{2 \pi}} \frac{1}{\mathrm{~s}^{3 / 2}}$ (3)
The birds update their positions using Eq. (4), which employs Lévy flight.
$x_i^{(t+1)}=x_i^{(t)}+\alpha \bigoplus L(\lambda)$ (4)
Figure 1. Pseudocode of MOCS algorithm
In Eq. (4), xi(t+1) is the solution for the next iteration, xit is the solution at the current iteration, α is a scaling factor which must be bigger than 0, $\bigoplus$ symbol represents the element-wise multiplying operator, L(λ) is the Lévy distribution of the λ such that 1<λ<3. Pseudocode of the MOCS is shown in Figure 1. For Eqns. (1)-(4), the study [37] can be referred.
3.2 Contrast enhancement with Multi-Objective Cuckoo Search (MOCS-CLAHE)
CLAHE [38] is a local contrast enhancement technique devised to overcome limitations of AHE [38]. Instead of applying global histogram equalization (HE) [40], it divides images into separate contextual regions and equalizes them independently. CLAHE allows two parameters, namely, clip limit (CL) and block size (BS). CL clips the histogram of each contextual region to a predetermined limit, in this way, CLAHE prevents any unwanted noise and over-enhancement. Also, BS parameter comprises two subparameters, M and N, where M is the number of contextual regions in x-axis and N is the number of contextual regions in y-axis. After enhancement of each contextual region, these regions are merged using bilinear interpolation to remove inconsistencies on the borders of the regions, since they are equalized independently.
MOCS algorithm is selected for optimizing the CLAHE parameters in order to increase visual quality. Two quality metrics are employed as fitness functions for this purpose. Output images are evaluated using these two metrics by optimizing parameters of CLAHE using MOCS at each iteration. First one is discrete entropy (DE), which indicates the level of details in an image [41]. Images with more details have higher DE values. Since level of details in an image is important for deep networks for extracting features, DE is one of the appropriate functions to evaluate output images. DE can be expressed as given in Eq. (5).
$\mathrm{DE}=-\sum_{\mathrm{i}=1}^{\mathrm{n}} \mathrm{P}\left(\mathrm{x}_{\mathrm{i}}\right) \log _2 \mathrm{P}\left(\mathrm{x}_{\mathrm{i}}\right)$ (5)
In Eq. (5), P(xi) is the probability density function (PDF) of the gray level i of image and n is the number of gray levels. A fast noise variance estimation method (NVE) [42] is employed to prevent noise in the output images, since noise in the resultant images can cause false positive and false negative decisions for our deep network model. Discrete version of NVE is given in Eq. (6).
$\sigma_{\mathrm{n}}=\sqrt{\frac{\pi}{2}} \frac{1}{6(\mathrm{~W}-2)(\mathrm{H}-2)} \sum_{\mathrm{I}}\left|\mathrm{I}(\mathrm{x}, \mathrm{y})^* \mathrm{~N}\right|$ (6)
In Eq. (6), I is the image, W is the image width, H is the image height, N is the noise estimation operator, x is the spatial coordinate in the x-axis and y is the spatial coordinate in the y-axis, respectively. It can be seen that, image I is convolved with the noise estimation operator N and summation of all pixels in the resulting convolved image is calculated. Noise estimation should be insensitive to edges, hence, difference of the two masks approximating to Laplacian of an image is taken to provide a noise estimation operator N, which is given in Eq. (9). L1 and L2 are used for computing N, which are given in Eq. (7) and Eq. (8), respectively.
$L_1=\left[\begin{array}{ccc}0 & 1 & 0 \\ 1 & -4 & 1 \\ 0 & 1 & 0\end{array}\right]$ (7)
$\mathrm{L}_2=\frac{1}{2}\left[\begin{array}{ccc}1 & 0 & 1 \\ 0 & -4 & 0 \\ 1 & 0 & 1\end{array}\right]$ (8)
$\sigma_{\mathrm{n}}=\sqrt{\frac{\pi}{2}} \frac{1}{6(\mathrm{~W}-2)(\mathrm{H}-2)} \sum_{\mathrm{I}}\left|\mathrm{I}(\mathrm{x}, \mathrm{y})^* \mathrm{~N}\right|$ (9)
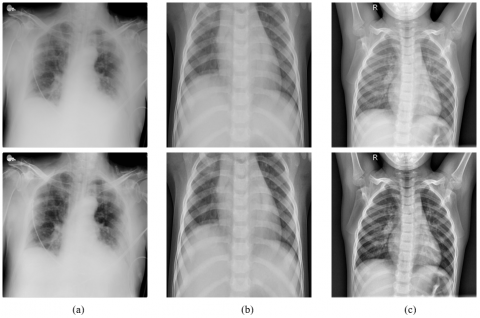
Since MOCS-CLAHE maximizes DE and minimizes noise, the fitness function using DE, can be given as in Eq. (10). For minimizing noise, it is sufficient to compute the multiplicative inverse of the NVE as second fitness function, which is given in Eq. (11). For Eqns. (6)-(9), the study [42] can be referred. Sample X-ray images and their enhanced versions are given in Figure 2. Illustration of the proposed method in this study, is given in Figure 3.
$\mathrm{f}_1=\mathrm{DE}$ (10)
$f_2=1 / \mathrm{NVE}$ (11)
Figure 2. Sample X-ray images are given on the top row and their enhanced versions are given on the bottom row using MOCS-CLAHE: (a) COVID-19, (b) Pneumonia, (c) Normal
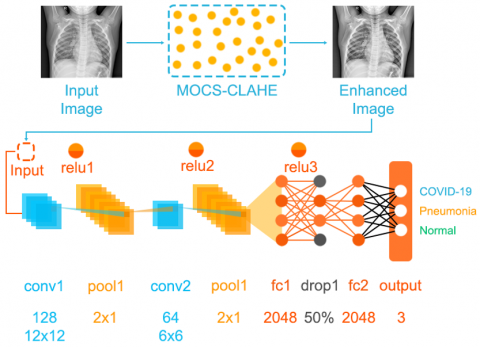
Figure 3. Illustration of the proposed method
3.3 Convolutional neural networks
Convolutional neural networks can be classified as being a multi-layer, feed-forward neural network which might be exploited for those of tasks such as object detection and image analysis in the context of image processing. Functionality of CNNs mimic the inner workings of human brain. In addition, patterns between inter-connected neurons in a human brain are akin to the organizational structure of visual cortex [43]. CNNs have proven to be relatively efficient neural networks for image recognition and classification problems. CNNs are mathematical structures that are typically made up of three types of layers, namely, convolution, pooling, and fully connected layers [44]. Convolution and pooling layers are responsible for extracting features whereas fully connected layers are liable for sending the extracted features for the classification to the last output.
Convolutions are necessary in order for the neural network to interpret the numerical pixel values in an image. Therefore, goal of the convolutional layer is to convert the original image into numerical values so that the neural network can interpret the image accurately, and thus, can extract the patterns correctly subsequently [45]. In convolutional layer, filters are passed through the input image. Formula of the convolution is given in Eq. (12) below. In Eq. (12), M corresponds to the feature map while w represents the convolution kernel, I is the original image, m and n are the spatial coordinates for image I, and, i and j are the coordinates used for kernel.
$M(I, j)=\left(I^* w\right)(I, j)=\sum_m \sum_n I(m, n) w(I-m, j-n)$ (12)
Following the operations performed in the convolutional layer, it is customary to make use of a non-linear layer or activation layer in a CNN. Moreover, the main purpose of this layer is that to transform a system, which performs linear computations, into one which is non-linear. Rectified linear unit (RELU) calculates all input values given to it by employing f(x)=max (0, x) function. In essence, in this layer, all negative input values are replaced by 0. As a consequence, this layer increases the non-linear features of the network and the model while the features extracted from convolutional layer remains intact [46]. RELU formula is given in Eq. (13).
$\operatorname{ReLU}(x)=\max (x, 0)$ (13)
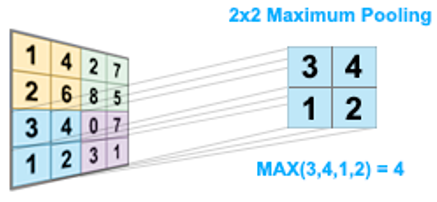
Pooling is another essential operation performed after applying convolution and RELU in the previous layers. Primary target of pooling is to decrease the number of parameters as well as to reduce the overall computational cost. Pooling layer runs independent of each feature map. Of all pooling methods, maximum pooling might be considered to be the most prevalent one among its counterparts. A max pooling example is shown in Figure 4.
Figure 4. Illustration of the maximum pooling
Upon the termination of creating subsampled features from convolutional and RELU layers, these features are connected to the fully-connected layer. Extracted features are connected to either one or more fully-connected layer. Here, each input is connected to one output, and each neuron has an associated weight value that can be learned [46]. The last fully-connected layer, generally, has the same number of output nodes and classes, and classification is made in this layer. Even though it is possible to employ distinct classifiers in the last layer, Softmax, most of the time, is the one that is preferred more frequently. Softmax formula is given in Eq. (14), where e denotes exponential function, xi and xk are the elements of the input vector, respectively. Softmax ensures that the output values of neurons lie in the interval (0, 1).
$\operatorname{Softmax}\left(x_i\right)=\frac{\mathrm{e}^{x_i}}{\sum_{\mathrm{k}=1}^{\mathrm{N}} \mathrm{e}^{x_k}}$ (14)
In CNN architecture, that is exploited in our study, is made up of 1 input layer, 2 convolutional layers, 2 pooling layers, 2 fully-connected layers, and 1 output layer. There are 8 different layers in total in the designed architecture. There are 128 convolution filters in the first convolutional layer while there are 64 convolution filters in the second convolutional layer. Additionaly, RELU is employed as the activation function. Moreover, following each convolution and RELU operation performed, maximum pooling of size 2×1 is applied. Designed architecture is given in Table 1.
Table 1. Designed CNN architecture
|
No |
Layer Name |
Explanation |
Properties |
|
1 |
Input |
Input Vector |
- |
|
2 |
'conv1' |
Convolution |
128 convolution filters of size 12×12 |
|
3 |
'relu1' |
ReLu |
- |
|
4 |
'pool1' |
Maximum Pooling |
2×1 pooling |
|
5 |
'conv2' |
Convolution |
64 convolution filters of size 6×6 |
|
6 |
'relu2' |
ReLu |
- |
|
7 |
'pool2' |
Maximum Pooling |
2×1 pooling |
|
8 |
'fc1' |
Fully-connected Layer |
2048 neuron |
|
9 |
'relu3' |
ReLu |
- |
|
10 |
'drop1' |
Dropout |
50% dropout |
|
11 |
'fc2' |
Fully-connected Layer |
2048 neuron |
|
12 |
Output |
Softmax |
3 classes |
5.1 Chest X-Ray dataset collection and description
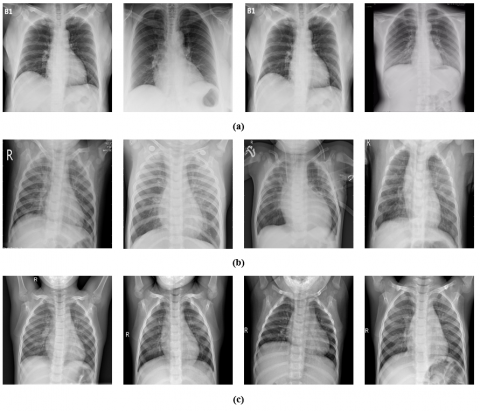
In our work, a well-known open access dataset, which is prevalently chosen in the context, and therefore, is thought of being accepted as a benchmark, is exploited. The dataset, employed, is called COVID-19 Radiography [47, 48] and it is gathered together by making use of the Kaggle database. Further information regarding the data set is provided in Table 2. There are three classes in the COVID-19 Radiography dataset, namely, COVID-19, normal and pneumonia. Furthermore, of all images, 1143 images belong to COVID-19 class, 1341 belong to normal class, and 1345 belong to pneumonia class. Sample chest X-ray images in each class are shown in Figure 5.
Table 2. Description of the dataset used
|
Dataset Name |
COVID-19 |
Normal |
Pneumonia |
|
COVID-19 Radiography Database [47, 48] |
1143 |
1341 |
1345 |
Figure 5. Sample X-ray data: (a) COVID-19, (b) Pneumonia, (c) Normal
5.2 Evaluation metrics
Accuracy, precision and sensitivity are computed to evaluate the performance of our method. The formulas of the performance metrics are given in Eqns. (15)-(17). For Eqns. (15)-(17), the study [49] can be referred.
Accuracy $=\frac{|\mathrm{TP}|+|\mathrm{TN}|}{|\mathrm{TP}|+|\mathrm{FP}|+|\mathrm{FN}|+|\mathrm{TN}|}$ (15)
Precision $=\frac{|\mathrm{TP}|}{|\mathrm{TP}|+|\mathrm{FP}|}$ (16)
Sensitivity $=\frac{|\mathrm{TP}|}{|\mathrm{TP}|+|\mathrm{FN}|}$ (17)
5.3 Experimental results
Having described in this section are the results obtained from the experiments based on our proposed method. The proposed model was developed using MATLAB 2020b and tested on a computer with an intel core i7 processor running at 5.0GHz processor, 32GB memory, and RTX 3050 OC 8GB GPU hardware. Using a 10-fold cross-validation technique, chest X-ray images are randomly divided as training set and test set. The network is trained by adjusting altered hyperparameters such as mini-batch size and learning rate. Network is trained using different hyperparameters in the study. The mini-batch sizes are 32, 64, 128 whereas learning rates are chosen as 0.1, 0.01 and 0.001. The epoch range is chosen as 25.
Table 3 showing the results for CNN without image enhancement can be summarized as follows:
Table 4 showing the results for CNN after applying contrast enhancement with multi-objective cuckoo search can be summarized as follows:
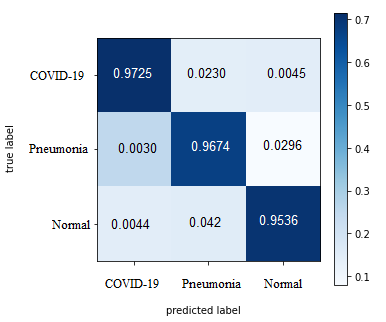
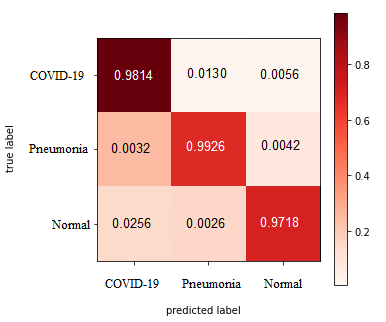
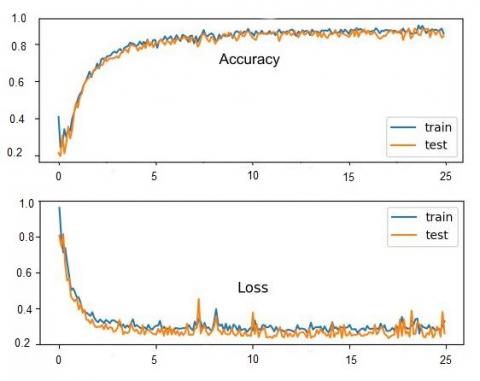
The confusion matrix is given in Figure 6. This indicates the peak accuracy received from networks. The accuracy and loss curves of the best results found in the training and test sequences are shown in Figure 7.
Table 3. Results obtained from CNN without image enhancement
|
Model |
Batch-Size |
Learning Rate |
Accuracy % |
Precision % |
Sensitivity % |
|
CNN (without image enhancement) |
32 |
0.1 |
96.57 |
96.17 |
95.43 |
|
0.01 |
95.16 |
95.69 |
96.93 |
||
|
0.001 |
95.51 |
95.06 |
96.32 |
||
|
64 |
0.1 |
95.24 |
96.36 |
95.31 |
|
|
0.01 |
96.74 |
96.65 |
96.78 |
||
|
0.001 |
95.78 |
96.01 |
96.04 |
||
|
128 |
0.1 |
95.83 |
95.03 |
97.15 |
|
|
0.01 |
96.52 |
96.66 |
95.25 |
||
|
0.001 |
96.54 |
96.59 |
95.83 |
Table 4. Results obtained from CNN after applying contrast enhancement with multi-objective cuckoo search algorithm
|
Model |
Batch-Size |
Learning Rate |
Accuracy % |
Precision % |
Sensitivity % |
|
CNN (with image enhancement) |
|
0.1 |
97.53 |
99.09 |
98.84 |
|
32 |
0.01 |
98.41 |
97.59 |
98.99 |
|
|
|
0.001 |
99.05 |
99.20 |
98.08 |
|
|
|
0.1 |
98.86 |
98.82 |
97.71 |
|
|
64 |
0.01 |
99.16 |
98.54 |
98.04 |
|
|
|
0.001 |
97.37 |
98.85 |
98.51 |
|
|
|
0.1 |
98.16 |
98.48 |
98.34 |
|
|
128 |
0.01 |
97.44 |
97.68 |
98.78 |
|
|
|
0.001 |
99.12 |
98.64 |
97.39 |
Table 5. Performance comparison with other studies using COVID-19 radiography dataset
|
Author |
Approach |
Accuracy (%) |
|
[47] |
DenseNet201 with image augmentation |
97.94 |
|
[50] |
ALexNet & LSTM |
98.70 |
|
[51] |
COVIDetectioNet with Relief |
99.18 |
|
[52] |
MobileNet |
87.5 |
|
[53] |
VGG-16 with histogram equalization |
98.75 |
|
[54] |
PDCOVIDNet |
96.58 |
|
Proposed System |
CNN model with MOCS-CLAHE image Enhancement |
99.12 |
|
(a) |
(b) |
Figure 6. Confusion matrix of two models: (a) without MOCS-CLAHE, (b) with MOCS-CLAHE
Figure 7. Graphs of accuracy and loss on training and validation data
In this study, a performance comparison of the proposed method for disease classification is made with current models objectively. An overview of important studies using the COVID-19 radiography dataset is presented in Table 5. Which summarizes the studies that used other datasets for COVID-19 detection.
A research paper that used pre-trained deep networks with transfer learning, achieved 97.94% accuracy in detecting COVID-19 disease using images from the data set. Chowdhury et al. [47] applied data augmentation to images in the dataset to improving with DenseNet201. Aslan at al. [50] used two deep learning models. Firstly, they used AlexNet with the transfer learning technique, and secondly, used AlexNet and LSTM as hybridized. A better result was obtained a classification rate of 98.70% with applied hybrid method. Turkoglu et al. [51] used the COVIDetectioNet model. In this used model, features are derived from the convolutional and fully connected layers of the pre-trained AlexNet architecture. In addition, the most effective features were determined using the ReliefF feature selection algorithm and was obtained classification success 99.18. Arifin et al. [52] used a deep learning-based MobileNet and obtained classification success 87.5%. Progga et al. [53] used VGG-16, VGG-19 and MobilNetV2 networks in their own offered model. They increased the diversity in the dataset by histogram equalization and achieved a 98.75% success rate with VGG-16. Chowdhury et al. [54] used a deep learning-based model called PDCOVIDNet. They obtained rate of accuracy 96.58% with this model. The second highest accuracy achieved in this table is by the proposed system, which uses a CNN model with MOCS-CLAHE image enhancement, achieving an accuracy of 99.12%. This indicates the effectiveness of MOCS-CLAHE in enhancing the images and improving the model's ability to detect COVID-19. However, it is important to note that these models are trained on a specific dataset and their performance may vary when applied to different datasets or real-world scenarios. Overall, the use of deep learning models for COVID-19 detection has shown promising results, with high accuracy achieved in several studies. These models have the potential to aid medical professionals in diagnosing COVID-19 cases quickly and accurately. However, further research is required to ensure the reliability and generalizability of these models before they can be widely adopted in clinical practice. Despite the high accuracy achieved by some of these models, there are still limitations to consider. One major challenge is the lack of large and diverse COVID-19 datasets, which can affect the generalizability of the models. Additionally, the accuracy of the models can be impacted by factors such as image quality, variability in imaging equipment, and the prevalence of COVID-19 in the population. Therefore, it is important to continue collecting and curating large and diverse datasets to ensure the reliability and generalizability of these models. Deep learning models have shown great potential for COVID-19 detection using X-ray and CT scan images. While the models listed in the table have achieved high accuracy, it is important to consider their limitations and the need for further research.
It is very significant to detect the patients who got infected by COVID-19 in an early stage in order to prevent the disease from spreading among people rapidly. Furthermore, since the number of test kits for the diagnosis of COVID-19 are limited and are not readily reached to health practitioners, it gives rise to come up with a better and faster method as a replacement for test kits. In our study, we exploit MOCS-CLAHE together with CNNs. By employing MOCS-CLAHE, we ensure to obtain the optimal parameter values for the contrast enhancement of the chest X-ray images which pave the way for the most accurate classification to be made by CNNs. Finally, experimental results prove that outputs of the CNNs used in our study have higher accuracy rates for classifying three cases, namely, COVID-19, normal, and pneumonia. In the wake of our experiments, it is seen that our method has 99.16% accuracy rate, 99.20% precision rate, and 98.99% sensitivity rate which can be considered to be relatively successful compared with other methods used in the literature. Although training CNNs are computationally expensive and large number of images are required to prevent overfitting, less time is consumed for the prediction of new cases after training. In addition, without pre-knowledge, the proposed system can enhance the image via MOCS-CLAHE method. This will provide enhanced data to deep learning model, which will help to increase overall accuracy. As a consequence, experimental results clarify that our method can be used by health practitioners to diagnose COVID-19 cases reliably and rapidly. The major drawback of this method is selecting optimum MOCS parameters according to device. Some old machines might be incapable to process a huge population belong to MOCS, for enhancing x-ray images. Because of this situation, population size should be selected carefully. Also, a relatively less population size can lead the algorithm to get stuck in a suboptimal solution and fail to converge to the global optimum, which is the best possible solution for the problem. The method proposed in this paper can be employed in health clinics for providing more information to the experts. The results of this study have important managerial implications for healthcare practitioners and policymakers involved in COVID-19 diagnosis and treatment. Firstly, the deep learning model developed in this study demonstrates high accuracy in detecting COVID-19 from X-ray images, providing a valuable tool for healthcare providers in identifying potential cases. This can help in early detection, isolation, and treatment of COVID-19 patients, potentially reducing the spread of the virus and improving patient outcomes. Secondly, our study shows that the use of image enhancement techniques, such as MOCS-CLAHE enhancement, can improve the accuracy of the deep learning model in detecting COVID-19 from X-ray images. This suggests that healthcare providers can potentially improve the quality of X-ray images and enhance the performance of the deep learning model by using these techniques. Furthermore, the study highlights the importance of image quality in accurate COVID-19 diagnosis and emphasizes the need for standardized image acquisition protocols to ensure reliable results. Lastly, the study emphasizes the importance of large and diverse COVID-19 datasets in training deep learning models for accurate COVID-19 diagnosis. Policymakers and healthcare providers should prioritize the collection and sharing of large and diverse datasets to improve the generalizability and reliability of COVID-19 detection models. This can potentially lead to more accurate and efficient COVID-19 diagnosis and management, reducing the burden on healthcare systems and improving patient outcomes. In the future studies, hybrid optimization techniques which combines one or more optimization algorithms to run together can be opted in COVID-19 diagnosis. These hybrid optimization techniques can be employed together with more advanced deep learning architectures to increase accuracy.
|
CNN |
Convolutional neural networks |
|
EOG |
Electrooculography |
|
ECG EEG |
Electrocardiography Electroencephalography |
|
CLAHE |
Contrast limited adaptive histogram equalization algorithm |
|
MOCS |
Multi-objective cuckoo search algorithm optimization |
|
WHO |
World health organization |
[1] Pathak, Y., Shukla, P.K., Tiwari, A., Stalin, S., Singh, S. (2022). Deep transfer learning based classification model for COVID-19 disease. IRBM, 43(2): 87-92. https://doi.org/10.1016/j.irbm.2020.05.003
[2] Ahmed, H.M., Abdullah, B.W. (2021). Overview of deep learning models for identification Covid-19. Materials Today. Proceedings. https://doi.org/10.1016/j.matpr.2021.05.553
[3] Wu, X., Chen, C., Zhong, M., Wang, J., Shi, J. (2021). COVID-AL: The diagnosis of COVID-19 with deep active learning. Medical Image Analysis, 68: 101913. https://doi.org/10.1016/j.media.2020.101913
[4] Alakus, T.B., Turkoglu, I. (2020). Comparison of deep learning approaches to predict COVID-19 infection. Chaos, Solitons & Fractals, 140: 110120. https://doi.org/10.1016/j.chaos.2020.110120
[5] Zhou, T., Lu, H., Yang, Z., Qiu, S., Huo, B., Dong, Y. (2021). The ensemble deep learning model for novel COVID-19 on CT images. Applied Soft Computing, 98: 106885. https://doi.org/10.1016/j.asoc.2020.106885
[6] Ding, X., Xu, J., Zhou, J., Long, Q. (2020). Chest CT findings of COVID-19 pneumonia by duration of symptoms. European Journal of Radiology, 127: 109009. https://doi.org/10.1016/j.ejrad.2020.109009
[7] Bhattacharya, S., Maddikunta, P.K.R., Pham, Q.V., Gadekallu, T.R., Chowdhary, C.L., Alazab, M., Piran, M.J. (2021). Deep learning and medical image processing for coronavirus (COVID-19) pandemic: A survey. Sustainable Cities and Society, 65: 102589. https://doi.org/10.1016/j.scs.2020.102589
[8] Panwar, H., Gupta, P.K., Siddiqui, M.K., Morales-Menendez, R., Bhardwaj, P., Singh, V. (2020). A deep learning and grad-CAM based color visualization approach for fast detection of COVID-19 cases using chest X-ray and CT-Scan images. Chaos, Solitons & Fractals, 140: 110190. https://doi.org/10.1016/j.chaos.2020.110190
[9] Brogna, B., Bignardi, E., Brogna, C., Alberigo, M., Grappone, M., Megliola, A., Salvatore, P., Fontanella, G., Mazza, E.M., Musto, L. (2021). Typical CT findings of COVID-19 pneumonia in patients presenting with repetitive negative RT-PCR. Radiography, 27(2): 743-747. https://doi.org/10.1016/j.radi.2020.09.012
[10] Islam, M.Z., Islam, M.M., Asraf, A. (2020). A combined deep CNN-LSTM network for the detection of novel coronavirus (COVID-19) using X-ray images. Informatics in Medicine Unlocked, 20: 100412. https://doi.org/10.1016/j.imu.2020.100412
[11] Pan, Y., Li, X., Yang, G., Fan, J., Tang, Y., Zhao, J., Long, X., Guo, S., Zhao, Z., Liu, Y., Hu, H., Xue, H., Li, Y. (2020). Serological immunochromatographic approach in diagnosis with SARS-CoV-2 infected COVID-19 patients. Journal of Infection, 81(1): e28-e32. https://doi.org/10.1016/j.jinf.2020.03.051
[12] Wang, S., Kang, B., Ma, J., Zeng, X., Xiao, M., Guo, J., Cai, M., Yang, J., Li, Y., Meng, X., Xu, B. (2021). A deep learning algorithm using CT images to screen for corona virus disease (COVID-19). European Radiology, 31: 6096-6104. https://doi.org/10.1007/s00330-021-07715-1
[13] Hertel, R., Benlamri, R. (2021). COV-SNET: A deep learning model for X-ray-based COVID-19 classification. Informatics in Medicine Unlocked, 24: 100620. https://doi.org/10.1016/j.imu.2021.100620
[14] Qin, C., Yao, D., Shi, Y., Song, Z. (2018). Computer-aided detection in chest radiography based on artificial intelligence: A survey. Biomedical Engineering Online, 17(1): 1-23. https://doi.org/10.1186/s12938-018-0544-y
[15] Jalali, S.M.J., Ahmadian, M., Ahmadian, S., Khosravi, A., Alazab, M., Nahavandi, S. (2021). An oppositional-Cauchy based GSK evolutionary algorithm with a novel deep ensemble reinforcement learning strategy for COVID-19 diagnosis. Applied Soft Computing, 111: 107675. https://doi.org/10.1016/j.asoc.2021.107675
[16] Kuran, U., Kuran, E.C. (2021). Parameter selection for CLAHE using multi-objective cuckoo search algorithm for image contrast enhancement. Intelligent Systems with Applications, 12: 200051. https://doi.org/10.1016/j.iswa.2021.200051
[17] Narin, A., Kaya, C., Pamuk, Z. (2021). Automatic detection of coronavirus disease (covid-19) using x-ray images and deep convolutional neural networks. Pattern Analysis and Applications, 24: 1207-1220. https://doi.org/10.1007/s10044-021-00984-y
[18] Apostolopoulos, I.D., Mpesiana, T.A. (2020). Covid-19: automatic detection from x-ray images utilizing transfer learning with convolutional neural networks. Physical and Engineering Sciences in Medicine, 43: 635-640. https://doi.org/10.1007/s13246-020-00865-4
[19] Minaee, S., Kafieh, R., Sonka, M., Yazdani, S., Soufi, G.J. (2020). Deep-COVID: Predicting COVID-19 from chest X-ray images using deep transfer learning. Medical Image Analysis, 65: 101794. https://doi.org/10.1016/j.media.2020.101794
[20] Kumar, S., Mishra, S., Singh, S.K. (2021). Deep transfer learning-based COVID-19 prediction using chest X-rays. Journal of Health Management, 23(4): 730-746. https://doi.org 10.1177/09720634211050425
[21] Ai, T., Yang, Z., Hou, H., Zhan, C., Chen, C., Lv, W., Tao, Q., Sun, Z., Xia, L. (2020). Correlation of chest CT and RT-PCR testing for coronavirus disease 2019 (COVID-19) in China: A report of 1014 cases. Radiology, 296(2): E32-E40. https://doi.org/10.1148/radiol.2020200642
[22] Chung, M., Bernheim, A., Mei, X., Zhang, N., Huang, M., Zeng, X., Cui, J., Xu, W., Yang, Y., Fayad, Z.A., Jacobi, A., Li, K., Li, S., Shan, H. (2020). CT imaging features of 2019 novel coronavirus (2019-nCoV). Radiology, 295(1): 202-207. https://doi.org/10.1148/radiol.2020200230
[23] Khan, A.I., Shah, J.L., Bhat, M.M. (2020). CoroNet: A deep neural network for detection and diagnosis of COVID-19 from chest x-ray images. Computer Methods and Programs in Biomedicine, 196: 105581. https://doi.org/10.1016/j.cmpb.2020.105581
[24] Ismael, A.M., Şengür, A. (2021). Deep learning approaches for COVID-19 detection based on chest X-ray images. Expert Systems with Applications, 164: 114054. https://doi.org/10.1016/j.eswa.2020.114054
[25] Ardakani, A.A., Kanafi, A.R., Acharya, U.R., Khadem, N., Mohammadi, A. (2020). Application of deep learning technique to manage COVID-19 in routine clinical practice using CT images: Results of 10 convolutional neural networks. Computers in Biology and Medicine, 121: 103795. https://doi.org/10.1016/j.compbiomed.2020.103795
[26] Oh, Y., Park, S., Ye, J.C. (2020). Deep learning COVID-19 features on CXR using limited training data sets. IEEE Transactions on Medical Imaging, 39(8): 2688-2700. https://doi.org/10.1109/TMI.2020.2993291
[27] Li, J., Wang, Y., Wang, S., Wang, J., Liu, J., Jin, Q., Sun, L. (2021). Multiscale attention guided network for COVID-19 diagnosis using chest X-ray images. IEEE Journal of Biomedical and Health Informatics, 25(5): 1336-1346. https://doi.org/10.1109/JBHI.2021.3058293
[28] Dilshad, S., Singh, N., Atif, M., Hanif, A., Yaqub, N., Farooq, W.A., Ahmad, H., Chu, Y.M., Masood, M.T. (2021). Automated image classification of chest X-rays of COVID-19 using deep transfer learning. Results in Physics, 28: 104529. https://doi.org/10.1016/j.rinp.2021.104529
[29] Yoo, S.H., Geng, H., Chiu, T.L., Yu, S.K., Cho, D.C., Heo, J., Choi, M.S., Choi, I.H., Van, C.C., Nhung, N.V., Min, B.J., Lee, H. (2020). Deep learning-based decision-tree classifier for COVID-19 diagnosis from chest X-ray imaging. Frontiers in Medicine, 7: 427. https://doi.org/10.3389/fmed.2020.00427
[30] Aminu, M., Ahmad, N.A., Noor, M.H.M. (2021). Covid-19 detection via deep neural network and occlusion sensitivity maps. Alexandria Engineering Journal, 60(5): 4829-4855. https://doi.org/10.1016/j.aej.2021.03.052
[31] Ohata, E.F., Bezerra, G.M., das Chagas, J.V.S., Neto, A.V.L., Albuquerque, A.B., De Albuquerque, V.H.C., Reboucas Filho, P.P. (2020). Automatic detection of COVID-19 infection using chest X-ray images through transfer learning. IEEE/CAA Journal of Automatica Sinica, 8(1): 239-248. https://doi.org/10.1109/JAS.2020.1003393
[32] Haksoro, E.I., Setiawan, A. (2021). Pengenalan jamur yang dapat dikonsumsi menggunakan metode transfer learning pada convolutional neural network. Jurnal Eltikom: Jurnal Teknik Elektro, Teknologi Informasi dan Komputer, 5(2): 81-91. https://doi.org/10.31961/eltikom.v5i2.428
[33] Acharya, U.K., Kumar, S. (2021). Genetic algorithm based adaptive histogram equalization (GAAHE) technique for medical image enhancement. Optik, 230: 166273. https://doi.org/10.1016/j.ijleo.2021.166273
[34] Oloyede, M.O., Onumanyi, A.J., Bello-Salau, H., Djouani, K., Kurien, A. (2022). Exploratory analysis of different metaheuristic optimization methods for medical image enhancement. IEEE Access, 10: 28014-28036. https://doi.org/10.1109/ACCESS.2022.3158324
[35] Ghosh, S.K., Ghosh, A. (2022). ENResNet: A novel residual neural network for chest X-ray enhancement based COVID-19 detection. Biomedical Signal Processing and Control, 72: 103286. https://doi.org/10.1016/j.bspc.2021.103286
[36] Siracusano, G., La Corte, A., Gaeta, M., Cicero, G., Chiappini, M., Finocchio, G. (2020). Pipeline for advanced contrast enhancement (PACE) of chest x-ray in evaluating COVID-19 patients by combining bidimensional empirical mode decomposition and contrast limited adaptive histogram equalization (CLAHE). Sustainability, 12(20): 8573. https://doi.org/10.3390/su12208573
[37] Yang, X.S., Deb, S. (2013). Multiobjective cuckoo search for design optimization. Computers & Operations Research, 40(6): 1616-1624. https://doi.org/10.1016/j.cor.2011.09.026
[38] Pizer, S.M., Amburn, E.P., Austin, J.D., Cromartie, R., Geselowitz, A., Greer, T., Romeny, B.H., Zimmerman J.B., Zuiderveld, K. (1987). Adaptive histogram equalization and its variations. Computer Vision, Graphics, And Image Processing, 39(3): 355-368. https://doi.org/10.1016/S0734-189X(87)80186-X
[39] Yang, X.S., Deb, S. (2009). Cuckoo Search via Lévy flights. in 2009 World Congress on Nature & Biologically Inspired Computing (NaBIC), pp. 210-214. https://doi.org/10.1109/NABIC.2009.5393690
[40] Gonzalez, R.C., Woods, R.E., Masters, B.R. (2009). Digital image processing, third edition. Journal of Biomedical Optics, 14(2): 029901. https://doi.org/10.1117/1.3115362
[41] Patel, O., Maravi, Y.P., Sharma, S. (2013). A comparative study of histogram equalization based image enhancement techniques for brightness preservation and contrast enhancement. An International Journal (SIPIJ) arXiv Preprint arXiv: 1311.4033. https://doi.org/10.5121/sipij.2013.4502
[42] Immerkaer, J. (1996). Fast noise variance estimation. Computer Vision and Image Understanding, 64(2): 300-302. https://doi.org/10.1006/cviu.1996.0060
[43] Fu, Y., Aldrich, C. (2019). Flotation froth image recognition with convolutional neural networks. Minerals Engineering, 132: 183-190. https://doi.org/10.1016/j.mineng.2018.12.011
[44] Gülcü, A., Zeki, K.U.Ş. (2019). Konvolüsyonel sinir ağlarında hiper-parametre optimizasyonu yöntemlerinin incelenmesi. Gazi University Journal of Science Part C: Design and Technology, 7(2): 503-522. https://doi.org/10.29109/gujsc.514483
[45] Ciresan, D.C., Meier, U., Masci, J., Gambardella, L.M., Schmidhuber, J. (2011). Flexible, high performance convolutional neural networks for image classification. In Twenty-Second International Joint Conference on Artificial Intelligence.
[46] ER, M.B. (2020). Akciğer seslerinin derin öğrenme ile siniflandirilmasi. Gazi University Journal of Science Part C: Design and Technology, 8(4): 830-844. https://doi.org/10.29109/gujsc.758325
[47] Chowdhury, M.E., Rahman, T., Khandakar, A., Mazhar, R., Kadir, M.A., Mahbub, Z.B., Islam, K.R., Khan, M.S., Iqbal, A., Emadi, N.A., Reaz, M.B.I., Islam, M.T. (2020). Can ai help in screening viral and COVID-19 pneumonia? IEEE Access, 8: 132665-132676. https://doi.org/10.1109/ACCESS.2020.3010287
[48] Rahman, T., Khandakar, A., Qiblawey, Y., Tahir, A., Kiranyaz, S., Kashem, S.B.A., Islam, M.T., Maadeed, S.A., Zughaier, S.M., Khan, M.S., Chowdhury, M.E.H. (2021). Exploring the effect of image enhancement techniques on COVID-19 detection using chest X-ray images. Computers in Biology and Medicine, 132: 104319. https://doi.org/10.1016/j.compbiomed.2021.104319
[49] Fjodorova, N., Vračko, M., Novič, M., Roncaglioni, A., Benfenati, E. (2010). New public QSAR model for carcinogenicity. In Chemistry Central Journal. Springer International Publishing, 4: 1-15. https://doi.org/10.1186/1752-153X-4-S1-S3
[50] Aslan, M.F., Unlersen, M.F., Sabanci, K., Durdu, A. (2021). CNN-based transfer learning-BiLSTM network: A novel approach for COVID-19 infection detection. Applied Soft Computing, 98: 106912. https://doi.org/10.1016/j.asoc.2020.106912
[51] Turkoglu, M. (2021). COVIDetectioNet: COVID-19 diagnosis system based on X-ray images using features selected from pre-learned deep features ensemble. Applied Intelligence, 51(3): 1213-1226. https://doi.org/10.1007/s10489-020-01888-w
[52] Arifin, F., Artanto, H., Nurhasanah, T.S.G. (2021). Fast COVID-19 detection of chest X-ray images using single shot detection mobilenet convolutional neural networks. Journal of Southwest Jiaotong University, 56(2). https://doi.org/10.35741/issn.0258-2724.56.2.19
[53] Progga, N.I., Hossain, M.S., Andersson, K. (2020). A deep transfer learning approach to diagnose covid-19 using x-ray images. In 2020 IEEE International Women in Engineering (WIE) Conference on Electrical and Computer Engineering (WIECON-ECE), pp. 177-182. https://doi.org/10.1109/WIECON-ECE52138.2020.9398037
[54] Chowdhury, N.K., Rahman, M.M., Kabir, M.A. (2020). PDCOVIDNet: A parallel-dilated convolutional neural network architecture for detecting COVID-19 from chest X-ray images. Health Information Science and Systems, 8(1): 27. https://doi.org/10.1007/s13755-020-00119-3