Velpula Sekhara Babu*![]() | Nidumolu Venkatram
| Nidumolu Venkatram![]()
©2024 The authors. This article is published by IIETA and is licensed under the CC BY 4.0 license (http://creativecommons.org/licenses/by/4.0/).
OPEN ACCESS
In precision agriculture, detection of weed is vital to control or remove it, as the weeds will impact the crop’s yield. Also accurately distinguishing weeds and crop and their localization is important, to reduce the herbicides and pesticides usage. Deep learning techniques are effective for classification and detection of these. You Only Look Once v4 (YOLOv4) deep learning architecture is very widely used for object detection and localization of objects in an image. In this work, YOLOv4 is used for detection and localization of weeds in soybean fields. The experiments are done on publicly available soybean and weed dataset containing soybean, grass, broadleaf and soil images, each group having 1000 images. YOLOv4 architecture yielded an accuracy of 98.42%, recall of 93.13% and mAP of 81.24%, better than the performance of R-CNN and SSD networks. Additionally, different pre-trained networks viz., Darknet19, Mobilenetv2, VGG19, Resnet18, Inceptionv3 and Densenet201 are also investigated for classification of weed/crop which yielded an accuracy of 98.75%, 98.9%, 99.25%, 99.25%, 99.42%, 99.58% and 99.67% respectively. For preprocessing of images CLAHE algorithm is used. From different models investigated, it is observed that YOLOv4 is efficient for both classification and detection along with localization.
weed detection, convolutional neural networks, object detection, localization, precision agriculture, YOLOv4
Soybean is a widely grown edible oil seed as it is rich protein food for human being and animals. Animal consumes it through soybean meal, and humans use it as oil. According to Soy stats, Brazil is the world’s major soybean producer and it shares around 25% of edible oil. It is needed to improve the quality and quantity of soybean by removing weeds. Weeds can compete with soybean plants for essential resources like water nutrients and sunlight, and so crop yield can be negatively impacted. Also weeds increase the risk of disease and pests, interfere the harvest and post-harvest process, thus increasing the production cost. So accurate and efficient weed detection model is needed to optimize crop yields quality, minimize herbicide usage and production costs, promoting sustainable and eco-friendly farming practices and enable precision weed management. At present, for weed management herbicides are sprayed, which causes harmful environmental effects. Locating the weed precisely and spraying the herbicides at the specific location reduces the adverse effects. Additionally, weeds and soybean are similar in color and shape, Intra- and inter-species variability of weeds in terms of its features like shape, size, color, and texture is also very less. So accurate and robust detection of weeds remains as a challenging task. To address this issue various technologies and methods have been developed for detection of weeds in soybean field. Earlier methods include visual inspection of the field by farmers, where weeds are identified by their appearance and manually removed. This is labor- intensive and time –consuming, not practical for large fields. Later feature based methods are used considering color, histograms, texture descriptors and shape features. In recent years, machine learning algorithms like Support vector machines (SVM), K-nearest neighbors (K-NN), etc. are used for classification. These methods have limitations that they may not have capability to learn and adapt to variations in lighting conditions, view point and background clutter.
Deep learning models such as convolutional neural networks (CNNs) has ability to handle complex and diverse datasets effectively. In object detection, to localize the multiple objects popular models like single shot multibox detector (SSD), region based convolutional neural network (R-CNN) and You Only Look Once (YOLO) are widely used. In order to improve the detection accuracy and to increase the robustness of the model, Contrast Limited Adaptive Histogram Equalization (CLAHE) is used for preprocessing.
The objectives of this paper are as follows:
This paper is organized into five chapters. Chapter2 is for literature work on earlier traditional feature based algorithms and deep learning algorithms used in weed/crop detection. Chapter3 presents the Data Acquisition, labeling, and implementation of YOLOv4 with Loss function. Chapter4 presents the simulation results along with performance analysis of different pre-defined networks, R-CNN, SSD and YOLOv4. Finally, chapter5 concludes with some multi- directions for future work.
Weeds are the major concern in crop production as they affect the crop yield. About 30% of crop yield being effected worldwide due to weeds [1]. Presently, weed control is done by spraying herbicides on the whole field, instead of precisely spraying on weeds. Due to this the food products contain herbicides residue which is harmful and also crop yield may get effected [2]. Hence there is need to develop efficient weed control methods for harvesting crops with good yield. Precise weed identification and localization is a challenging task for development of automated weed control methods.
In the early methods, computer vision is used for classifying and detecting objects. To process the weed images and extract their features different feature extraction methods are used [3]. With computer vision techniques, features like color, shape and texture are used to identify and differentiate soybean crop or weed [4]. However, selection of significant features suitable for the application is very difficult and also the extraction of features is time consuming. To improve the performance of image classification, machine learning techniques gained attention in recent years [5]. However, in machine learning techniques feature extraction has to be done before training the classifier like Support Vector machine [6-8]. The researchers used color and texture features for discriminating Soybean crops and weeds. For this RGB and HSV color spaces, Gray Level Co-occurrence Matrix (GLCM), and Local Binary Pattern (LBP) features are used to train the Support Vector Machine (SVM) classifier yielding an accuracy of about 96%. The researchers applied different classifiers like KNN, Random Forest and SVM on unmanned aerial vehicle images for Classifying weed and soybean accuracy of 91.34% [9]. Machine learning methods have gained significant attention in due to ability to make predictions, classify and extract values insights from large datasets. But the disadvantage and challenges of machine learning methods is that it takes a long time to extract features, huge dataset is required for training and decision making. Also high quality, clean and well-structured dataset is essential.
In recent years, Deep learning methods are widely used in image classification applications. In deep learning models, the features are learned automatically from the raw data. Compared to machine learning models, deep learning produces the better models. Particularly, Convolution Neural Networks (CNN) performs better than other machine learning models for the task of classifying images [10]. Selection of features and Automatic feature extraction was made possible in Deep learning with convolution layers. With availability of high speed computational systems with high memory capacity, researchers started using deep learning networks in several fields including agriculture [11-13]. The researchers used convNets for weed detection in soybean crop, yielding an accuracy of 98% [14]. Convolutional Neural Networks (CNN) and other architectures like MobileNetV2, ResNet50 are widely used for weed detection. The researchers compared the detection using different models viz., MobileNetV2, ResNet50 and custom CNN models for weed detection in real-time and recorded the accuracy as 97.7% with a custom CNN model [15]. For weed removal or control, along with wee detection, finding its location is also important. Thus classification and localization are the two aspects to be considered. Different deep learning models are proposed in research for detection and localization. R-CNN uses region proposals to localize the objects within an image. Later improved models are suggested like Faster R-CNN and Mask R-CNN, which uses anchor box to locate the object and then predict the category of the object [16]. So these methods have two stages viz., Localization and prediction. YOLO [17] and SSD [18] on the other hand are Single-stage object detection methods, which perform a one-pass regression of class probabilities and bounding box locations. YOLO and its versions viz., YOLOv1, YOLOv2, YOLOv3, YOLOv4 etc. are used in different applications of object detection [19, 20]. YOLOv2 used for medical face mask detection [21], YOLOv3 with Darknet-53 for Target detection [22] and YOLOv4 for Human Detection [23], YOLO-sesame model weed detection [24], etc. Different researchers applied YOLO and its different versions weed detection. Deep learning based on YOLO-v2 is used for weed detection in romaine lettuce crop [25] and YOLOv4 is used for weed detection in carrot fields by Ying et al. [16]. For weed detection and localization in soybean field, this work investigated YOLOv4 model. For comparison, state-of-art models viz., R-CNN, SSD are investigated and various performance metrics are evaluated. Additionally, different pre-trained networks viz., Darknet19, Mobilenetv2, VGG19, Resnet18, Inceptionv3 and Densenet201 are also investigated for classification of weed/soybean crop. We found that the experimental results help to enable the precise targeting of weed control measures, avoiding the herbicides and reducing the environmental impact.
3.1 Data set
(a)
(b)
Figure 1. Sample images in dataset
For this work the data set used is a publicly available dataset from Kaggle website. Santos Ferreira used soybean images that are captured using drone, contains soybean images, grass images, broadleaf images and soil images. From this we considered grass and broad leaf as weed and soybean as crop. The data set is split into three parts. Sixty percent is for training, ten percentages for validation and remaining for testing. Example sample input images shown in Figure 1.
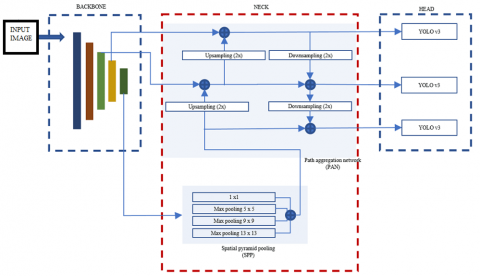
3.2 YOLOv4 architecture
YOLOv4 algorithm is used for accurate and efficient object detection tasks shown in Figure 2. It has three parts viz., backbone, neck and head network. The backbone is based on CSPDarknet53 (Cross Stage Partial Darknt53) to extract the hierarchical features from the input image. The cross-stage part represents connecting information across different stages of layers of the network, where as partial network implies that not all the layers or stages are used. CSPDarknet53 represents combination of Darknet framework and CSP architecture, using 53 layers in the network. Neck uses path aggregation network (PANet) and Spatial Attention Module (SAM). PANet helps the model to aggregate features from different layers and ability to detect objects at different scales and aspect ratios. SAM focus on relevant regions to enhance feature fusion. Head network is responsible for predicting bounding boxes and class probabilities, it has three detection sub heads, which are designed for corresponding objects at different scales. The prediction includes bounding box coordinates (x, y, width, and height), object score and class probabilities. FPN is for combining multi-scale features. It enhances the model’s ability to detect objects of various sizes and maintain good accuracy. SSP can improve the networks ability to detect objects at different spatial resolutions. It also allows the model to focus on both small and large objects in the image. SSP kernels size is 1×1, 5×5, 9×9 and 13×13 for max pooling, the stride is considered as 1.
3.3 YOLOv4 loss function
In YOLOv4, object detection model, the loss function is composed of three components viz., classification loss, localization loss and confidence loss. These are used to train the model to accurately detect objects in an image. Classification loss is used to determine how well the model classifies objects within each grid cell. If an object is present in the grid cell then classification loss is computed. If there is no object present in the cell, the loss is calculated based on confidence score, which should be close to zero. The Localization loss or Regression loss is used to measure how well the model predicts the bounding box coordinates for each objects in the image. Confidence loss on the other hand measures how well the model predicts the confidence score, which indicates the likelihood that an object exists within a grid cell. These three loss functions are combined to form the final loss function used for training YOLOv4.
Classification loss can be evaluated as given by Eq. (1):
$\sum_{i=0}^{S^2} 1_i^{\text {obj }} \sum_{c \in \text { classes }}\left(p_i(c)-p_i^{\wedge}(c)\right)^2$ (1)
Here, $1_i^{o b j}=1$ means the object present in the cell or else it is zero, and $p_i^{\wedge}(c)$ is class 'c' conditional class probability. Localization loss evaluated using Eq. (2):
$\begin{gathered}\lambda_{\text {coord }} \sum_{i=0}^{S^2} \sum_{j=0}^B 1_{i j}^{o b j}\left[\left(x_i-x_i^{\wedge}\right)^2+\left(y_i-y_i^{\wedge}\right)^2\right]+ \\ \lambda_{\text {coord }} \sum_{i=0}^{S^2} \sum_{j=0}^B 1_{i j}^{o b j}\left[\left(\sqrt{w_i}-\sqrt{w_i{ }^{\wedge}}\right)^2+\left(\sqrt{h_i}-\right.\right. \\ \left.\left.\sqrt{h_i{ }^{\wedge}}\right)^2\right]\end{gathered}$ (2)
Here, $1_{i j}^{o b j}=1 $ if the $\mathrm{j}^{\text {th }}$ bounding box of cell 'i' is accountable for object detection, or else it is 0.
Figure 2. Architecture of YOLOv4
Confidence loss is obtained by Eq. (3):
$\sum_{i=0}^{S^2} \sum_{j=0}^B 1_{i j}^{o b j}\left(c_i-c_i^{\wedge}\right)^2$ (3)
$c_i^{\wedge}$ gives the confidence scores of the box $\mathrm{j}$ in cell 'i'.
$1_{i j}^{o b j}=1$ if object is present in $j^{\text {th }}$ bounding box of cell 'i' or else it is 0 .
No object is detected means confidence loss is obtained using Eq. (4).
$\lambda_{\text {noobj }} \sum_{i=0}^{S^2} \sum_{j=0}^B 1_{i j}^{\text {noobj }}\left(c_i-c_i^{\wedge}\right)^2$ (4)
$1_{i j}^{\text {noobj }}$ is complement of $1_{i j}^{o b j}$.
$c_i^{\wedge}$ is $\mathrm{j}^{\text {th }}$ box of cell 'i' confidence score.
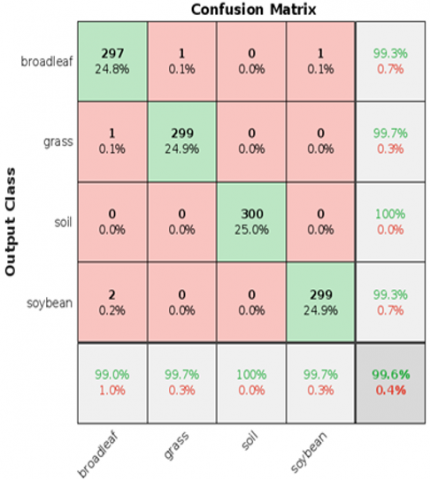
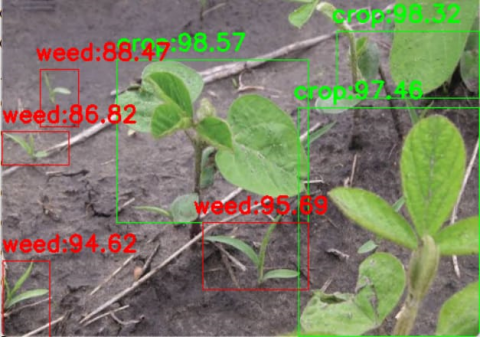
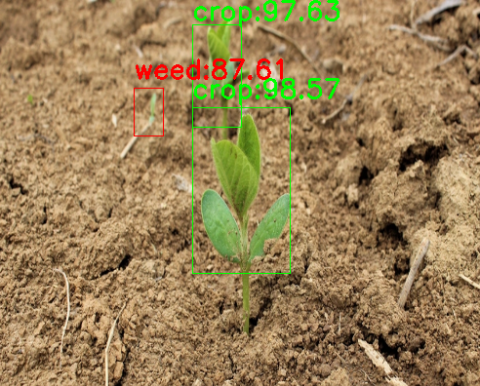
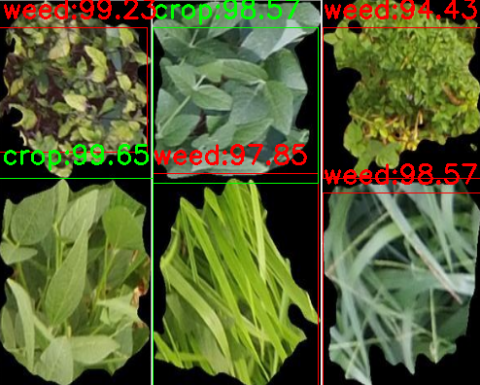
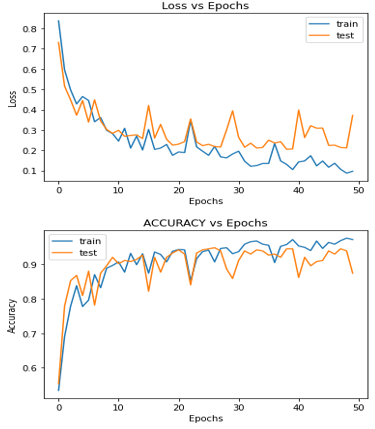
In this work, different pretrained models viz., Darknet19, Mobilenetv2, VGG19, Resnet18, Inceptionv3 and Densenet201 are applied with the dataset. Figure 3(a) shows the 2×2 confusion matrix, Figure 3(b) shows the confusion matrix for densenet201 and Table 1 shows the performance comparison of these networks with standard metrics viz., Accuracy, Recall, Precision, F1-score, etc. Table 2 shows the performance comparison of different networks, R-CNN, SSD with YOLOv4 using some standard metrics Accuracy, Recall and mAP values. YOLOv4 yielded best performance, for batch size of 64, 50 epochs and learning rate of 0.001. With more than 50 epochs, overfitting and less than it underfitting is observed. Figure 4(a), (b) and (c) show the output image with bounding boxes and corresponding confidence score. Figures 5-7 show curves of loss and accuracy for different Epochs of 25, 50 and 100.
System Specifications: Processor Intel(R) Core (TM) i5-1035G1 CPU @ 1.00GHz, 8.00 GB RAM.
Software used: MATLAB R2023a.
In deep learning, object detection and classification the standard performance metrics are calculated.
1. Accuracy = (TP +TN) / (TP+TN +FP +FN). Measures the overall correctness of the classification.
2. Precision = TP / (TP +FP). Measures the positive predictions.
3. Recall = TP / (TP + FN). Also called sensitivity or true positive rate. Which measure the ability of the to identify all relevant instances in the database.
4. F1-Score = 2 × (Precision × Recall) / (Precision + Recall). It is the harmonic mean of precision and recall, provides a balance between these two metrics.
5. Specificity = TN / (TN + FP). It measures the ability of the model to correctly identify negative instance.
(a)
(b)
Figure 3. Confusion matrix example and for Densenet201
Table 1. Classification performance with different pre-trained models
|
Neural Network |
Accuracy% |
Error% |
Recall% |
Specificity% |
Precision% |
False Positive Rate% |
F1_Score% |
|
Densenet201 |
99.67 |
0.33 |
99.67 |
99.89 |
99.67 |
0.11 |
99.67 |
|
Inceptionv3 |
99.58 |
0.42 |
99.58 |
99.86 |
99.59 |
0.14 |
99.58 |
|
Resnet18 |
99.42 |
0.58 |
99.42 |
99.81 |
99.42 |
0.19 |
99.42 |
|
Vgg19 |
99.25 |
0.75 |
99.25 |
99.75 |
99.26 |
0.25 |
99.25 |
|
Mobilenetv2 |
99.25 |
0.75 |
99.25 |
99.75 |
99.26 |
0.25 |
99.25 |
|
Darknet19 |
98.92 |
1.08 |
98.92 |
99.64 |
98.92 |
0.36 |
98.92 |
|
Google net |
97.42 |
2.58 |
97.42 |
99.14 |
97.52 |
0.86 |
97.41 |
6. False positive Rate (FPR) = FP / (TN + FP). Measures the proportion of negative instances that are incorrectly classified as positive.
7. Mean average Precision (mAP) = (AP_1 + AP_2 + …. +AP_N) / N. Where AP_1 + AP_2 + …. +AP_N are the average precision values each class. N is the total number of classes.
Average Precision(AP) = ∫(Precision(Recall) d_recall.
TP = True Positive.
TN = True Negative.
FP = False Positive.
Table 2. Detection performance of R-CNN, SSD and YOLOv4
|
Neural Network |
Accuracy |
Error |
Recall |
F1_Score% |
mAP |
|
R-CNN |
95.18 |
4.82 |
91.53 |
93.29 |
79.65 |
|
SSD |
96.26 |
2.74 |
86.41 |
91.05 |
74.13 |
|
YOLOv4 |
98.42 |
1.58 |
93.16 |
95.65 |
81.24 |
(a)
(b)
(c)
Figure 4. YOLOv4 detected crop and weed
Figure 5. Loss vs accuracy curves for 100 epochs
Figure 6. Loss vs accuracy curves for 100 epochs
Figure 7. Loss vs accuracy curves for 100 epochs
Different state-of-art deep learning models viz., Darknet19, Mobilenetv2, VGG19, Resnet18, Inceptionv3 and Densenet201 are trained and tested for classification of weed and soybean crop. Densenet201 yielded outstanding performance compared to other deep learning networks and previous research results. Also, for detection and localization YOLOv4, R-CNN and SSD networks are trained and tested. YOLOv4 achieved better overall performance than R-CNN, and SSD. YOLOv4 model detected accurately two types of weeds viz., broad leaf and grass. There are few limitations of this work. Firstly, all the models are tested with the publicly available dataset. Secondly, for detection and localization, images considered have crop and weeds with wide spacing. In future, from soybean fields the images are to be acquired at different stages of crop growth and with a greater number of weed types, to create a custom dataset. Further, detection of weeds in very closely spaced field is to be studied
[1] Gao, J., Nuyttens, D., Lootens, P., He, Y., Pieters, J.G. (2018). Recognising weeds in a maize crop using a random forest machine-learning algorithm and near-infrared snapshot mosaic hyperspectral imagery. Biosystems Engineering, 170: 39-50. https://doi.org/10.1016/j.biosystemseng.2018.03.006
[2] Partel, V., Kakarla, S.C., Ampatzidis, Y. (2019). Development and evaluation of a low-cost and smart technology for precision weed management utilizing artificial intelligence. Computers and Electronics in Agriculture, 157: 339-350. https://doi.org/10.1016/j.compag.2018.12.048
[3] Shamshiri, R., Weltzien, C., Hameed, I.A., Yule, I., Grift, T., Balasundram, S.K., Pitonakova, L., Ahmad, D., Chowdhary, G. (2018). Research and development in agricultural robotics: A perspective of digital farming. International Journal of Agricultural and Biological Engineering, 11(4): 1-14. https://doi.org/10.25165/j.ijabe.20181104.4278
[4] Mekhalfa, F., Yacef, F. (2021). Supervised learning for crop/weed classification based on color and texture features. arXiv preprint arXiv:2106.10581. https://doi.org/10.48550/arXiv.2106.10581
[5] Islam, N., Rashid, M.M., Wibowo, S., Xu, C.Y., Morshed, A., Wasimi, S.A., Moore, S., Rahman, S.M. (2021). Early weed detection using image processing and machine learning techniques in an Australian Chilli farm. Agriculture, 11(5): 387. https://doi.org/10.3390/agriculture11050387
[6] Ahmed, F., Al-Mamun, H.A., Bari, A.H., Hossain, E., Kwan, P. (2012). Classification of crops and weeds from digital images: A support vector machine approach. Crop Protection, 40: 98-104. https://doi.org/10.1016/j.cropro.2012.04.024
[7] Zheng, Y., Zhu, Q., Huang, M., Guo, Y., Qin, J. (2017). Maize and weed classification using color indices with support vector data description in outdoor fields. Computers and Electronics in Agriculture, 141: 215-222. http:// doi.org/10.1016/j.compag.2017.07.028
[8] Le, V.N.T., Apopei, B., Alameh, K. (2019). Effective plant discrimination based on the combination of local binary pattern operators and multiclass support vector machine methods. Information Processing in Agriculture, 6(1): 116-131. https://doi.org/10.1016/j.inpa.2018.08.002
[9] de Souza Belete, N.A., Tetila, E.C., Astolfi, G., Pistori, H. (2019). Classification of weed in soybean crops using unmanned aerial vehicle images. In Anais do XV Workshop de Visão Computacional, pp. 121-125. https://doi.org/10.5753/wvc.2019.7639
[10] Zhao, Z.Q., Zheng, P., Xu, S.T., Wu, X. (2018). Object detection with deep learning: A review. arXiv preprint arXiv:1807.05511. https://doi.org/10.48550/arXiv.1807.05511
[11] Veeranampalayam Sivakumar, A.N., Li, J., Scott, S., Psota, E., Jhala, A.J., Luck, J.D., Shi, Y. (2020). Comparison of object detection and patch-based classification deep learning models on mid-to late-season weed detection in UAV imagery. Remote Sensing, 12(13): 2136. https://doi.org/10.3390/rs12132136
[12] Osorio, K., Puerto, A., Pedraza, C., Jamaica, D., Rodríguez, L. (2020). A deep learning approach for weed detection in lettuce crops using multispectral images. AgriEngineering, 2(3): 471-488. https://doi.org/10.3390/agriengineering2030032
[13] Grace, R.K. (2021). Crop and weed classification using deep learning. Turkish Journal of Computer and Mathematics Education (TURCOMAT), 12(7): 935-938. https://doi.org/10.17762/turcomat.v12i7.2678
[14] dos Santos Ferreira, A., Freitas, D.M., da Silva, G.G., Pistori, H., Folhes, M.T. (2017). Weed detection in soybean crops using ConvNets. Computers and Electronics in Agriculture, 143: 314-324. https://doi.org/10.1016/j.compag.2017.10.027
[15] Razfar, N., True, J., Bassiouny, R., Venkatesh, V., Kashef, R. (2022). Weed detection in soybean crops using custom lightweight deep learning models. Journal of Agriculture and Food Research, 8: 100308. https://doi.org/10.1016/j.jafr.2022.100308
[16] Ying, B., Xu, Y., Zhang, S., Shi, Y., Liu, L. (2021). Weed detection in images of carrot fields based on improved YOLO v4. Traitement du Signal, 38(2): 341-348. https://doi.org//10.18280/ts.380211
[17] Redmon, J., Divvala, S., Girshick, R., Farhadi, A. (2016). You only look once: Unified, real-time object detection. 2016 IEEE Conference on Computer Vision and Pattern Recognition (CVPR), Las Vegas, NV, USA, pp. 779-788. https://doi.org/10.1109/CVPR.2016.91
[18] Liu, W., Anguelov, D., Erhan, D., Szegedy, C., Reed, S., Fu, C.Y., Berg, A.C. (2016). SSD: Single shot MultiBox detector. In: Leibe, B., Matas, J., Sebe, N., Welling, M. (eds) Computer Vision – ECCV 2016. ECCV 2016. Lecture Notes in Computer Science, vol 9905. Springer, Cham. https://doi.org/10.1007/978-3-319-46448-0_2
[19] Ahmad, T., Ma, Y., Yahya, M., Ahmad, B., Nazir, S., Haq, A.U. (2020). Object detection through modified YOLO neural network. Scientific Programming, 2020: 1-10. https://doi.org/10.1155/2020/8403262
[20] Bochkovskiy, A., Wang, C.Y., Liao, H.Y.M. (2020). Yolov4: Optimal speed and accuracy of object detection. arXiv preprint arXiv:2004.10934. https://doi.org/10.48550/arXiv.2004.10934
[21] Loey, M., Manogaran, G., Taha, M.H.N., Khalifa, N.E.M. (2021). Fighting against COVID-19: A novel deep learning model based on YOLO-v2 with ResNet-50 for medical face mask detection. Sustainable Cities and Society, 65: 102600. https://doi.org/10.1016/j.scs.2020.102600
[22] Li, J., Gu, J., Huang, Z., Wen, J. (2019). Application research of improved YOLO V3 algorithm in PCB electronic component detection. Applied Sciences, 9(18): 3750. https://doi.org/10.3390/app9183750
[23] Kannadaguli, P. (2020). YOLO v4 based human detection system using aerial thermal imaging for UAV based surveillance applications. In 2020 International Conference on Decision Aid Sciences and Application (DASA), Sakheer, Bahrain, pp. 1213-1219. https://doi.org/10.1109/DASA51403.2020.9317198
[24] Chen, J., Wang, H., Zhang, H., Luo, T., Wei, D., Long, T., Wang, Z. (2022). Weed detection in sesame fields using a YOLO model with an enhanced attention mechanism and feature fusion. Computers and Electronics in Agriculture, 202: 107412. https://doi.org/10.1016/j.compag.2022.107412
[25] Liu, B., Bruch, R. (2020). Weed detection for selective spraying: A review. Current Robotics Reports, 1: 19-26. https://doi.org/10.1007/s43154-020-00001-w