Yun Yang![]() | Chen Xiang*
| Chen Xiang*![]() | Hang Hu
| Hang Hu![]() | Tongxi Ye
| Tongxi Ye![]()
©2024 The authors. This article is published by IIETA and is licensed under the CC BY 4.0 license (http://creativecommons.org/licenses/by/4.0/).
OPEN ACCESS
With the acceleration of urbanization, urban parks and green spaces, as crucial components of urban ecosystems, play an indispensable role in enhancing the quality of life for residents and maintaining ecological balance. Traditional methods for assessing green cover are often inefficient and lack accuracy. Advances in high-resolution satellite imagery processing technologies offer new solutions. This study addresses the limitations of existing methods by proposing an integrated assessment approach that combines image processing and pattern recognition techniques. Image quality is enhanced through histogram equalization, effective image segmentation is achieved using the maximum interclass variance method, and the accuracy and reliability of green space measurement are improved with an enhanced monocular vision ranging algorithm. The proposed method significantly enhances the accuracy of urban park green cover assessments, providing practical value for urban planning and ecological monitoring.
urban parks, green cover rate, high-resolution satellite imagery, image enhancement, image segmentation, vision ranging
In the context of rapid urbanization today, urban parks, as an essential part of urban ecosystems, play a significant role in improving the quality of life of urban residents, maintaining ecological balance, and mitigating urban heat island effects [1-4]. However, as urban expansion accelerates, the effective management and monitoring of park green spaces become particularly important [5, 6]. Traditional methods of assessing green cover often rely on ground surveys, which are time-consuming, labor-intensive, and inefficient [7-9]. With the development of remote sensing technology, high-resolution satellite images provide a new perspective and technical means for assessing urban green cover, offering advantages of broad coverage and fast updating, thus becoming an important tool for studying urban ecological environments.
The accurate assessment of the green cover rate of urban parks is of great significance for urban planning, ecological protection, and sustainable development. Park green spaces are not only about the recreational life of urban residents but are also crucial for urban ecological safety [10, 11]. By accurately assessing the green cover of parks, scientific bases can be provided for urban greening management, data support for policymakers to formulate environmental protection policies, and it also helps the public understand the status of urban greening, raising public awareness of environmental protection [12-14].
Current research methods in the assessment of park green cover rates have some defects and shortcomings. For example, traditional image processing techniques are often limited by image quality and resolution, making it difficult to accurately distinguish between green spaces and non-green areas [15, 16]; and some automated image segmentation algorithms can easily produce misjudgments in complex urban environments [17-21]. Moreover, existing methods often cannot meet the needs of high-precision assessment, making it difficult to accurately quantify the area of urban park green spaces.
This paper aims to propose a new method for assessing the green cover rate of urban parks, to overcome the limitations of existing technologies. First, the study developed an urban park satellite image enhancement algorithm based on histogram equalization, effectively improving the image contrast, laying the foundation for subsequent processing; second, the enhanced satellite images are processed using the maximum interclass variance method for segmentation, to more accurately distinguish park green spaces from other features; finally, the area of green spaces is measured using an improved algorithm based on the principle of monocular vision ranging, improving the accuracy of area measurement. Overall, the method of this study enhances the accuracy and efficiency of assessing the green cover rate of urban parks, having high theoretical and practical value for urban green space management and planning.
In the study of urban park green cover rate assessment, the use of high-resolution satellite images is a key technical means. However, due to natural lighting, atmospheric scattering, and limitations inherent to satellite imaging itself, these images often lack in contrast and clarity, resulting in unclear boundaries between green and non-green areas, making it difficult to perform precise area calculations and feature analysis. To address this issue, this paper introduces histogram equalization and normalization processing techniques into the image enhancement process. Through this mathematical transformation, it is possible to adjust and expand the grayscale distribution of the image, dispersing pixel values that were overly concentrated in certain grayscale intervals to a wider range, thus increasing the global contrast of the image. For urban park satellite images, this means that the grayscale contrast between the green vegetation of green areas and the surrounding non-vegetative areas like buildings and roads will be enhanced, making the green areas more prominent and the detail features clearer.
The difference between enhancing urban park satellite images and general image enhancement lies in the need to meticulously process the green channel to highlight vegetation areas, while preserving information in other channels to maintain the overall authenticity of the scene, ensuring that the natural characteristics of the greenery are not distorted during the enhancement process. For high-resolution RGB color urban park satellite images, the basic principle of histogram equalization used to enhance image contrast involves applying histogram equalization separately to each color channel: red (R), green (G), and blue (B). Since color images contain rich color information, applying the gray image equalization method directly to the entire color image would disrupt the original color balance, thus it is necessary to equalize each color channel separately. This allows for independent adjustment of the brightness distribution of each channel, thereby increasing the local contrast of the image, optimizing the color saturation and brightness of the green areas, while maintaining the overall color tone natural and harmonious.
Specincally, the histogram of the satellite image $d(a b)$ replaces its grayscale distribution density function $o_s(d)$, and the following formula provides the expression for the listogram-equalized image $h$:
$h=S[d]=\int_0^x o_s(i) d i$ (1)
The above formula undergoes a discrete approximation transformation. If $d(a, b)$ has a pixel point $(a, b)$ with grayscale $e_j$, the following formula provides the expression for the result of histogram equalization $h(a, b)$ as the grayscale $t_j$ at point $(a, b)$:
$t_j=S\left[e_j\right]=\sum_{\mathrm{l}=0}^j \frac{v_1}{V}$ (2)
In the application scenario of assessing urban park green cover rates, when using high-resolution satellite images for segmentation, the Otsu maximum class variance method is an effective adaptive threshold determination technique, implemented through the following six steps.
First step: Calculate the normalized histogram of the grayscale image. The enhanced urban park satellite image is converted to grayscale to reduce computational load and to focus on brightness rather than color information. Assuming the total number of grayscale levels is $\mathrm{M}$, and the number of pixels at grayscale level $u$ is vu, with the total number of pixels being $\mathrm{V}$, then the probability of occurrence for each grayscale level is ou $=\mathrm{vu} / \mathrm{V}$, satisfying $\sum \mathrm{M}=\mathrm{mu}=0 \mathrm{ou}=1$, ou $>0$. In urban park satellite images, this probability distribution reflects the brightness distribution of green spaces and other features.
Second step: Calculate the overall grayscale mean $\omega$. This overall mean is the weighted result of all pixel grayscale values and their probabilities, and it will serve as a reference value for subsequent inter-class variance calculations. In urban park images, this mean is influenced by the brightness distributions of both green areas and non-green areas.
$\omega=\sum_{u=0}^{M-1} u o_u$ (3)
Third step: Divide the image grayscale levels into two parts, foreground $Z_0$ (green space) and background $Z_1$ (non-green space), using threshold $s$. The initial choice of threshold $\mathrm{s}$ is arbitrary and will be optimized in subsequent steps. The probabilities $O_0$ and $O_1$ of these two categories are the ratios of their respective pixel counts to the total pixel count, i.e., the cumulative sums of the normalized histograms of pixels in $O_0$ and $O_1$, and $O_0$ and $O_1$ can be obtained by the following formula:
$O_0(s)=\sum_{n=0}^s o_u, O_1(s)=\sum_{n=s+1}^{M-1} o_s=1-O_0(s)$ (4)
Fourth step: Calculate the means $\omega_0(s)$ and $\omega_1(s)$ and variances $\delta^2{ }_0(s)$ of $Z_0$ and $\delta^2{ }_1(s)$ of $Z_0$ and $Z_1$, respectively. These statistical parameters provide the basis for calculating interclass variance. In the segmentation of urban park satellite images, the brightness difference between green spaces and other features is usually significant, which should be reflected in the means and variances of the two categories. The calculation formulas are:
$\omega_0(s)=\frac{\sum_{n=0}^s u o_u}{O_0(s)}, \omega_1(s)=\frac{\sum_{n=s+1}^{M-1} u o_u}{O_1(s)}$ (5)
$\begin{aligned} & \delta_0^2(s)=\frac{\sum_{u=0}^s\left(u-\omega_0(s)\right)^2 o_u}{O_0(s)}, \\ & \delta_1^2(s)=\frac{\sum_{u=s+1}^{M-1}\left(u-\omega_1(s)\right)^2 o_u}{O_1(s)}\end{aligned}$ (6)
Fifth step: Calculate the inter-class variance $\delta^2{ }_Y(s)$, an important indicator of segmentation quality, based on the means and probabilities of $Z_0$ and $Z_1$. In urban park images, a good threshold should maximize the brightness difference between green spaces and non-green spaces, thus maximizing $\delta^2{ }_Y(s)$.
Sixth step: Iterate over all possible $s$ values (from 0 to $M-1$) to select the $s$ value that maximizes the inter-class variance $\delta^2{ }_Y(s)$ as the final threshold $S$. In the assessment of urban park green cover rates, this threshold can optimally distinguish between green areas and non-green areas, providing a basis for accurate calculation and assessment of green space. The expression for $S$ is:
$S=A R G \underset{0<s<M-1}{M A X} \delta_Y^2(s)$ (7)
In the color characteristics analysis of urban park satellite images, what we usually observe are clearly visible green cover areas, not images obscured by heavy smoke and low visibility. In urban park images, green areas, due to the reflective properties of vegetation, typically appear in varying intensities of green, forming a stark contrast with the surrounding artificial ground, water bodies, or bare soil. These green areas are usually continuous on satellite images and have high color saturation, while the boundaries of urban parks are clearer, facilitating the use of image processing technology to assess their green cover rate. Therefore, the goal of urban park green space analysis is to identify these green areas quickly and accurately through high-resolution satellite images and calculate their area ratio, to assess the ecological health and green space service functions of parks. This requires not only identifying green vegetation areas but also distinguishing shadows, buildings, roads, and other non-green elements to ensure accurate statistics of green space areas.
Specifically, under natural light conditions, healthy vegetation in the RGB color model typically exhibits high green (G) component values and low red (R) and blue (B) component values. This color characteristic can be used to distinguish vegetation from roads, buildings, or bare soil and other non-green elements. Therefore, the research content and objectives proposed in this paper are to develop an image segmentation method based on RGB color components and their statistical differences in characteristics, aimed at improving the accuracy of identifying urban park green areas. Assuming the values on the three-color components of a pixel are represented by R, G, B, and the variance of the three-color component values is represented by $\delta^2$, then the calculation formula is:
$\left\{\begin{aligned} \bar{a}(u, k)= & \frac{R(u, k)+G(u, k)+B(u, k)}{3} \\ & (R(u, k)-\bar{a}(u, k))^2 \\ & +(G(u, k)-\bar{a}(u, k))^2 \\ \delta^2(u, k)= & \frac{+(B(u, k)-\bar{a}(u, k))^2}{3}\end{aligned}\right.$
Based on the color characteristics of urban park satellite images, the algorithm steps proposed in this paper are as follows:
Step 1: First, the acquired high-resolution satellite images are resized to improve processing efficiency and reduce computational costs. Urban park images contain more detailed man-made structures and natural landscape details, so it is crucial to ensure that important spatial information is preserved during the compression process, while avoiding the loss of key green space features due to excessive compression. In this paper, the image size is reduced to a moderate resolution of 600×400 to maintain detail recognition in the images.
Step 2: The resized images are then enhanced to improve image quality and highlight the contrast between green and non-green areas. The enhancement of urban park images aims to increase the saturation and contrast of the vegetation and improve visibility in shadowed areas. This step employs histogram equalization techniques, resulting in an enhanced image $X_0$ that better represents the distribution of green spaces in urban parks.
Step 3: The enhanced image $X_0$ is converted to a grayscale image, and techniques like the Otsu maximum class variance method are used to determine an adaptive threshold $S$. This threshold is crucial for effectively segmenting green spaces from the surrounding environment. In urban park images, the grayscale differences between vegetation and other elements such as soil, water bodies, and sidewalks are key features. Careful adjustment of the threshold is necessary in this step to ensure accurate segmentation of green spaces.
Step 4: Continue processing the enhanced color image $X_0$, scanning each pixel row by row, detecting the similarity $\delta^2$ between RGB components of the pixel, and calculating its grayscale value $s$. If $s$ exceeds the threshold $S$ determined in step 3, and the similarity between the RGB components meets preset conditions, this may indicate that the pixel belongs to a non-vegetative area. The goal here is to exclude non-green pixels based on similarity. Green space pixels are then set to 1 , and non-green space pixels are set to 0 , resulting in a binarized image $X u$ that highlights the green areas of urban parks.
Step 5: The binarized image $X u$ undergoes morphological processing to optimize the representation of green spaces. Due to potential errors caused by building shadows or small nongreen areas in urban environments, morphological opening operations are used to smooth the boundaries of green areas, and closing operations are used to fill small holes within the green spaces. This further refines the morphological characteristics of green spaces and removes small non-green objects, resulting in a more accurate and clearer binary image of urban park green spaces, providing high-quality input data for the final assessment of green cover rates.
In the segmentation algorithm process of urban park satellite images, the conversion of 24-bit true color images to grayscale images is a critical step. The greyscale conversion of urban park images needs to consider the performance of green space features in the RGB color channels. When implementing greyscale conversion, it is not a simple average of the $\mathrm{R}, \mathrm{G}$, and $\mathrm{B}$ channel values, but rather, given the higher reflectance of green vegetation in the green channel, a higher weight is assigned to the $\mathrm{G}$ component. The conversion often uses a weighted average method to better highlight green areas and reduce interference from non-green elements like urban buildings. Assuming the grayscale value at point $(u, k)$ of the converted grayscale image is represented by $G R(u, k)$, the specific calculation formula is:
$\begin{aligned} & G R(u, k)=0.3 R(u, k)+0.59 G(u, k)+0.12 B(u, k)\end{aligned}$ (9)
Then, the maximum inter-class variance method is used to determine the threshold for binarizing the image. Urban park satellite images feature more complex color and texture characteristics. In practice, the selection of the threshold must consider not only the grayscale differences between green and non-green areas but also various interference factors in the urban environment, such as shadows, bodies of water, and artificial surfaces. An adaptive threshold $S=110$ is automatically calculated by the algorithm, based on the statistical characteristics of the current image data, and this value effectively distinguishes green areas from other features. Based on this, by examining the variance of the $R, G$, and $B$ components of each pixel, it helps identify green vegetation, as vegetation typically shows lower variance across the RGB channels. Then, based on the variance threshold, a binarization operation is performed on each pixel. Assuming the grayscale values of the image before and after processing at $(u, k)$ are represented by $d(u, k)$ and $h(u, k)$, respectively, the binarized image can be calculated using the following formula:
$h(u, k)= \begin{cases}1, I F & d(u, k) \in s(u, k)> \\ & S \cap \delta^2(u, k)<40 \\ 0, E L S E\end{cases}$ (10)
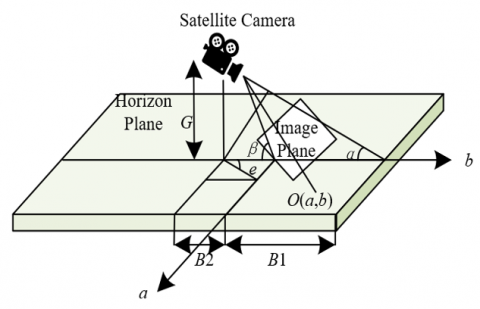
This paper is based on the monocular vision ranging principle for measuring green space area in urban park satellite images. This method needs to adapt to the characteristics of high-resolution satellite images, which typically have a wider field of view and a more stable imaging platform compared to aerial images, but may be affected by changes in satellite orbit and attitude. In this context, traditional corresponding point calibration methods might also face challenges in terms of accuracy and practicality in obtaining depth information from satellite images. Therefore, this paper proposes an improved algorithm that does not rely on traditional corresponding point calibration methods, but rather, by analyzing the imaging model and motion parameters of the satellite to establish a stable transformation relationship between the world coordinate system and the image coordinate system. This transformation relationship can adaptively calculate the geometric transformation of each image based on metadata such as satellite orbit data and imaging time, thus accurately estimating the area of green space. During this process, the algorithm automatically corrects for image distortions caused by satellite movement, ensuring that satellite images taken at different times and from different angles can be used for precise measurement of green space area, significantly enhancing the level of automation and flexibility of the measurement. The principle of monocular vision ranging is shown in Figure 1. Assuming the focal length is represented by $d$, the image distance by $l$, and the object distance by $v$, then the lens imaging model expression is:
$\frac{1}{d}=\frac{1}{l}+\frac{1}{v}$ (11)
Compared to aerial images, satellite images are less affected by local weather conditions and the flight status of the aircraft, providing more consistent and standardized image data, which is crucial for extensive and multi-temporal measurements of urban park green space areas. However, the imaging conditions of satellite images, such as the satellite's orbital inclination and the sensor's pointing angle, can also affect the geometric representation of objects in the images, thus requiring an accurate geometric model to compensate for these changes and ensure measurement accuracy. To this end, this paper draws on the principles of optical imaging, combined with the characteristics of satellite imaging, to propose a monocular vision ranging method based on the optical imaging geometric model, adapted to the characteristics of high-resolution satellite images, and to improve the accuracy of measuring the area of urban park green spaces.
Figure 1. Monocular vision ranging principle based on pinhole model
The proposed method transforms pixel coordinates in satellite images into actual ground positions in the world coordinate system. This method assumes that the imaging model of the satellite camera approximates a pinhole model, capturing distant objects through an imaginary "pinhole," which simplifies the imaging process and eliminates the complexity of lens distortion. In this model, there is a specific geometric relationship between a point $O(a, b)$ on the ground and its projection point $o(\omega, n)$ on the satellite image imaging plane. Using known satellite orbit parameters, camera positioning, and attitude data, a transformation relationship from image coordinates to ground world coordinates can be established, considering factors such as the satellite's shooting pitch angle, altitude, and viewing angle. Using this information, we can derive a mathematical model to map image coordinates back to ground coordinates, thus measuring the green space area of urban parks. This process considers various imaging condition changes to ensure that satellite images obtained at different times can be used for highprecision area measurement. Specifically, assuming the urban park green space area is represented by $O$, and the corresponding point in thel image plane by $o$, the vertical distance from the camera to the ground is represented by $G$, the nearest distance of the camera's vertical viewing angle projection on the ground is represented by $b 1$, and the farthest distance by $b 1+b 2$, the horizontal distance of the camera's vertical viewing angle projection on the ground at its nearest point is represented by $a 1$. The maximum and minimum angles between the camera's vertical viewing angle rays and the ground plane axis are represented by $\beta$ and $\alpha$, and the angle between the camera's horizontal viewing angle projection on the ground and the horizontal axis $\mathrm{b}$ is represented by $\varepsilon$. The calculation formulas are:
$\beta=\arctan (G / b 1)$ (12)
$\alpha=\arctan (G /(b 1+b 2))$ (13)
$\varepsilon=\arctan (a 1 / b 1)$ (14)
After deriving the angles $\beta, \alpha$, and $\varepsilon$, assuming the width and height of $O$ on the image plane are represented by $\omega, N$, and the pixel width and pixel height in the $A$ and $B$ directions are represented by $T_a$ and $T_b$. The vertical coordinate of point $O(a, b)$ in the camera coordinate system $a p b$, i.e., the distance between the target point and the camera in the vertical direction, is represented by $b$. The horizontal coordinate of point $O(a, b)$ in the camera coordinate system $a p b$, i.e., the distance between the target point and the camera in the horizontal direction, is represented by $a$, and the angle between point $O$ and axis $b$ is represented by $\phi$, the distance between the target point and the camera is represented by $M$, the calculation formulas for $a$ and $b$ are as follows:
$b=G \tan \left[(90-\beta)+\left(\frac{T_b-\omega}{T_b}\right)(\beta-\alpha)\right]$ (15)
$a=b \tan \left[\left(\frac{T_a-\omega}{T_a}\right) \mathcal{\varepsilon}\right]$ (16)
$\varphi=\left(\frac{T_a-\omega}{T_a}\right) \varepsilon$ (17)
$M=\sqrt{a^2+b^2}$ (18)
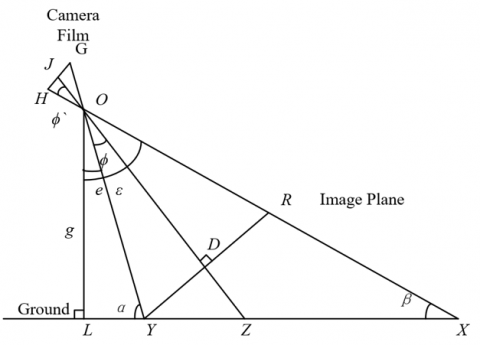
Figure 2. Improved principle for calculating urban park satellite image green space area
Based on the aforementioned monocular ranging principle, this paper improves the algorithm for measuring green space area in urban park satellite images, with the calculation principle shown in Figure 2, and the improved algorithm process as follows. Based on the perspective geometric relationships, there are:
$\tan \varphi=\tan \varphi^{\prime}=\frac{K G}{P K}=\frac{s}{d}$ (19)
$\varepsilon=\psi-\varphi$ (20)
$P Y=\frac{g}{\cos \varepsilon}$ (21)
$m=P Y \times \sin \varphi$ (22)
Assuming half the height of the negative is represented by $s=K G$, the focal length by $d=P K$, the height of the satellite camera from the ground by $g=P L$, and the shooting angle of the satellite camera by $\psi$, the half actual height of the plane by $m=D Y$, and the actual height of the corresponding plane by $X Y$, the above formulas can be linked as follows:
$X Y=X I-Y L=2 g \frac{s}{d} \frac{1+\tan ^2 \psi}{1-\frac{s^2}{d^2} \tan ^2 \psi}$ (23)
From the above formula, if $s, d, g$, and $\psi$ are known, then the actual height of the plane corresponding to the image can be determined. Assuming the total number of pixels in the width and height resolution of the image is represented by $T_a$ and $T_b$, the following formula provides the calculation formula for each pixel point pixel corresponding to the actual area:
$T_s=\frac{T_a}{T_n}\left(\frac{X Y}{T_a}\right)^2$ (24)
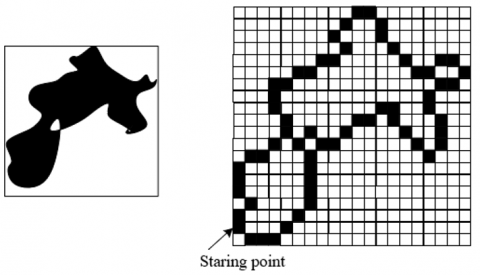
Figure 3 shows the target map of the green space area in the urban park satellite image. Since the number of pixel points $V$ in the green area of the urban park satellite image is known during the segmentation stage, the actual area corresponding to the extracted green space area $T_s$ in the image can be calculated through the following formula:
$T_s=\sum_{n=1}^n T_s$ (25)
Figure 3. Target map of green space area in urban park satellite image
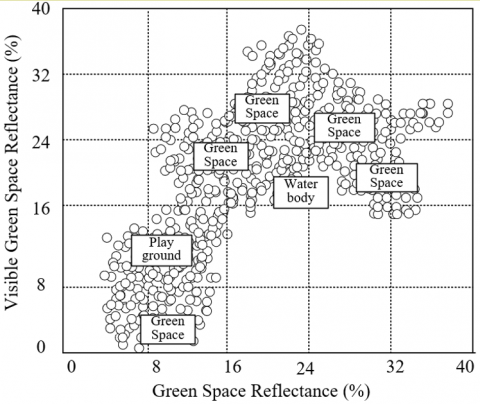
The experimental results in Figure 4 demonstrate that the urban park satellite image enhancement algorithm based on histogram equalization proposed in this paper successfully enhanced the image contrast, making the park green areas and the surrounding environment more distinctly separated. After processing the cloud images for feature extraction, a sample two-dimensional reflectance space projection was obtained, providing important data support for further analysis.
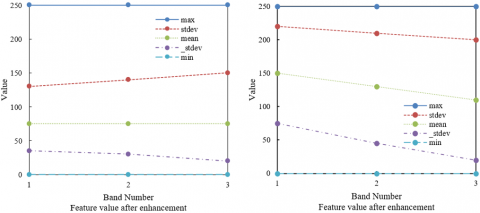
The data presented in Figure 5 clearly indicate that after applying the histogram equalization-based image enhancement algorithm, both the mean and standard deviation of the urban park satellite images have increased. Specifically, the increase in the image mean reflects an overall brightness enhancement, while the increase in standard deviation indicates that the distribution of pixel values has become more widespread, thereby increasing the contrast between pixels. This enhanced contrast makes the details within the image more apparent, particularly the boundaries between green and non-green areas, thus aiding in more precise image classification and feature extraction. From the analysis, the histogram equalization-based image enhancement method proposed in this paper effectively optimized the quality and information content of urban park satellite images.
Analyzing the data from Table 1 and Table 2, it can be observed how pixels of different categories are allocated. For the categories "Urban Green Space 1" and "Urban Green Space 2," the classification effect is particularly notable, with nearly all pixels being correctly classified into their respective categories. For example, in the "Urban Green Space 2" category, 4256 pixels were correctly classified, accounting for 100% of its total. This high degree of accuracy demonstrates the effectiveness of image enhancement and segmentation techniques in distinguishing between green and non-green areas. Additionally, the classification accuracy for agricultural land and unused land is also relatively high, with agricultural land achieving a classification accuracy of 92.36%. However, the classification of "High Mountain Shrubland" was relatively lower, possibly due to the similarity of its surface characteristics with other categories, making classification challenging.
Figure 4. Two-dimensional reflectance space projection of an enhanced urban park satellite image sample
Figure 5. Comparison of feature values before and after enhancement of urban park satellite images
Table 1. True surface (pixels) in satellite images
|
Class |
Urban Green Space 1 |
Urban Green Space 2 |
Pasture |
Farmland |
Mountain Shrubland |
Untilled Land |
Total |
|
Unclassified |
202 |
0 |
1012 |
115 |
12 |
24 |
1365 |
|
Urban Green Space 1 |
2345 |
0 |
0 |
0 |
124 |
0 |
2469 |
|
Urban Green Space 2 |
1 |
4256 |
0 |
0 |
0 |
0 |
4257 |
|
Pasture |
0 |
0 |
1235 |
14 |
0 |
27 |
1276 |
|
Farmland |
0 |
0 |
42 |
2895 |
12 |
0 |
2949 |
|
Mountain Shrubland |
252 |
0 |
1 |
82 |
832 |
0 |
1167 |
|
Untilled Land |
0 |
0 |
52 |
2 |
8 |
2154 |
2216 |
|
Total |
2789 |
4256 |
3456 |
3124 |
1009 |
2236 |
16870 |
Table 2. True surface in satellite images (percentage)
|
Class |
Urban Green Space 1 |
Urban Green Space 2 |
Pasture |
Farmland |
Mountain Shrubland |
Untilled Land |
Total |
|
Unclassified |
6.89 |
0.00 |
28.98 |
3.68 |
1.08 |
1.08 |
8.02 |
|
Urban Green Space 1 |
83.25 |
0.00 |
0.00 |
0.00 |
12.32 |
0.00 |
14.26 |
|
Urban Green Space 2 |
0.03 |
100.00 |
0.00 |
0.00 |
0.00 |
0.00 |
25.36 |
|
Pasture |
0.00 |
0.00 |
66.32 |
0.48 |
0.00 |
1.21 |
12.34 |
|
Farmland |
0.00 |
0.00 |
1.21 |
92.36 |
1.23 |
0.00 |
18.62 |
|
Mountain Shrubland |
8.87 |
0.00 |
0.03 |
2.68 |
82.31 |
0.00 |
6.69 |
|
Untilled Land |
0.00 |
0.00 |
1.53 |
0.00 |
0.78 |
97.25 |
12.35 |
|
Total |
100.00 |
100.00 |
100.00 |
100.00 |
100.00 |
100.00 |
100.00 |
Table 3. Commission & omission error, producer & user accuracy
|
Class |
Commission (Percent) |
Commission (Pixels) |
Omission (Percent) |
Omission (Pixels) |
Prod.Acc (Percent) |
User.Acc. (Pixels) |
|
Urban Green Space 1 |
5.23 |
123/2562 |
14.23 |
457/2689 |
83.25 |
93.26 |
|
Urban Green Space 2 |
0.02 |
1/4235 |
0.00 |
0/4236 |
100.00 |
98.54 |
|
Pasture |
1.78 |
42/2356 |
32.25 |
1124/3456 |
66.32 |
97.26 |
|
Farmland |
1.82 |
53/2895 |
689 |
215/3016 |
92.35 |
97.65 |
|
Mountain Shrubland |
27.89 |
326/1245 |
15.26 |
168/1026 |
82.34 |
72.14 |
|
Untilled Land |
2.68 |
62/2356 |
2.23 |
52/2425 |
98.36 |
97.32 |
Table 4. Urban park satellite image green space area detection results
|
Image Number |
Focal Length (mm) |
Shooting Height (m) |
Shooting Pitch Angle (°) |
Measured Result (hm2) |
Traditional Method Result (hm2) |
Error (hm2) |
Relative Error (%) |
|
1 |
28 |
350 |
46 |
3.89 |
4.80 |
0.85 |
18.21 |
|
2 |
23 |
300 |
23 |
5.32 |
4.80 |
0.46 |
9.78 |
|
3 |
23 |
300 |
32 |
4.59 |
4.80 |
0.13 |
2.78 |
|
4 |
23 |
300 |
28 |
4.65 |
4.80 |
0.19 |
3.56 |
|
5 |
61 |
1110 |
42 |
16.32 |
16.20 |
1.65 |
10.23 |
|
6 |
55 |
1030 |
47 |
19.85 |
16.20 |
3.21 |
18.96 |
|
7 |
71 |
1190 |
45 |
14.23 |
16.20 |
2.34 |
12.65 |
|
8 |
71 |
910 |
56 |
5.15 |
4.2 |
1.01 |
25.41 |
|
9 |
71 |
1250 |
35 |
0.46 |
0.4 |
0.05 |
12.36 |
|
10 |
71 |
420 |
38 |
1.12 |
1.1 |
0.12 |
10.26 |
Table 3 provides further details on classification accuracy, where "Urban Green Space 1" and "Urban Green Space 2" exhibit extremely high producer's and user's accuracy, at 83.25% and 93.26%, and 100% and 98.54%, respectively. This indicates that the classification method not only correctly categorizes most pixels belonging to these categories but also rarely misclassifies pixels from other categories into these categories. In contrast, the user's accuracy for "High Mountain Shrubland" is lower (72.14%), indicating that many pixels not belonging to this category were wrongly classified into it. This may be due to the complexity of the terrain features and similarity between classes.
From the analysis above, it can be concluded that the urban park satellite image enhancement and segmentation methods proposed in this paper are generally effective in improving classification accuracy, particularly for the identification of urban green spaces. By enhancing image contrast and clarity through histogram equalization and achieving precise segmentation with the maximum inter-class variance method, the ability to distinguish park green spaces from other land features is significantly enhanced. Although the classification results for some categories with high similarity in surface features, such as "High Mountain Shrubland," still need improvement, overall, the method significantly enhances the accuracy and reliability of urban park green cover assessment, providing strong technical support for subsequent urban environmental management and planning.
From Table 4, it is evident that the green space measurement algorithm based on the principle of monocular vision ranging proposed in this paper shows good performance in detecting green space areas in urban park satellite images. By comparing with traditional methods, it can be observed that the new algorithm results in smaller errors and relative errors. For example, in the case of image number 2, the relative error is only 9.78%, indicating that the new algorithm can achieve fairly accurate results in measuring green space areas. Although there are larger errors in some cases, such as image numbers 5, 6, and 7, where the relative errors are 10.23%, 18.96%, and 12.65% respectively, overall the new algorithm has high measurement accuracy and lower error levels compared to traditional methods. From the analysis above, it can be concluded that the improved algorithm for measuring urban park green space area based on the principle of monocular vision ranging presented in this paper has certain effectiveness and feasibility in practical applications. Despite some errors in certain cases, the overall relative errors remain within a reasonable range, indicating that the new algorithm can more precisely measure the area of urban park green spaces, providing more reliable data support for the assessment of urban park green cover rates.
Table 5. Correlation analysis of urban park satellite image green space measurement data
|
|
|
Focal Length |
Shooting Height |
Shooting Pitch Angle |
Relative Error |
|
Focal Length |
Pearson correlation significance (two-sided) N |
1
10 |
807** 005 10 |
823* 048 10 |
514 128 10 |
|
Shooting Height |
Pearson correlation significance (two-sided) N |
807** 005 10 |
1
10 |
547 097 10 |
458 189 10 |
|
Shooting Pitch Angle |
Pearson correlation significance (two-sided) N |
823* 048 10 |
545 097 10 |
1
10 |
868** 001 10 |
|
Relative Error |
Pearson correlation significance (two-sided) N |
514 128 10 |
465 189 10 |
859** 001 10 |
1
10 |
**Significantly correlated at the 0.01 level (two-sided); *Significantly correlated at the 0.05 level (two-sided)
Table 5 shows the results of the correlation analysis for the measurement data of green space areas in urban park satellite images. From the data, it is evident that there are certain correlations between focal length, shooting height, shooting pitch angle, and relative error. Specifically, focal length shows significant correlation with relative error, being highly significant at the 0.01 level; shooting height also shows significant correlation with relative error, significant at the 0.05 level; the correlation between shooting pitch angle and relative error is the most significant, being highly significant at the 0.01 level. These correlation results indicate that factors affecting the accuracy of green space area measurements in urban park satellite images include not only the parameters of the image itself but also the shooting conditions and angles. The correlation analysis results suggest that there is a definite association between image parameters and shooting conditions with relative error, providing important references for further optimization and adjustment of the measurement algorithm. Thus, the method proposed in this article not only enhances the accuracy of green space area measurements but also allows for parameter adjustments based on different shooting situations, further improving the accuracy and reliability of the measurements.
This paper proposes a new method for assessing the green cover rate of urban parks, aimed at overcoming the limitations of existing technologies, and has validated the method's effectiveness through a series of original experiments. The study initially developed an urban park satellite image enhancement algorithm based on histogram equalization, which successfully increased the image contrast and enhanced image quality, facilitating subsequent image processing tasks. Following this, the enhanced images were precisely segmented using the maximum class variance method, effectively distinguishing park green spaces from other land features. Additionally, the study incorporated an improved algorithm based on the principle of monocular vision ranging to enhance the accuracy of green space area measurement.
Experimental results support the effectiveness of the proposed method in multiple dimensions: the analysis of the two-dimensional reflectance space projection of samples demonstrated that the image enhancement algorithm could improve data usability; comparisons of feature values before and after enhancement showed significant improvements in image processing; analysis of true surface pixels in satellite images, along with Commission & Omission error, Producer & User Accuracy analyses, further verified the accuracy of the segmentation and classification methods; lastly, the results of urban park satellite image green space area detection and correlation analysis demonstrated the high reliability and precision of the measurement method.
Despite the achievements of this research, there are still some limitations. For example, the classification accuracy for high mountain shrubland was lower, which might require further optimization of the image processing or classification algorithms to improve the recognition rate for this type of terrain. Future research could explore integrating more remote sensing data sources and advanced machine learning technologies to enhance the overall performance and applicability of the system, particularly in environments with complex terrain and diverse vegetation cover. Additionally, further studies should consider finer-grained green space classification and assessment to provide more specific and practical information for urban planning and environmental management. With continued technological innovation and methodological improvements, future efforts are expected to have a broader impact in the field of urban park and green space management.
[1] Bai, X., Sadia, S. (2023). Park city leads the way of urban development and innovation in China. Journal of Environmental Engineering and Landscape Management, 31(4): 240-247. https://doi.org/10.3846/jeelm.2023.20047
[2] Lushpaeva, M.I., Balabanova, Y.P., Sayfutdinova, A.M., Gaiduk, A.R. (2022). The formation concept of the rehabilitation park territory in the city of Kazan. In International Scientific Conference Industrial and Civil Construction, pp. 376-383. https://doi.org/10.1007/978-3-031-44432-6_45
[3] Kushwaha, P., Mathur, A., Hussain, S., Chauhan, A.S. (2022). Design and enhancement of city park transport infrastructure facilities. Materials Today: Proceedings, 62: 1475-1480. https://doi.org/10.1016/j.matpr.2022.02.026
[4] Li, X., Shang, W.L., Liu, Q., Liu, X., Lyu, Z., Ochieng, W. (2024). Towards a sustainable city: Deciphering the determinants of restorative park and spatial patterns. Sustainable Cities and Society, 104: 105292. https://doi.org/10.1016/j.scs.2024.105292
[5] Schrammeijer, E.A., van Zanten, B.T., Verburg, P.H. (2021). Whose park? Crowdsourcing citizen's urban green space preferences to inform needs-based management decisions. Sustainable Cities and Society, 74: 103249. https://doi.org/10.1016/j.scs.2021.103249
[6] Wang, X., Meng, Q., Liu, X., Allam, M., Zhang, L., Hu, X., Jancsó, T. (2022). Evaluation of fairness of urban park green space based on an improved supply model of green space: a case study of Beijing central city. Remote Sensing, 15(1): 244. https://doi.org/10.3390/rs15010244
[7] Lee, H., Lim, H., Park, S. (2023). Quantitative assessment of green coverage changes under the human-biometeorological perspective: A simulation case study in Jeju, Republic of Korea. Sustainable Cities and Society, 97: 104734. https://doi.org/10.1016/j.scs.2023.104734
[8] Han, M., Lin, H., Sun, D., Wang, J., Yuan, J. (2022). The eco-friendly side of analyst coverage: the case of green innovation. IEEE Transactions on Engineering Management, 71: 1007-1022. https://doi.org/10.1109/TEM.2022.3148136
[9] Roostaie, S., Kouhirostami, M., Sam, M., Kibert, C.J. (2021). Resilience coverage of global sustainability assessment frameworks: A systematic review. Journal of Green Building, 16(2): 23-53. https://doi.org/10.3992/jgb.16.2.23
[10] Al-Qawasmi, J. (2019). Examining indicators coverage in a sample of sustainable building assessment systems. Architectural Engineering and Design Management, 15(2): 101-120. https://doi.org/10.1080/17452007.2018.1532873
[11] Yuan, C., Xiao, J., Zhang, X., Zhou, J., Wang, Z. (2022). A new assessment of the algal biomass of green tide in the Yellow Sea. Marine Pollution Bulletin, 174: 113253. https://doi.org/10.1016/j.marpolbul.2021.113253
[12] Tam, V.W., Karimipour, H., Le, K.N., Wang, J. (2018). Green neighbourhood: Review on the international assessment systems. Renewable and Sustainable Energy Reviews, 82: 689-699. https://doi.org/10.1016/j.rser.2017.09.083
[13] Cui, Y., Guo, B., Li, W., Kong, X. (2023). Assessment of urban blue-green space cooling effect linking maximum and accumulative perspectives in the Yangtze River Delta, China. Environmental Science and Pollution Research, 30(58): 121834-121850. https://doi.org/10.1007/s11356-023-30892-z
[14] Bai, G., Li, T., Xu, P. (2023). Can analyst coverage enhance corporate innovation legitimacy?——Heterogeneity analysis based on different situational mechanisms. Journal of Cleaner Production, 405: 137048. https://doi.org/10.1016/j.jclepro.2023.137048
[15] Wang, W., Wan, S., Xiao, P., Zhang, X. (2022). A novel multi-training method for time-series urban green cover recognition from multitemporal remote sensing images. IEEE Journal of Selected Topics in Applied Earth Observations and Remote Sensing, 15: 9531-9544. https://doi.org/10.1109/JSTARS.2022.3218919
[16] Fan, D., Yu, S., Jin, F., Han, X., Zhang, G. (2023). Remote sensing urban green space layout and site selection based on lightweight expansion convolutional method. IEEE Access, 11: 99889-99900. https://doi.org/10.1109/ACCESS.2023.3314819
[17] Gui, B., Bhardwaj, A., Sam, L. (2024). Evaluating the efficacy of segment anything model for delineating agriculture and urban green spaces in multiresolution aerial and spaceborne remote sensing images. Remote Sensing, 16(2): 414. https://doi.org/10.3390/rs16020414
[18] Dong, C. (2022). Environment optimization design of green building landscape space based on genetic algorithm. In International Conference on Sustainable Technology and Management (ICSTM 2022), 12299: 283-291. https://doi.org/10.1117/12.2646629
[19] Ghosh, P., Singh, K.K. (2022). Spatiotemporal dynamics of urban green and blue spaces using geospatial techniques in Chandannagar city, India. GeoJournal, 87(6): 4671-4688. https://doi.org/10.1007/s10708-021-10524-0
[20] Zhao, H.H., Guan, H.Y. (2018). Multi-feature-marks based information extraction of urban green space along road. International Archives of the Photogrammetry, Remote Sensing and Spatial Information Sciences-ISPRS Archives, 42(3): 2353-2357. https://doi.org/10.5194/isprs-archives-XLII-3-2353-2018
[21] Masoudi, M., Tan, P.Y. (2019). Multi-year comparison of the effects of spatial pattern of urban green spaces on urban land surface temperature. Landscape and Urban Planning, 184: 44-58. https://doi.org/10.1016/j.landurbplan.2018.10.023