Tangavelou Karthikeyan*![]() | Muthukumarasamy Govindarajan
| Muthukumarasamy Govindarajan![]() | Veeramani Vijayakumar
| Veeramani Vijayakumar![]()
© 2024 The authors. This article is published by IIETA and is licensed under the CC BY 4.0 license (http://creativecommons.org/licenses/by/4.0/).
OPEN ACCESS
The proliferation of online shopping has led to a substantial increase in payment card transactions, accompanied by a parallel rise in fraudulent activities. Such frauds impose significant financial burdens on both businesses and banking institutions annually. In response to this growing concern, a novel hybrid methodology has been developed, integrating a metaheuristic optimization algorithm with a neural network classifier, aimed at the automatic detection of financial transaction fraud. This method, termed Chimp-Optimized Long Short-Term Memory Networks (ChOpt+LSTM), operates in two sequential phases. Initially, an optimization algorithm based on chimp behavior is utilized for the selection of the most pertinent features for fraud detection. Subsequently, these features inform the training of a Long Short-Term Memory (LSTM) classifier model, specifically designed for the identification of credit card fraud. An extensive comparative analysis reveals that the proposed ChOpt+LSTM method surpasses existing techniques in several key performance metrics. Notably, it achieves a classification accuracy of 99.18%, a mean absolute error (MAE) reduction to 25.7, a mean squared error (MSE) reduction to 16.3, alongside precision, recall, and F1 scores of 98.54%, 98.47%, and 96.58%, respectively. These findings underscore the efficacy of combining chimp optimization algorithms with LSTM classifiers in enhancing the accuracy and reliability of financial fraud detection systems.
financial fraud detection, credit card fraud, neural networks, metaheuristic optimization, chimp optimization, long short-term memory (LSTM), feature selection (FS), performance evaluation
In recent years, there has been a meteoric rise in the number of websites, web services, and internet users. These days, everyone uses a credit card or debit card, whether making purchases online, transferring funds between accounts, or paying bills [1]. Our lives are made easier by this technology because of its numerous advantages, such as shopping without carrying cash and skipping lines to pay bills or buy tickets, among others [2, 3]. Internet transactions provide benefits, but bank fraud and unauthorized payments are risks [4]. Due to their complexity and sophistication, identifying fraudulent financial operations is difficult. Financial fraud is rapidly rising along with advances in modern technology. Many types of fraud [5], including bogus accounts, scams, phishing, forged papers, fraudulent loans, credit card fraud, and internet banking scams] threaten the integrity of the financial system. Many millions of dollars are lost annually due to fraud crimes committed against financial institutions. Customers' trust in the business and its financial health are both significantly impacted [6]. Numerous financial crimes cause substantial losses for businesses and global financial institutions [7]. Governments, consumers, and the banking sector all across the globe are worried about fraudulent activity using credit and debit cards [8].
Unusual activity and unauthorized access may be spotted by the procedures used to identify financial crime. Financial institutions often upgrade their fraud detection systems. Tools in the domains of data mining and machine learning that have recently gained popularity [9] deal with these concerns. Numerous academic articles have proposed optimal strategies by using these methods and technologies. These methods may still be used to better integrate large data, memory costs, and computing costs to meet the requirements of the developing financial industry [10].
In this study, we provide a unique hybrid technique for identifying financial payment fraud that combines a metaheuristic optimization algorithm with a neural network classifier. This unique technique, termed "ChOpt+LSTM" (chimp-optimized LSTM), has two sequential layers meant to improve the accuracy and efficiency of fraud detection. Existing models and algorithms have difficulties when trying to train on highly skewed datasets for financial fraud because of things like the dynamic nature of fraudulent activity, the lack of a system to monitor fraud transaction information, and the constraints of machine learning. The objectives of the research are:
·Utilizing chimp optimization-based FS, which helps to select the features of the user with suspicious, fraudulent, and fraudulent outcomes.
·Construction of a long-short-term memory neural network for classifying genuine and fraudulent users with more accuracy.
The structure of this paper is as follows: In Section 2, a related work for fraud detection using neural networks is given. The proposed feature extractor, feature selector, and classifier are elaborated in Section 3. The performance of the proposed model is presented along with a comparison in Section 4. The overall conclusion for the developed model is presented in Section 5.
Table 1. Comparative analysis of the existing works
|
Method |
Advantages |
Limitations |
|
Autoencoder-based classification [11] |
- Effective variable extraction through autoencoder. - Reliability evaluated for various machine learning approaches. |
- Limited information on specific autoencoder architecture used. |
|
Neural network autoencoder [12] |
- Efficient detection of fraudulent purchases using autoencoder. |
- Lack of details on the neural network architecture. |
|
Hybrid data resampling with NN ensemble [13] |
- Reliability in fraud detection combining data resampling and neural network ensemble. |
- Limited information on the specific data resampling technique used. - Ensemble model details not provided. |
|
CGNN [14] |
- Significantly outperformed prior baselines in detecting fraudulent activities. - Utilizes graph neural networks. |
- Specifics of CGNN architecture not mentioned. |
|
LSTM network for credit card fraud [15] |
- Incorporates sequences of transactions using LSTM for fraud detection. - Records historical purchasing behaviour for accurate detection. |
- Lack of details on LSTM architecture. |
|
Artificial Neural Network with Harmony Search [16] |
- Efficient fraud detection strategy based on Harmony Search Algorithm. - Mines data for underlying trends in both genuine and fraudulent customer behaviour. |
- Details on the Harmony Search - Algorithm integration is limited. |
|
FraudMemory with memory networks [17] |
- Utilizes cutting-edge feature representation techniques for user and log representation. - Uses a unique sequential model coupled with memory networks for recording sequential patterns. |
- Limited information on the feature representation techniques. - Lack of specifics on the sequential model and memory networks |
Many supervised and unsupervised learning methods are employed for transaction-based fraud detection. Some of the most important are as follows:
Sudarshana et al. [11] offer an autoencoder-based classification technique for extracting variables from European credit card data. The reliability of several machine learning approaches for categorization was also evaluated using encoded features. The use of a neural network autoencoder is presented as a method for detecting fraudulent purchases made with a credit card [12]. Generally, spotting credit card fraud is seen as a problem of categorization. Esenogho et al. [13] suggests a reliable credit card fraud detection method by combining a hybrid data resampling approach with a neural network ensemble classifier.
One of the largest online marketplaces is targeted by Zhang et al. [14], which offers a fraud detection system (eFraudCom) based on competitive graph neural networks (CGNN). Trials conducted on two Taobao datasets and two public datasets demonstrated that the suggested architecture, CGNN, significantly outperformed prior baselines in detecting fraudulent activities. Incorporating sequences of transactions into a credit card fraudulent recognition system requires the use of a sequence learner, such as a Long Short-Term Memory (LSTM) network, as described in Benchaji et al. [15]. With the intention of increasing the accuracy of fraud detection on new incoming transactions, the suggested approach tries to record the historical purchasing behavior of credit card holders. To detect fraudulent activity, Daliri [16] uses an artificial neural network strategy based on the Harmony Search Algorithm. The proposed approach mines the data of both genuine and fraudulent customers for underlying trends. Since fraudulent behavior may be detected and prevented before it ever happens, the results show that the proposed system has sufficient competence in fraud detection. Various Comparative analysis of the existing works were mentioned in Table 1.
A unique fraud detection system named FraudMemory is proposed by Yang and Xu [17]. To better represent users and logs of various types in financial systems, it employs cutting-edge feature representation techniques.
In summary, the literature survey highlights diverse approaches to credit card fraud detection, with varying success. However, there are gaps in method transparency, adaptability to online fraud, and consistent reporting. This research aims to fill these gaps by proposing a transparent and adaptable fraud detection system, addressing limitations identified in existing studies. As a result, it is suggested that optimization-based FS be used to identify fraudulent online purchases.
The problem formulation used in this research is described in this section. FS is a method for selecting the most useful features from a large dataset to use in training a classification model. It highlights only those factors that are significant during the decision-making process, thereby creating a subset of features that are both significant and non-redundant. The primary goal is to mitigate the computational challenges posed by large datasets. Notably, the NP-hard nature of the problem makes it intractable in polynomial time [18]. To improve the effectiveness of the classification process, the best subset of characteristics must be obtained. The optimal FS includes the following four steps: First, a collection of features is developed; next, using those features, fitness levels are compared; third, it's checked to see whether the termination requirements have been satisfied; finally, the best set of features is used to verify the findings. As illustrated in Eq. (1) below, FS problems are formulated by picking d critical features from a collection of D characteristics.
$f(x)=$ min $\_e r r(d)$ and $d C D$ (1)
Minimize f(x), subject to conditions x=|D| and x≥0. The suggested model's classification accuracy is improved by the use of the optimum subset of characteristics, as shown in Eq. (1).
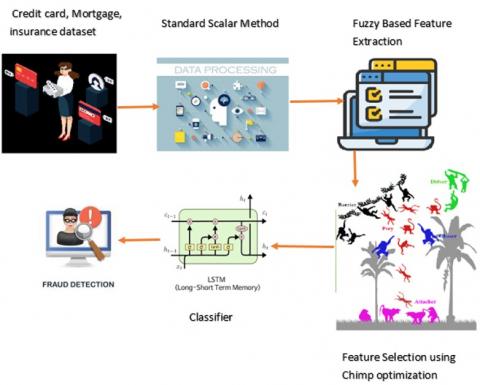
Three different dataset types—mortgage, credit card, and insurance—are first imported. Then, using a conventional scalar-based preprocessing method, the risk variables are scaled and values assigned to help detect the difference and decrease noise. Some fuzzy rules are applied after preprocessing to retrieve the features. Following feature extraction, an optimization-based FS is carried out to choose the features of users who have produced suspicious, fraudulent, and fraudulent results. Finally, classification based on long- and short-term memory is completed. Figure 1 illustrates the Architecture of Developed Model observed in fraud detection. This highlights the standard scalar method, fuzzy based feature extraction, LSTM, chimp optimization.
Figure 1. Architecture of developed model
4.1 Preprocessing of data using standard scalar method
The dataset should be chosen as the initial step from the online machine learning repositories. After that, we repaired and standardized the data sets that were gathered. These datasets have incorrect values and weren't collected in a controlled setting. As a result, data preparation is an essential step in data analysis and machine learning. Data normalization is the process of standardizing a dataset in which individual risk variables have different values. Data standardization involves assigning values to risk variables that reflect the distribution of standard deviations from the mean. It adjusts the risk factor value such that classifiers with a mean of 0 and a standard deviation of 1 perform better. Standardization may be expressed mathematically as:
standardization of $X=\frac{X-\text { mean of } X}{\text { standard deviation of } X}$ (2)
The idea behind this technique is to choose a set of samples that are close together in the feature space, draw a line between the data points, and then create a new instance of the minority class somewhere along the line after the criteria have been established.
4.2 Fuzzy based future extraction
Following preprocessing, fuzzy concepts are used to extract the features. This section performs the fundamental checks for each inbound transaction on a given card. The PIN, the transaction total, and the card's expiration date are all factors.
Rule 1: Matching consistency features. To protect the security of their common phone number and avoid getting caught, fraudsters use fresh electronic payment phone numbers for a lot of their illegal activities. Consequently, we establish the rule for matching consistency features. To check whether a common phone and a pay-bound phone in a transaction record are the same, we build the matching function Match(a,b). If the new feature phone numbers are the same, they get a 0, and if they're different, a 1.
$\operatorname{match}\left(\right.$ num $_{\text {com }}$, num $\left._{\text {e-pay }}\right\}=\left\{\right.$ true num $_{\text {com }}=$ num $_{\text {e-pay }}$ false otherwise (3)
Rule 2: The validation rule is unreliable because some suspicious transactions will be examined by the staff over the phone with the cardholder, other people will be verified as fraudulent, and still others will not be demonstrated because no one answers when the staff calls. The opinion of returning bank employees (pre_(trade_result )) as a means of checking the legitimacy of an unusual financial transaction that the system has intercepted Vf={V0, V1, null} where V0 is the verification result as true transaction, V1 is the verification result as fraud transaction and NULL is the suspicious transaction. We combine pre $_{\text {trade }_{\text {result }}}$ with is_common_ip for further verification. with $i s_{\text {common }_{i p}} \in\{$ true,false $\}$ is whether or not a shared IP is used in a transaction.
$\begin{aligned} \text { uncertain }_{\text {validaiton }}&=\left\{1 V_f=\text { null, }^{\text {is }} \text { common }_{\text {ip }}\right. \\ & =\text { false } 0 \text { otherwise } \\ & \end{aligned}$ (4)
Rule 3: Sensitive amount rule: The features that are related to amount are trade_amount, pay_single_limit and pay_accumulate_limit. For the aforementioned qualities, For the aforementioned qualities, fraudulent transactions typically contain the following attributes: To stay under the radar of a fraud-detection system and keep from being exposed as an impostor, a fraudster typically does a tiny test transaction before conducting a large transaction. This results in the addition of three characteristics to the raw data: sensitive_single_amount, sensitive_daily_amount and sensitive_test_amount. A={a1, a2, …, ac} specifies the daily maximum that may be charged to a credit card, where a_c is the amount presently being tracked.
$sensitive _{\text {single }_{\text {amount }}}=\left\{1 a_c \in\left[A_1-\varepsilon_1, A_1\right] \quad 0 \quad otherwise\right.$ (5)
$sensitive_{\text {daily}_{\text {amount}}}=\left\{1 \quad \sum_{i=1}^c A a_i \in\left[A_2-\varepsilon_2, A_2\right] 0 ~otherwise\right.$ (6)
sensitive $_{\text {test }_{\text {amount }}}= \begin{cases}1 & a_c \in A_{\text {small }} 0 \text { otherwise }\end{cases}$ (7)
Rule 5: Elderly rule: Some fraud schemes target senior citizens in particular. Fraudsters will persuade elderly victims to transfer their entire account amount at once. According to the original feature trade_amount, card_balance. rule data now has an extra field labeled big_onetime_deal.
$big_{\text {onetime }_{\text {deal }}}=\{1 \quad$ trade_amount $\rightarrow$ card_balance 0 otherwise (8)
Rule 8: Non-trusted time rule: Criminals that commit fraud often do it between the hours of 10:00 p.m. and 6:00 a.m. Based on the original feature white_list_mark and trade_time, the rule adds a new feature untrusted_time to raw data.
$\text {untrusted}_{ctime}=\{1$ white_list_mark $=$ $V_1($ not working $) 0~otherwise$ (9)
4.3 Selection of features using chimp optimization
The FS stage in applying machine learning algorithms is crucial. This is partly because the huge feature space in the dataset utilized for training and testing may have a detrimental effect on model performance. A researcher will choose one of the various FS methodologies depending on the kind of problem they are trying to solve. This work uses chimp optimization-based FS, which aids in choosing user features with suspect, fraudulent, and fraudulent results. The Ch_ORP is an example of swarm intelligence software that takes cues from chimpanzees' instinctive hunting behavior. The driver, barrier, chaser, and attacker are the four different types of agents in their neighborhood. In the optimization process, the "driver" guides the search, the "barrier" sets constraints, the "chaser" fine-tunes based on criteria, and the "attacker" disrupts by introducing variability. Together, they create a dynamic and adaptive optimization framework. Even if each chimp in a group has a distinct set of skills, these variations are necessary for accurate modeling of the hunting process. The mathematical description is as follows:
$X_{\text {chimp }}^{(t+1)}=X_{\text {prey }}^t-1\left|c \cdot X_{\text {prey }}^t-m \cdot X_{\text {chimp }}^t\right|$ (10)
where, $t$ is the current iteration, $X_{\text {prey }}^t$ and $X_{\text {chimp }}^t$ are the prey and chimp's position vectors, $a, m$, and $c$ are the coefficients stated as:
$a=2 \cdot f \cdot \operatorname{rand}_1-a$ (11)
$c=2 \cdot$ rand $_2$ (12)
$m=$ chaotic_value (13)
The m vector in these equations uses multiple chaotic vectors to indicate the sexual desire of the agents, and f is iteratively lowered nonlinearly in the interval [2.5, 0], whereas rand1 and rand2 are uniformly distributed between 0 and 1.
The stochastic population creation of agents kicks off the Ch_ORP. Like previous swarm-based techniques, this step requires a starting group of agents to be continuously developed across iterations. The four kinds of agents—driver, barrier, attacker, or chaser—are allocated at random. All groups will try to forecast the optimal prey placements; however, different methods will detail where the f vector is located and how the agents' positions are updated. The best position so far is that of the prey. Iterative adjustments to the c and m vectors enhance the avoidance of local minima and the speed of meeting. The assailant chimp often takes charge throughout the exploitation phase; however, the other agents may sometimes join in the actual hunting. Mathematical simulations of the hunting process are used because it is impossible to identify the prey's ideal position in advance. The other agents change their positions to accommodate the best agents, who are the pioneering chimpanzee drivers, attackers, chasers, and defenders. The position updating rule is represented by the equations below:
$x_1=x_{\text {attacker }}^t-a_1\left|c_1 x_{\text {attacker }}^t-m_1 x^t\right|$ (14)
$x_2=x_{\text {harrier }}^t-a_2\left|c_2 x_{\text {barrier }}^t-m_2 x^t\right|$ (15)
$x_3=x_{\text {chaser }}^t-a_3\left|c_3 x_{\text {chaser }}^t-m_3 x^t\right|$ (16)
$x_4=x_{\text {driver }}^t-a_3\left|c_3 x_{\text {driver }}^t-m_4 x^t\right|$ (17)
$x(t+1)=\frac{x_1+x_2+x_3+x_4}{4}$ (18)
where, the m vector depicts the erratic actions taken by agents in the closing stages of a hunt to gather more meat, and the outcome is an increase in social favors such as grooming. In high-dimensional problems with many possible solutions, chaotic maps have been proven to aid in convergence and protect against the entanglement of local optima. Assume that half of the agents will act normally and the other half will update their position using chaotic methods. The theoretical definition of the updating formula for this method is:
$X_{\text {chimp }}^{(t+1)}=\left\{X_{\text {prey }}^t-\text { a.d } \text { if } \mu<\right.0.5$ chaotic$_{\text {value }}$ if $\geq 0.5$ (19)
where, 0.5 is a chance number between [0, 1]. As a consequence, the creation of random agents (possible solutions) serves as the first catalyst for Ch_ORP. Second, each agent is assigned to one of the previously mentioned four autonomous groups. Agents then use the provided classified technique to update their f vector. Then, with each cycle, the four groups assess the potential prey locations. The distances between the agents and the prey can then be updated. Finally, chaotic maps make it possible to accelerate convergence while avoiding local minima stagnation. The goal of this study is to zero in on the optimum collection of input characteristics that improves the model's accuracy without increasing its fitness.
$\operatorname{err}\left(x_i\right)=\text { actual }_{\text {output }\left(x_i\right)} -\text { model estimated }_{\text {output }\left(x_i\right)}$ (20)
$\text { fitness }(x)=\frac{\sum_{x=0}^n \operatorname{eerr}(x)}{n}$ (21)
Those whose fitness levels have been reversed and made higher than or equal to their original fitness levels are the ones who will take on the roles of the new people. The least physically fit members of society are chosen to reproduce. The machine then selects the best possible options.
Chimp Optimization-Based FS (Ch_ORP) differentiates with a bio-inspired technique that mimics chimp behavior. When compared to conventional approaches, genetic algorithms, machine learning models, ensemble methods, and hybrids, Ch_ORP provides unique flexibility and a decentralized swarm intelligence element, offering a significant edge in FS for fraud detection.
4.4 Algorithm for FS
Input: extracted features
Output: optimal selected features
$i n=\{\operatorname{ext}(1), \operatorname{ext}(2) \ldots . \operatorname{ext}(n)\}$
Update the community of chimps driver (dr), barrier (ba), chaser (ch), and attackers (att)
Initiate dr and ch
$X_{\text {chimp }}^{(t+1)}=X_{\text {prey }}^t-1\left|c \cdot X_{\text {prey }}^t-m \cdot X_{\text {chimp }}^t\right|$
Update the hunting process
Increase the number of agents at each iteration
Assign the agents to any one of category dr, ba, ch, att
Make these group to find the best prey (B)
$B=\left\{\right.$ best $_{\text {prey } 1}$, best $_{\text {prey } 2}, \ldots$ best $\left._{\text {preyn }}\right\}$
Initiate the exploration phase
Obtain the optimal position by hunting
Finalize the position of agents and prey and update the fitness value
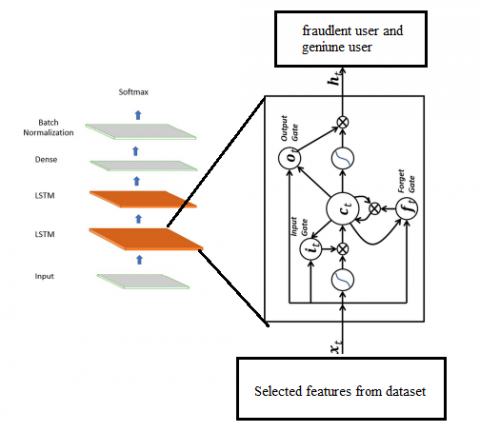
Figure 2. LSTM architecture
Figure 3. Comparative analysis of credit card datasets
In this study, we provide a recurrent neural network architecture called Long Short-Term Memory (LSTM) for use in financial fraud detection using deep learning. It works effectively for predictive modeling because it makes use of prior knowledge and establishes a connection between forecast outcomes and input data from the past. The LSTM design enables learning to overcome challenges associated with depending on long-term sequence prediction. It has a long memory and is thus essential for spotting longer-term trends. In addition, the default action preserves data permanently. The data from the previous stage is processed by the layers consisting of LSTM cells during the applying model phase. Figure 2 illustrates the LSTM architecture it works effectively for predictive modeling because it makes use of prior knowledge and establishes a connection between forecast outcomes and input data from the past.
The LSTM network's topology is shown in Figure 3 and includes memory blocks (cells) with a variety of states and gates. The main chain of information flow is determined by the cell’s state. It enables the unaltered flow of information. Values between zero and one are established using the sigmoid function; if the value is closer to 0, it should be forgotten, and if it is closer to 1, it should be kept. In addition, the forgettable data pieces are managed by the cell state vector ct-1. Forget gate is defined by the following equation:
$f t=\sigma\left(W_f\left[h_{t-1}, X_t\right]+b_f\right)$ (22)
The information that must be added from the current input Xt and the state of the cell are both determined by the input gate It.
This gate helped control the network by using the tanh function Nt to combine the current input with the secret state to produce a value between -1 and 1. In addition, it is applied to the previously-stated memory Ct-1 at time t-1 to fresh memory, as shown in Eqs. (3)-(5).
$I_t=\sigma\left(W_i\left[h_{t-1}, X_t\right]+b_i\right.$ (23)
$N_t=\tanh \left(W_n\left[h_{t-1}, X_t\right]+b_n\right.$ (24)
$C_t=C_{t-1} * f_t+N_t * I_t$ (25)
where, b and W stand for the input weights and bias matrices of the input gate ft. The next hidden state ht is determined conditionally by the output of the sigmoid gate ot and upgraded values generated by tanh from the cell state as shown in expressions 6-7.
$o_t=\sigma\left(W_o\left[h_{t-1}, X_t\right]+b_o\right)$ (26)
$h_t=o_t \tanh \left(C_t\right)$ (27)
where, b and W are the biases and input weight matrices of the output gate ft. This model employs a number of so-called hyperparameters that help enhance the outcomes. Hyperparameters play a crucial role in a model's performance, and finding optimal values is essential for effective learning and generalization. Adagrad is an integrated optimizer used to assess the proposed model's efficacy; it provides support for an adaptive learning rate and makes suitable adjustments to the model's parameters. It's able to carry out more streamlined upgrades. This trait makes it handy for problems with sparse data. Following this, the post-application is completed, which consists of two steps: obtaining the result and evaluating the output. The dataset's results will be displayed, and whether or not there is fraud will be determined. The obtained results will next be examined and evaluated. This analysis procedure depends on adjusting various model measurements and testing them on various numbers of layers and iterations. The goal is to find the optimal combination of prediction precision and processing speed through the adaptive parameters. Determine the optimal depth of analysis and number of iterations for optimal outcomes.
The effectiveness of the suggested technique is examined in this part using three distinct datasets [19-21]. Tables 2-4 provide a description of the datasets.
Table 2. Credit card datasets
|
Quantity of Sample |
58016 |
|
Quantity of Features |
40 |
|
Quantity Class |
2 |
|
Quantity of Positive samples |
57879 |
|
Quantity of Negative Samples |
137 |
|
Data Sources |
[19] |
Table 3. Mortgage datasets
|
Quantity of Sample |
48674 |
|
Quantity of Features |
11 |
|
Quantity Class |
2 |
|
Quantity of Positive samples |
48066 |
|
Quantity of Negative Samples |
608 |
|
Data Sources |
[20] |
Table 4. Insurance datasets
|
Quantity of Sample |
44326 |
|
Quantity of Features |
39 |
|
Quantity Class |
2 |
|
Quantity of Positive samples |
43814 |
|
Quantity of Negative Samples |
512 |
|
Data Sources |
[21] |
Deep learning measurements are often designed for binary classification issues, but they may also be used for multiclass issues. Metrics used for a multiclass classification problem internally are binary classifiers, considering one class as positive while considering all other classes as negative.
Accuracy- It is the first and most basic indicator used to assess network performance. It is determined by dividing the number of accurate forecasts by all of the predictions. It is represented by:
Accuracy $=\frac{T P+\text { True Negative }(T N)}{T P+T N+F P+F N}$ (28)
Precision- It focuses on the percentage of accurate predictions relative to the total number of forecasts. Recall measures the proportion of accurate forecasts that turn out to be correct.
Precision $=\frac{\text { True Positive }}{\text { Total Predicted Value }}$ (29)
Recall- It is the proportion of relevant documents that were successfully located during information retrieval.
Recall $=\frac{\text { True Positive }}{\text { True Positive }+ \text { False Positive }}$ (30)
F1-Score- F1-Score is a more illuminating metric than accuracy, particularly when dealing with unbalanced datasets. The F1 score estimate is given as:
F1score $=\frac{2 \times \text { Precison } \times \text { Recall }}{\text { Precision }+ \text { Recall }}$ (31)
MAE- This is a measurement of the consistency of differences between independent measurements of similar phenomena. Using the MAE as an example,
$M A E=\frac{\sum_{i=1}^n\left|l_i-m_i\right|}{n}$ (32)
where, prediction is given as li, true value is given as mi and the total count of data points is given as n.
Mean Square Error (MSE)- The average squared difference between an estimator's predictions and the actual value is known as its MSE or mean squared deviation. Regarding the MSE,
$M S E=\frac{1}{n} \sum_{i=1}^n\left(l_i-\widehat{l_l}\right)^2$ (33)
where, observed range is indicated as li, predicted range is indicated as $\widehat{l}_l$, and count of data points is given as n.
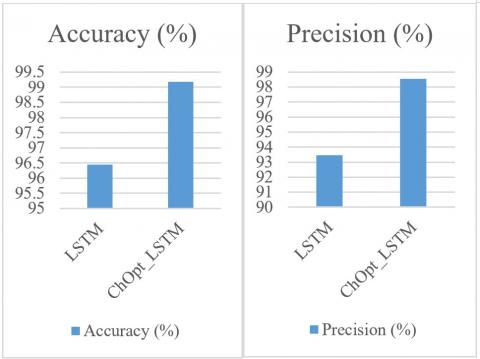
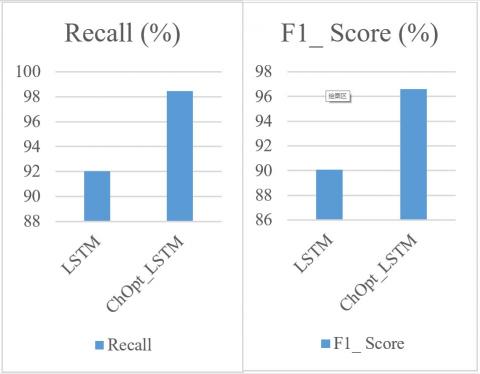
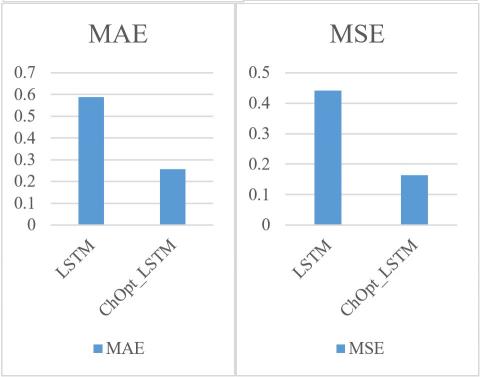
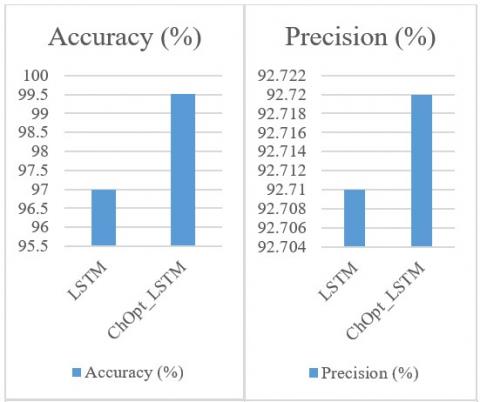
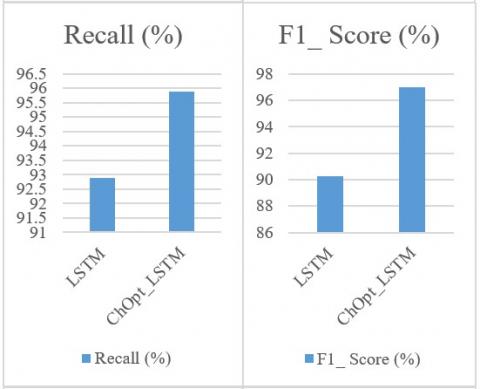
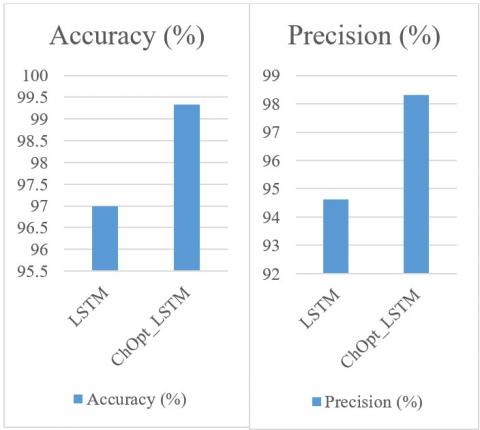
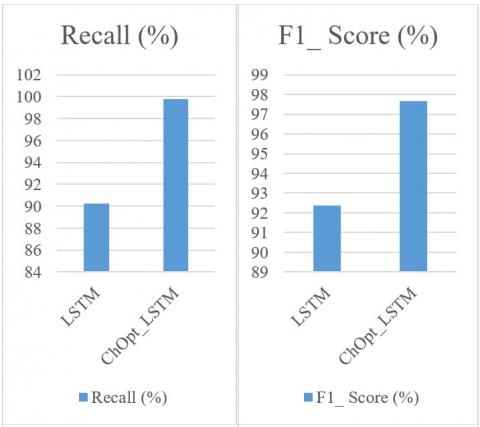
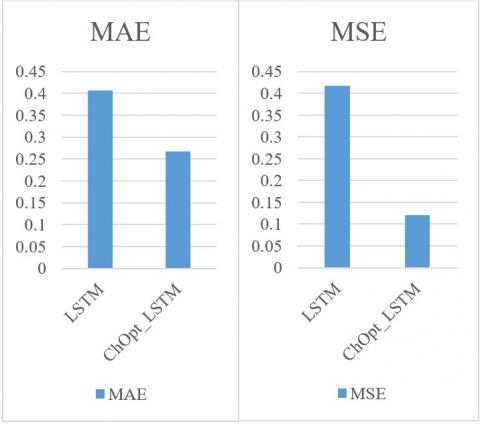
Figure 3 and Table 5 illustrate the comparison of accuracy, MAE, and MSE, precision, recall and F1_Score for the credit card datasets.
The accuracy, MAE, MSE, precision, recall, and F1_Score of the ChOpt+LSTM model compared to the LSTM model presently used on the credit card data are all shown in Figure 3. The resulting figures provided that the ChOpt+LSTM model had enhanced accuracy of 99.18 percent, a lowered MAE of 25.7, a lower MSE of 16.3, precision of 98.54 percent, recall of 98.47 and F1_Score of 96.58 compared to the LSTM model's slightly decreased accuracy of 96.45 percent, increased MAE of 58.9, an increased MSE of 44.2, precision of 93.47 percent, recall of 92.04 and F1_Score of 90.09.
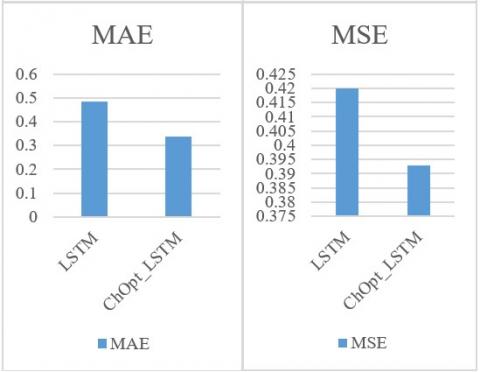
Accuracy, MAE, MSE, precision, recall, and F1 Score for identifying credit card fraud are compared in Figure 4 and Table 6. When compared to the LSTM model that is currently being applied to the Insurance Fraud data set, Figure 4 presents a comprehensive examination of the ChOpt+LSTM model's accuracy, MAE, MSE, precision, recall, and F1 Score. The ChOpt+LSTM model outperformed the LSTM model in every metric, with an improved accuracy of 99.51 percent, a lower MAE of 33.8, a lower MSE of 39.3, a higher recall of 95.88, and an F1 Score of 96.97 compared to the LSTM model's 97.00 percent, 48.5 percent, 42.0 percent, 92.71 percent, and 90.26 percent, respectively.
The accuracy, MAE and MSE, precision, recall, and F1 Score for identifying credit card fraud are compared in Figure 5 and Table 7, respectively. Figure 5 displays an in-depth analysis of the ChOpt+LSTM model's accuracy, MAE, MSE, precision, recall, and F1 Score in comparison to the LSTM model presently utilized on the mortgage sata. The ChOpt+LSTM model outperformed the LSTM model in every metric, including accuracy (99.34%), MAE (26.8), MSE (12.0%), recall (99.95%), and F1 Score (97.66%), compared to the LSTM model's (96.99%) performance in these areas.
Tables 8-10 show the accuracy for various datasets. This table shows that the proposed approach outperforms the state-of-the-art alternatives with respect to accuracy.
Figure 4. Comparative analysis of insurance datasets
Hence, the Chimp Optimization-Based FS (ChOpt) provides targeted and adaptable FS, which accounts for the ChOpt+LSTM model's excellent performance. The swarm intelligence-inspired design of ChOpt enables dynamic exploration of feature combinations, identifying complex fraud flags. The synergy with LSTM exploits strengths in FS and capturing temporal relationships, making ChOpt+LSTM useful in datasets with complicated fraud patterns.
Table 5. Comparative analysis of credit card datasets
|
Technique |
Accuracy (%) |
Precision (%) |
Recall (%) |
F1_ Score (%) |
MAE |
MSE |
|
LSTM |
96.45 |
93.47 |
92.04 |
90.09 |
0.589 |
0.442 |
|
ChOpt + LSTM |
99.18 |
98.54 |
98.47 |
96.58 |
0.257 |
0.163 |
Table 6. Comparative analysis of mortgage datasets
|
Technique |
Accuracy (%) |
Precision (%) |
Recall (%) |
F1_ Score (%) |
MAE |
MSE |
|
LSTM |
97.00 |
92.71 |
92.88 |
90.26 |
0.485 |
0.420 |
|
ChOpt+LSTM |
99.51 |
92.72 |
95.88 |
96.97 |
0.338 |
0.393 |
Table 7. Comparative analysis of mortgage datasets
|
Technique |
Accuracy (%) |
Precision (%) |
Recall (%) |
F1_ Score (%) |
MAE |
MSE |
|
LSTM |
96.99 |
94.63 |
90.23 |
92.37 |
0.407 |
0.417 |
|
ChOpt+LSTM |
99.34 |
98.32 |
99.79 |
97.66 |
0.268 |
0.120 |
Table 8. Comparative analysis of various methods for credit card datasets
|
References |
Techniques |
Accuracy (%) |
|
Developed method |
ChOpt+LSTM |
99.18 |
|
Shahapurkar [22] |
AFD-HHM |
96.00 |
|
Hajek et al. [23] |
GBDT+XGBoost |
52.45 |
|
Arun et al. [24] |
BEPO-OGRU |
94.74 |
Table 9. Comparative analysis of various methods for insurance datasets
|
References |
Techniques |
Accuracy (%) |
|
Developed method |
ChOpt+LSTM |
99.51 |
|
Parnian et al. [25] |
SOA+kNN |
98.08 |
|
Panda et al. [26] |
PKRR+ISSO |
98.5 |
|
Bharat et al. [27] |
RHOFS+kNN |
99.61 |
Table 10. Comparative analysis of various methods for mortgage datasets
|
References |
Techniques |
Accuracy (%) |
|
Developed method |
ChOpt+LSTM |
99.34 |
|
Ojugo and Nwankwo [28] |
GA+MNN |
74 |
|
Keswani et al. [29] |
LR+SMOTE |
97 |
|
Bharat et al. [27] |
RHOFS+NB |
98.85 |
Figure 5. Comparative analysis of mortgage datasets
8.1 Comparative analysis with existing techniques
Tables 11-13 show the MAE and MSE values for various datasets. According to that table, the suggested approach has fewer mistakes than several other existing methods.
Table 11. Comparative analysis of various methods for credit card datasets
|
References |
Techniques |
MAE (%) |
MSE (%) |
|
Developed method |
ChOpt+LSTM |
0.257 |
0.163 |
|
Singh and Jain [30] |
PSOS +kmm |
0.175 |
0.412 |
|
Rani et al. [31] |
PSO+NN |
0.335 |
0.365 |
|
Singh and Jain [32] |
KNN+PCA |
0.498 |
0.323 |
Table 12. Comparative analysis of various methods for insurance datasets
|
References |
Techniques |
MAE (%) |
MSE (%) |
|
Developed method |
ChOpt+LSTM |
0.338 |
0.393 |
|
Oikonomidis et al. [33] |
CNN+XGBoost |
0.263 |
0.374 |
|
Singh and Jain [30] |
RIG+SVM |
0.153 |
0.392 |
|
Huang et al. [34] |
NN+LSTM |
0.192 |
0.382 |
Table 13. Comparative analysis of various methods for mortgage datasets
|
References |
Techniques |
MAE (%) |
MSE (%) |
|
Developed method |
ChOpt+LSTM |
0.268 |
0.120 |
|
Singh et al. [35] |
GA+KNN |
0.138 |
0.289 |
|
Singh and Jain [30] |
SVM+RF |
0.412 |
0.363 |
|
Hasanluo et al. [36] |
PSO+KNN |
0.224 |
0.780 |
Table 14. Comparative analysis of various methods for credit card datasets
|
References |
Techniques |
Precision (%) |
Recall (%) |
F1_ Score (%) |
|
Developed method |
ChOpt+LSTM |
98.54 |
98.47 |
96.58 |
|
Shahapurkar [37] |
AFD-HHM |
94 |
97 |
96 |
|
Panda et al. [26] |
PKRR+ISSO |
96.5 |
95.68 |
95.68 |
|
Padhi et al. [38] |
RHOFS+NB |
88.68 |
71.21 |
78.99 |
Table 15. Comparative analysis of various methods for insurance datasets
|
References |
Techniques |
Precision (%) |
Recall (%) |
F1_ Score (%) |
|
Developed method |
ChOpt+LSTM |
92.72 |
95.88 |
96.97 |
|
Parnian et al. [25] |
SOA+kNN |
98.97 |
98.54 |
98.72 |
|
Keswani et al. [29] |
SMOTE+DT |
32 |
72 |
45 |
|
Ileberi et al. [39] |
GA+ANN |
82.40 |
78.76 |
80.54 |
Table 16. Comparative analysis of various methods for mortgage datasets
|
References |
Techniques |
Precision (%) |
Recall (%) |
F1_ Score (%) |
|
Developed method |
ChOpt+LSTM |
98.32 |
99.79 |
97.66 |
|
Bharat et al. [27] |
RHOFS+kNN |
89.79 |
98.54 |
92.93 |
|
Keswani et al. [29] |
SMOTE + LR |
65 |
87 |
12 |
|
Sathya and Balakumar [40] |
RF+SVM |
97.8 |
98 |
97.6 |
Tables 14-16 show the precision, recall, and F1Score values for various datasets. The values in the suggested technique are higher in that table when compared to the various existing methods.
This study holds significance in the realm of internet security by introducing an effective technique for detecting cyberattacks. This is crucial for safeguarding financial transactions, minimizing economic losses, instilling user confidence, advancing fraud detection methods, and ensuring applicability across various sectors. Utilizing metrics like accuracy, precision, recall, MAE, and MSE, our evaluation demonstrates the superior performance of the proposed procedure compared to existing methods, particularly outperforming ChOpt+LSTM in accuracy across three datasets. However, it's crucial to acknowledge that the efficacy of our technique may vary based on dataset features, and generalizability across settings should be approached cautiously. Variations in data quality and the evolving landscape of cyber threats introduce uncertainties. Despite these limitations, our study paves the way for future breakthroughs in online fraud detection. Future work will focus on optimizing approaches and fine-tuning parameters to enhance efficiency.
[1] Zhang, R., Zheng, F., Min, W. (2018). Sequential behavioral data processing using deep learning and the Markov transition field in online fraud detection. arXiv preprint arXiv:1808.05329. https://arxiv.org/abs/1808.05329
[2] Joe, M.C.V., Raj, J.S. (2021). Location-based orientation context dependent recommender system for users. Journal of Trends in Computer Science and Smart Technology, 3(1): 14-23. https://doi.org/10.36548/jtcsst.2021.1.002
[3] Zhang, X., Han, Y., Xu, W., Wang, Q. (2021). HOBA: A novel feature engineering methodology for credit card fraud detection with a deep learning architecture. Information Sciences, 557: 302-316. https://doi.org/10.1016/j.ins.2019.05.023
[4] Haoxiang, W., Smys, S. (2021). Overview of configuring adaptive activation functions for deep neural networks-a comparative study. In Journal of Ubiquitous Computing and Communication Technologies (UCCT), 3(1): 10-22. https://doi.org/10.36548/jucct.2021.1.002
[5] Choi, D., Lee, K. (2018). An artificial intelligence approach to financial fraud detection under IoT environment: A survey and implementation. Security and Communication Networks, 2018: 5483472. https://doi.org/10.1155/2018/5483472
[6] Smys, S., Raj, J.S. (2021). Analysis of deep learning techniques for early detection of depression on social media network-A comparative study. Journal of Trends in Computer Science and Smart Technology (TCSST), 3(1): 24-39. https://doi.org/10.36548/JTCSST.2021.1.003
[7] Wang, Y., Xu, W. (2018). Leveraging deep learning with LDA-based text analytics to detect automobile insurance fraud. Decision Support Systems, 105: 87-95. https://doi.org/10.1016/j.dss.2017.11.001
[8] Ranganathan, G. (2021). A study to find facts behind preprocessing on deep learning algorithms. Journal of Innovative Image Processing (JIIP), 3(1): 66-74. https://doi.org/10.36548/jiip.2021.1.006
[9] Kim, E., Lee, J., Shin, H., Yang, H., Cho, S., Nam, S.K., Kim, J.I. (2019). Champion-challenger analysis for credit card fraud detection: Hybrid ensemble and deep learning. Expert Systems with Applications, 128: 214-224. https://doi.org/10.1016/j.eswa.2019.03.042
[10] Vivekanadam, B. (2020). Analysis of recent trend and applications in block chain technology. Journal of ISMAC, 2(04): 200-206.
[11] Sudarshana, K., MylaraReddy, C., Adhoni, Z.A. (2022). Classification of credit card frauds using autoencoded features. In: Rao, B.N.K., Balasubramanian, R., Wang, SJ., Nayak, R. (eds) Intelligent Computing and Applications. Smart Innovation, Systems and Technologies, Springer, Singapore. https://doi.org/10.1007/978-981-19-4162-7_2
[12] Mohana, M., Kumaran, K., Nandhini, N., Ananthi, N., Naresh, J., Madhavan, K.R. (2022). Credit card fraud detection using neural network auto encoders. In 2022 International Conference on Advances in Computing, Communication and Applied Informatics (ACCAI), Chennai, India, pp. 1-7. https://doi.org/10.1109/ACCAI53970.2022.9752560
[13] Esenogho, E., Mienye, I.D., Swart, T.G., Aruleba, K., Obaido, G. (2022). A neural network ensemble with feature engineering for Improved Credit Card Fraud Detection. IEEE Access, 10: 16400-16407. https://doi.org/10.1109/ACCESS.2022.3148298
[14] Zhang, G., Li, Z., Huang, J., Wu, J., Zhou, C., Yang, J., Gao, J. (2022). eFraudCom: An e-commerce fraud detection system via competitive graph neural networks. ACM Transactions on Information Systems (TOIS), 40(3): 1-29. https://doi.org/10.1145/3474379
[15] Benchaji, I., Douzi, S., El Ouahidi, B. (2021). Credit card fraud detection model based on LSTM recurrent neural networks. Journal of Advances in Information Technology, 12(2): 113-118. https://doi.org/10.12720/jait.12.2.113-118
[16] Daliri, S. (2020). Using harmony search algorithm in neural networks to improve fraud detection in banking system. Computational Intelligence and Neuroscience, 2020: 6503459. https://doi.org/10.1155/2020/6503459
[17] Yang, K., Xu, W. (2019). FraudMemory: Explainable memory-enhanced sequential neural networks for financial fraud detection. In Proceedings of the 52nd Hawaii International Conference on System Sciences. http://hdl.handle.net/10125/59542
[18] Drotár, P., Gazda, J., Smékal, Z. (2015). An experimental comparison of feature selection methods on two-class biomedical datasets. Computers in Biology and Medicine, 66: 1-10. https://doi.org/10.1016/j.compbiomed.2015.08.010
[19] Credit Card Fraud Dataset, https://www.kaggle.com/datasets/mlg-ulb/creditcardfraud.
[20] Mortage Fraud Dataset, https://www.kaggle.com/roshansharma/insurance-claim.
[21] Insurance Fraud Dataset. https://www.kaggle.com/code/arjunjoshua/predicting-fraud-in-financial-payment-services/data.
[22] Shahapurkar, A.S. (2021). Accurate fraud detection in credit card transactions using hybrid heuristic and meta-heuristic algorithms. In Proceedings of the International Conference on Innovative Computing & Communication (ICICC). https://doi.org/10.2139/ssrn.3834947
[23] Hajek, P., Abedin, M.Z., Sivarajah, U. (2022). Fraud detection in mobile payment systems using an XGBoost-based framework. Information Systems Frontiers, 1-19. https://doi.org/10.1007/s10796-022-10346-6
[24] Arun, G.K., Rajesh, P. (2022). Design of metaheuristic feature selection with deep learning based credit card fraud detection model. In 2022 Second International Conference on Artificial Intelligence and Smart Energy (ICAIS), Coimbatore, India, pp. 191-197. https://doi.org/10.1109/ICAIS53314.2022.9742937
[25] Parnian, K., Sorouri, F., Souha, A.N., Molazadeh, A., Mahdavi, S. (2021). Fraud detection in health insurance using a combination of feature subset selection based on squirrel optimization algorithm and nearest neighbors algorithm methods. Future Generation in Distributed Systems Journal, 3(2): 1-11.
[26] Panda, G., Dhal, S.K., Dash, S. (2022). An intensified social spider optimization (ISSO) based progressive kernel ridge regression (PKRR) classification model for automobile insurance fraud detection. Journal of Positive School Psychology, 6(3): 6822-6831.
[27] Bharat, B.K., Chakravarty, S., Naik, B., Pattanayak, R. M., Das, H. (2022). RHSOFS: Feature selection using the rock hyrax swarm optimization algorithm for credit card fraud detection system. Sensors, 22(23): 9321. https://doi.org/10.3390/s22239321
[28] Ojugo, A.A., Nwankwo, O. (2021). Spectral-cluster solution for credit-card fraud detection using a genetic algorithm trained modular deep learning neural network. JINAV: Journal of Information and Visualization, 2(1): 15-24. https://doi.org/10.35877/454RI.jinav274
[29] Keswani, B., Vijay, P., Nayak, N., Keswani, P., Dash, S., Sahoo, L., Mohapatra, A.G. (2020). Adapting machine learning techniques for credit card fraud detection. In International Conference on Innovative Computing and Communications: Proceedings of ICICC 2019, 1: 443-455. https://doi.org/10.1007/978-981-15-1286-5_38
[30] Singh, A., Jain, A. (2019). Financial fraud detection using bio-inspired key optimization and machine learning technique. International Journal of Security and Its Applications, 13(4): 75-90.
[31] Rani, P., Shokeen, J., Agarwal, A., Bhatghare, A., Majithia, A., Malhotra, J. (2022). Credit card fraud detection using blockchain and simulated annealing k-means algorithm. In International Conference on Innovative Computing and Communications: Proceedings of ICICC 2021, 3: 51-59. https://doi.org/10.1007/978-981-16-3071-2_5
[32] Singh, A., Jain, A. (2021). Hybrid bio-inspired model for fraud detection with correlation based feature selection. Journal of Discrete Mathematical Sciences and Cryptography, 24(5): 1365-1374. https://doi.org/10.1080/09720529.2021.1932929
[33] Oikonomidis, A., Catal, C., Kassahun, A. (2022). Hybrid deep learning-based models for crop yield prediction. Applied Artificial Intelligence, 36(1): 2031822. https://doi.org/10.1080/08839514.2022.2031823
[34] Huang, S.Y., Lin, C.C., Chiu, A.A., Yen, D.C. (2017). Fraud detection using fraud triangle risk factors. Information Systems Frontiers, 19: 1343-1356. https://doi.org/10.1007/s10796-016-9647-9
[35] Singh, A., Jain, A., Biable, S.E. (2022). Financial fraud detection approach based on firefly optimization algorithm and support vector machine. Applied Computational Intelligence and Soft Computing, 2022: 1468015. https://doi.org/10.1155/2022/1468015
[36] Hasanluo, M., Soleimanian Gharehchopogh, F. (2016). Software cost estimation by a new hybrid model of particle swarm optimization and k-nearest neighbor algorithms. Journal of Electrical and Computer Engineering Innovations (JECEI), 4(1): 49-55. https://doi.org/10.22061/jecei.2016.556
[37] Shahapurkar, A.S. (2021). Accurate fraud detection in credit card transactions using hybrid heuristic and meta-heuristic algorithms. In Proceedings of the International Conference on Innovative Computing & Communication (ICICC). https://doi.org/10.2139/ssrn.3834947
[38] Padhi, B.K., Chakravarty, S., Biswal, B.N. (2020). Anonymized credit card transaction using machine learning techniques. In: Mohanty, M., Das, S. (eds) Advances in Intelligent Computing and Communication. Lecture Notes in Networks and Systems, Springer, Singapore. https://doi.org/10.1007/978-981-15-2774-6_49
[39] Ileberi, E., Sun, Y., Wang, Z. (2022). A machine learning based credit card fraud detection using the GA algorithm for feature selection. Journal of Big Data, 9(1): 1-17. https://doi.org/10.1186/s40537-022-00573-8
[40] Sathya, M., Balakumar, B. (2022). Insurance fraud detection using novel machine learning technique. International Journal of Intelligent Systems and Applications in Engineering, 10(3): 374-38.