Shashank Chaudhary![]() | Upendra Kumar*
| Upendra Kumar*![]()
© 2024 The authors. This article is published by IIETA and is licensed under the CC BY 4.0 license (http://creativecommons.org/licenses/by/4.0/).
OPEN ACCESS
Agriculture, a pivotal sector in the Indian economy, plays a crucial role in national development. A significant challenge within this domain is the detection of crop diseases, with brown spot, leaf blast, and bacterial blight being prevalent afflictions in rice crops. This study presents an innovative approach, integrating Gray-level Co-occurrence Matrix (GLCM) and Intensity-Level Based Multi-Fractal Dimension (ILMFD) for feature extraction in disease identification. The efficacy of this integrated technique was evaluated through a comparison with various classifiers. Specifically, the Artificial Neural Network (ANN), Support Vector Machine (SVM), and Neuro-Genetic Algorithm (Neuro-GA) were employed to ascertain their precision in disease detection. It was observed that the combination of GLCM and ILMFD with the Neuro-GA classifier achieved an accuracy exceeding 90%. Remarkably, when paired with the SVM classifier, this integrated approach yielded a precise accuracy of 96.7% in detecting brown spot disease in rice. These findings not only validate the effectiveness of the GLCM and ILMFD methods in feature extraction but also highlight the superior performance of the SVM classifier in crop disease detection. This research contributes significantly to the field, offering a robust solution for accurate disease diagnosis in rice crops, thereby aiding in the sustainable management of agricultural practices.
classification, image processing, feature extraction, machine learning
India boasts some of the world's largest rice fields. It is renowned for its extensive rice growing. Rice agriculture has a crucial role in India's economy. Historians claim that the cultivated variant of this plant originated in the foothills of the Eastern Himalayas. Subsequently, it was disseminated to more nations, including Burma, Thailand, and Vietnam [1]. Rice is widely recognized as a highly significant staple crop. It is also considered the second most productive cereal in the world, following wheat. India is anticipated to have a surge in population and a growing demand for rice, which would consequently necessitate enhanced food security measures and heightened agricultural output. Regrettably, illnesses have the potential to inflict damage upon the agricultural produce of a nation. Plant disease control is more complex due to multiple variables. These factors encompass the rising need for secure and nourishing sustenance, the exhaustion of ecological assets, and the rivalry over scarce land resources. Monocultures and agricultural intensification are responsible for the growing threat of disease outbreaks [2]. Detecting the initial phases of a botanical ailment is crucial to preempt its detrimental impact on agricultural yields. Tian introduced a sophisticated technique for identifying diseases in rice crops by utilizing a computer vision system. The researchers employed a range of sophisticated methodologies, including neural networks, machine learning, and image processing, to detect and classify plant illnesses [3]. A visual method for recognizing different types of rice illnesses based on their distinct leaf texture characteristics. The objective of this study is to present the principles of image processing for the categorization of plant diseases [4].
An inherent drawback of the existing classification systems is their lack of generalizability. Consequently, their ability to recognize a specific disease is limited to the extent of their training on a particular dataset [5]. After successfully recognizing a rice plant disease, the model had an accuracy rate of 90%. However, subsequent exposure to varying conditions resulted in a decline in its accuracy, so casting doubt on its utility. This is a significant factor contributing to the diminished precision of the outcomes. Presently, this endeavor suffers from a want of a deep learning-based solution capable of discerning various forms of diseases in rice plants.
The identification of diseases is a crucial aspect of agricultural research since it enables accurate diagnosis and monitoring of crop conditions on a farm. The objective of this study is to enhance the efficacy of the image-based detection system by investigating several rice leaf diseases [6]. The primary goals are to create an automated system that use image processing and machine learning approaches to detect and classify diseases affecting rice leaves. This study included two feature extraction techniques and three classification algorithms to accurately identify and categorize various types of rice illnesses. The available classifiers are Artificial Neural Networks (ANN), Support Vector Machines (SVM), and Neuro-Genetic Algorithms (Neuro-GA). The Support Vector Machine (SVM) algorithm, known for its high accuracy in disease prediction, offers significant benefits in disease detection.
Precise identification of illnesses affecting rice crops the diligent work of numerous prominent academics in recent years has transformed it into a highly promising field for further investigation. The progress in image processing and machine learning methods for detecting rice diseases has been substantial. Researchers have been able to determine the specific diseases that are most likely to arise and spread [7-9].
The process commences with the pre-processing of the dataset. The GLCM, histogram of oriented gradients (HoG), and color moments are employed to extract the colors and textures. The features are subsequently merged to create hybrid ones [10]. Effective multivariate analysis necessitates appropriate preparation of near-infrared (NIR) data due to the presence of unforeseen elements including light scattering and background noise [11]. Feature extraction is a method that reduces the dimensionality of data. The objective is to identify the most pertinent information from the primary source and display it in a space with fewer dimensions [12, 13]. Gavhale suggested the conversion of color spaces, improvement of image quality, and segmentation of the region of interest. The analysis of plant leaves' severity and defect areas is conducted using K-means clustering. The system also employs GLCM techniques to extract texture characteristics and employs SVM for classification, achieving a 96% accuracy rate [14]. Ahamad and Shahid [15] propose a novel technique for extracting characteristics from an image. It integrates the proficiency of principal component analysis (PCA) and multi-dimensional dimension analysis (MFD). The proposed strategy utilizes the optimal decisions made by both methods, resulting in a high level of accuracy and efficiency [15]. The GLCM utilizes the following features: correlation, entropy, angular second moment, and inverse difference. The study findings indicate that these characteristics exhibit a high level of precision and are highly effective for applications involving image recognition [16].
Table 1. Summary of different methods proposed for identification and classification leaf disease
|
R.N |
Author |
Work |
Dataset |
Result |
Techniques [14] |
|
[14] |
Gavhale et al. (2014) |
Identify an unhealthy area of citrus vegetation using image processing techniques |
200 images for training 100 images for testing |
96% accuracy achieved |
GLCM, SVM |
|
[17] |
Gajula Ramesh and Ramu (2020) |
Detection of plant diseases is carried out using GLCM feature extraction. SVM and ANN involves to classify |
1000 images dataset |
86% accuracy using SVM and 96% accuracy using Back- Propagated ANN |
GLCM, SVM, & ANN |
|
[18] |
Harakannanavar et al.(222) |
Different images of tomato leaves with six problematic features were used in the experiments to detect leaf diseases |
600 data samples |
88% of Accuracy using SVM |
GLCM, PCA & SVM |
|
[19] |
Abusham (2021) |
Identify alfalfa diseases in leaves |
100 images of each disease |
90% accuracy by using K-Means clustering and the local binary pattern. |
K-Means, LBP, KNN |
|
[20] |
Parikh et al. (2019) |
Identify and estimate the stage of a cotton plant disease using images |
150 images for training and 40 images for testing |
Achieve an accuracy of 82.50% |
KNN |
|
[21] |
Babu (2019) |
Identify plant disease using image processing |
- |
95.63% linear SVM 94.23% RBF 95.87 polynomial SVM |
SVM |
|
[22] |
Jasim and AL-Tuwaijari (2020) |
Classify the plant leaf diseases such as potatoes, tomatoes, and pepper |
20636 images of plant and their diseases |
achieve an accuracy of 98.29% |
CNN |
|
[23] |
Jiang et al. (2020) |
Identification and forecasting of rice diseases |
8911 rice leaf dataset |
The correct rate of recognition is 96.8% |
CNN, SVM |
|
[24] |
Chaudhary and Kumar (2022) |
Detection and classification of the brown spot rice disease |
1408 images for training 603 images for testing |
82% accuracy using SVM,95% accuracy using CNN |
SVM, CNN |
|
[25] |
Chaudhary and Kumar (2023) |
Develop automated system to detect rice disease and achieve higher accuracy |
3355 leaves dataset used |
Combination of ILMFD and TWSVM achieve higher accuracy |
GLCM, ILMFD, ANN, SVM, TWSVM |
|
[26] |
Shrivastava and Patidar (2022) |
Design decision support system to identify rice diseases |
5932 image dataset used |
92.4% accuracy achieved using SVM while 99.5% accuracy using ANN |
SVM, ANN |
|
[27] |
Prakash et al. (2017) |
Identify and classify leaf diseases |
60 images of citrus leaves |
90% accuracy achieved |
GLCM, SVM |
|
|
Proposed methodology |
Combines the GLCM features with the ILMFD features and classify using ANN and Neuro-GA |
Healthy leaves 1488 Brown spot 523 |
Integrated method (GLCM & ILMFD) features using SVM achieves higher accuracy of more than 90% |
GLCM ILMFD ANN Neuro-GA |
Plant diseases are detected through the utilization of a GLCM feature extraction technique. This entails utilizing a conventional SVM algorithm to extract the characteristics of the leaf. Regrettably, this strategy is capable of attaining an accuracy rating of approximately 87%. By employing artificial intelligence through a back-propagated artificial neural network (ANN), this technique can attain an impressive accuracy of 96% [17].
After extracting relevant features from objects, they are then transformed into feature vectors, which are used by classifiers to identify the output of the given input. By looking at these vectors, a classifier can easily distinguish between different classes. The various descriptors used for the extraction of the tomato leaves included the principal component analysis (PCA) and GLCM. The features that were extracted were then classified using SVM, and the predicted model was tested with an accuracy of 88% [18]. The proposed system was able to identify alfalfa diseases with up to 90% accuracy by using K-means clustering and the local binary pattern (LBP). The KNN method will then be used to classify the various types of diseases that are prevalent in this area. These include the fungus and pest diseases, red spider, and leaf minor [19, 20]. A system was developed that uses image processing to identify plant diseases. They used various techniques to demonstrate their accuracy, such as F-1, recall, accuracy, and precision. The accuracy of the SVM linear kernel is at 95.63%, while the RBF and SVM polynomial kernels are at 94.23% and 95.87%, respectively. SVM polynomial kernels are the most accurate method for classification [21]. The CNN network was utilized to classify the plant leaf diseases. There were 15 classifications, and 12 of them were for the diseases of different kinds of plants, such as fungi and bacteria, achieving an accuracy of 98.29% for the classifications [22]. Jiang et al. [23] use CNNs to extract the various features of the rice leaf disease. Then, we use SVM to classify and predict the disease. The correct rate of recognition for the rice disease model is 96.8%. The study covers the research outcomes using CNN and SVM for classifying rice disease. The accuracy of CNNs at identifying and measuring rice diseases was 95%, while that of SVM was 82% [24].
To achieve the highest accuracy for rice diseases, the two feature extraction methods used were the GLCM and ILMFD with three different classifiers, namely the ANN, SVM, and Twin support vector machine (TWSVM) [25]. The paper presents a framework that includes the use of various extraction methods. These include canny edge detection, grid color movement, and texture analysis. The extracted features are then combined with the training vector for the two ML algorithms, namely the SVM and ANN [26]. A method is used to identify and classify leaf diseases. The first step is to segment the diseased part using K-Means segmentation, followed by the extraction of GLCM texture features and the classification using SVM [27].
The findings of this literature review, shown in Table 1, inspired us to develop a method for detecting rice diseases using an automatic detection system. The most notable characteristic of this approach is its ability to maintain a remarkable efficiency rate of 96.4%, which serves as a resounding endorsement of our methodology. The method utilized in this study, which is an integrated approach for feature extraction using the GLCM and ILMFD methods, and classification with SVM methods, exhibited a higher accuracy level. This shows the worth of this approach. The paper also highlighted several limitations in the literature regarding the various techniques used by different researchers. It also highlighted the limitations regarding the generalization of the classification techniques. The literature has not been able to provide a comprehensive overview of the conditions and datasets that are involved in the classification process. Gaps in the existing literature make it impossible to identify multiple rice plant diseases using deep learning methods.
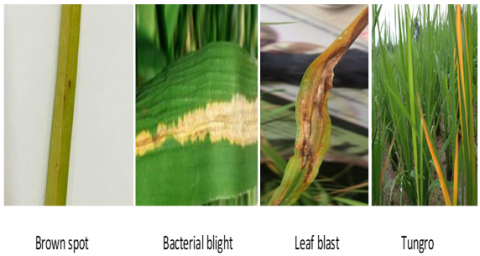
The goal of IPM involves two main aspects: monitoring and preventing diseases and pests. This is done through the use of AI and sensing techniques. This section covers the various types of rice diseases and their appearance, providing the necessary information to identify their visual symptoms. The IPM program is also focused on the detection and control of the spread of rice diseases such as Brown spot, Bacterial blight, Leaf blast, and Tungro [28]. These diseases are shown in Figure 1.
Figure 1. Major rice diseases
Based on the symptoms, the diagnosis process is carried out based on the visual presentation of the disease. Tackling and stunting can be caused by tungro. Its leaves turn orange or yellow, and it can also produce spots that are rust-colored. The yellowing begins at the tip of the leaves, extending to the lower blade section. Usually, brown spots are characterized by a yellow halo around their centers and dark brown to reddish-brown margins. They then develop a necrotic center and margin as the lesions expand. The rice leaf blast lesions can vary in size and appearance. They can have small round, dark, or oval spots, be surrounded by gray dead areas, and be bordered by reddish-brown. They turn into diamond-shaped or linear structures with pointed ends [29]. Leaf blight can be easily identified by looking for its symptoms. This can be done by inspecting the leaf's margins, which are blighted by bacterial exudates. It can also be detected by exudation, which involves observing the leaf's surface. Usually, the thick line that emerges from the margins and tips of the leaves turns into a viscous liquid. It is believed that this disease has caused 75% of the rice's crop losses each year [30, 31].
Image processing and machine learning can help identify and quickly determine rice crop diseases. The severity of the disease can be determined by comparing the size of the affected areas to that of the whole plant [32]. Another crucial aspect of this technique is to keep track of the plant's progression, which is needed in order to detect and identify the various symptoms that are invisible to most observers. Here is the baseline method where the GLCM and ILMFD feature extraction methods were used individually with different classification methods [25]. The scope of this work that was done before was expanded to include the new features. In this proposed work, we combine the features of GLCM and ILMFD with different classification methods (ANN, SVM, and Neuro-GA).
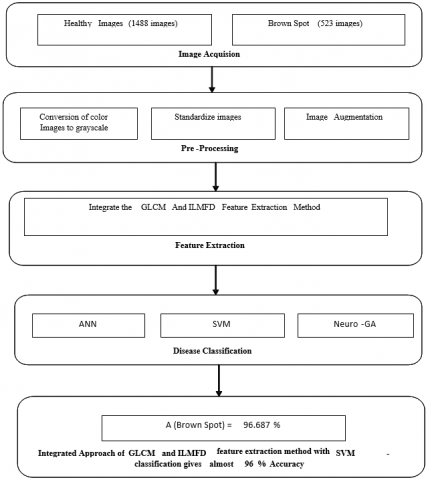
The integrated GLCM and ILMFD feature extraction method is commonly used in the detection of various diseases, as shown in Figure 2. This allows us to identify the exact regions where the disease is prevalent. The advantage of the GLCM method is that it is utilized for extracting various statistical texture parameters from an image, such as the inverse difference moment, entropy, correlation, and angular second moment. Compared to other discrete wavelet transform (DWT) techniques, the GLCM method is faster at converting images to gray-level format. However, it is also versatile enough to compress videos as a whole [33]. The ILMFD framework is mainly used for capturing the rough texture and shape of 3D aggregates in their 2D form. After collecting the necessary features, the final decision will be made regarding the recognition of the rice disease. The integration of the extraction capabilities of the GLCM and ILMFD frameworks into a single solution can result in a significant increase in the efficiency of the process [15].
The proposed research work that is being conducted to classify the different types of rice diseases is divided into five main categories. These include collecting raw data, pre-processing the data segmentation, performing statistical analysis using feature extraction, and finally creating the class with the different classifiers shown in Figure 3.
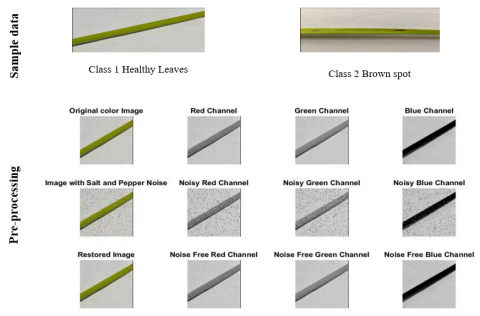
4.1 Image acquisition
The paper focuses on healthy rice leaves and brown spot rice disease. The study was conducted on 2011 rice leaf samples, which included healthy class and unhealthy class (brown spot) rice sample datasets, as shown in Figure 3. The used data is presented and summarizes the class information [34]. In each class, a different set of training and testing ratios was selected, and different image pre-processing techniques, such as edge detection and morphology, were utilized. The values of the healthy class and unhealthy (brown spot) classes were used as the pixel value of 1881×1881×3 uint8 for classification as a disease.
Figure 2. Proposed methodologies
Figure 3. Steps involved in our proposed methodology for the classification of the disease
4.2 Image pre-processing
The development of a pre-processing scheme involves four main steps. The first step is creating a color transformation framework for the input image. After that, the green pixels are removed using a predefined threshold value. The segmentation process then takes place, and the texture statistics are calculated [35]. Image is usually composed of a mix of colors for normal eyes, like red, green, and blue; it actually has real numbers inside its matrix for digital cameras and computers. A mathematical transformation can be performed to change the parameters of the image. Various image processing transformations, such as binaryzation, normalization, and thresholding, are used before getting features [36].
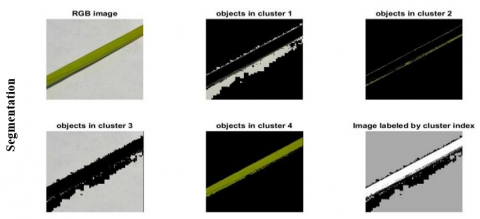
4.3 Image segmentation
The segmentation process then begins by identifying the region of interest in the preprocessed image. The process of image segmentation involves partitioning the image into its sub-sections. It is a particularly troublesome operation in image processing, as it often finds the desired objects. One of the most important steps in the segmentation process is background removal. There are various methods that can be used to segment the images of crop canopies. Some of these include learning-based, threshold-based, and color index-based segmentation [37]. In this step, we discussed the possible algorithms that can be used for this process. The segmentation process was performed using algorithms like Otsu's k-means clustering and the conversion of RGB images into the HIS model [38]. The use of k-means clustering can help minimize the noise. In this study, the method was used to classify the data collected by various clusters. K-means clustering is a process that involves identifying objects in an image by using a set of features that are related to a certain class. It then divides the image into four clusters. This method is useful in identifying the diseases that are present in the leaf image. In our experiments, we tested the number of clusters in an image. The best results were obtained when the cluster count increased [39].
4.4 Integrated GLCM and ILMFD feature extraction
A feature extraction process is a method that involves extracting the visual content of an image. It can be used to retrieve and index the various features of an image, such as its texture, shape, and color. The use of the versatile and powerful GLCM framework for machine learning and disease detection is increasing significantly. ILMFD is a multi-fractal dimension that is mainly used for capturing the rough texture and shape of 3D aggregates. After getting scale and rotation-independent features, a decision will be taken regarding rice disease recognition using the classifier [15, 40].
This integrated approach of both the feature extraction method presents a novel method that combines the capabilities of the ILMFD and the GLCM feature extraction techniques. It takes into account the optimal practices of both approaches and makes use of combined features to achieve better accuracy. This approach is designed to train the system to recognize and interpret the variance in rice leaf diseases. Experiments have shown that it is more efficient for large datasets.
4.5 Disease classification
The classification of rice crop diseases is carried out in this step. The extracted data set is then fed into the training program. The three different methods used for the classification are ANN, SVM, and Neuro-GA classifiers. The accuracy of the results is compared, and the training data set is used to feed the model.
4.5.1 Classification using ANN
One of the most common methods for learning and classifying is through the use of ANN. This method mimics the neurons of biological organisms. In a study, the ANN method was utilized to classify brown spot rice [41]. The ANN has a high prediction potential. To improve the efficiency and capacity of the disease prediction, a multi-layer neural network structure was created to train it. The network was composed of three layers: the input layer, the output layer, and the hidden layer [42]. The creation of the neural classifier model involved training various networks with varying parameters. The whole computing process was performed using the MATLAB R2018a programming language. The classification process was carried out using a feed-forward neural network. In this study, we utilized linear transfer functions to determine the activation of neurons at the output layer and nonlinear tangent-sigmoid transfer functions to study the activation of neurons in hidden layers of the network. ANN is a versatile framework that can be modified according to its varying weight [43].
4.5.2 Classification using Neuro-GA
GAs are efficient search methods that are based on the evolutionary process. They excel at tackling challenging combinatorial problems since they don't get stuck in the extremes of the search universe. Because of their superior performance, GAs have become popular alternatives to other classification methods [44]. Holland developed the GA algorithm. It is an optimization method that aims to find the most effective solution to a problem in a given set among the possible solutions. The goal of the GA algorithm is to mimic the natural selection and heuristic research processes used in the development of living things. It first constructs its initial population by randomly selecting individuals. The fitness function of the population is calculated by taking into account the various characteristics of each individual. After analyzing the data, the algorithm selects the fittest individuals based on the fit value. The population is then reconstructed using a mutation and cross-over process. The former produces individuals with higher fitness levels than those with low fitness. The latter, on the other hand, affects the structural attributes of the individuals to find the best solution [45].
A neuro-GA tool that can be used to solve problems related to optimization and search. It can perform a population-based analysis and improve the results by taking into account the various parameters of the ANN. For the current study, the initial population was generated using an ANN method, which included various functions and the number of variables that could be used in it [46]. The population size should be equivalent to the length of the chromosome. For our analysis, the population size was 24 bits.
GA Operations
A genetic algorithm (GA) is commonly utilized for solving optimization and search-related issues. It generates a population of possible outcomes by gathering a set of potential solutions. As we discussed, the ANN parameters were fed to a GA to improve the results. The algorithm takes into account the plant's region boundaries in the HSI space using a 24-bit binary string or chromosome. Each parameter on the chromosome has a fixed location. The relative locations of the various parameters are important in the selection of better-than-average combinations of parameters. These factors help the algorithms avoid breaking up successful combinations by ensuring that the features are located adjacent to each other. For instance, the string's upper boundary is the first byte of the chromosome's weed-sensing objective. The selection of the fittest individual through a local tournament rather than through roulette wheel selection was chosen to avoid problems in the early stages. The composition of offspring from a parent's genetic material is determined by mutation and crossover. A single-point crossover was utilized to generate new populations for each successive generation [47].
4.5.3 Classification using SVM
The classification process performed by an SVM is based on statistical learning theory. It uses a maximal margin classifier to evaluate the training vectors. Unlike other methods, this approach does not attempt to predict the distribution of training vectors. Instead, it tries to find suitable boundaries between the classes. A support vector machine (SVM) can be used to classify linearly-separable data by separating it into two distinct classes. The goal of the hyperplane is to ensure that it is as far from the data points of the classes as possible [48, 49].
The labeled dataset is presented in Eq. (1).
$\left( {{x}_{i}},~{{a}_{i}} \right),\ldots .\left( {{x}_{n}},~{{a}_{n}} \right)$ , ${{x}_{i}}\in {{R}^{d}}$ and ${{a}_{i}}\in \left( -1,+1 \right)$ (1)
The optimal hyper plane is computed by taking into account the features of the given dataset, namely, the class label ai and the feature vector xi.
The given Eq. (2) can be utilized to attain the ideal classical hyper plane.
$\text{w}{{\text{x}}^{\text{T}}}+\text{ }\!\!~\!\!\text{ b}=0$ (2)
The hyper plane is computed by using the input feature vector x and the weight vector w. These two vectors can satisfy the inequalities in the training set's various elements.
$\text{wx}_{\text{i}}^{\text{T}}+\text{b}\ge +1~~~~\text{ if } ~~{{\text{y}}_{\text{i}}}=1$ (3)
$\text{wx}_{\text{i}}^{\text{T}}+\text{b}\le -1~~~~\text{ if } ~~\text{ }{{\text{y}}_{\text{i}}}=-1$ (4)
A SVM approach is utilized to find the data’s weight w and bias b in order for the hyperplane to maximize its margin. In this space, a linear decision surface is built with unique properties that ensure the network's high generalization ability [50-52].
The information collected from the rice crop leaf images was gathered through the UCI repository [53]. It consists of 1488 healthy images and 523 brown spot disease images shown in Table 2. The system utilized various algorithms and devices to control and monitor the crops.
Table 3 shows the sample set of the features that were extracted using the GLCM feature extraction method. The sample set included in this table includes data on brown spot rice crop disease and healthy images. It is derived from the original dataset using various image processing techniques in the MATLAB tool. These features were then used to classify the data. In this process, a total of 10 different features were extracted from each dataset.
The same sample set of the features in Table 4 was extracted using the ILMFD feature extraction method. The sample set consists of brown spot rice crop disease and healthy leaf images. Here, we extracted a total of 52 features for the same set of data. The feature extraction shown in Table 3 using the GLCM method and in Table 4 shows the feature extraction using the ILMFD method for both the healthy leaves and the diseased leaves. Extracted features from both tables can be added using the matrix addition approach; here we get a total of 62 features, 10 from the GLCM method, and 52 from the ILMFD method, as shown in Figure 4.
Table 2. Rice leaf images dataset description
|
Description |
Counts |
|
Healthy leaves images |
1488 |
|
Unhealthy (Brown spot)isease leaves |
523 |
|
Total rice leaf images |
2011 |
Table 3. A set of data samples is presented for the analysis of the feature extracted using GLCM for rice crop with healthy and diseased
|
Total 10 Features Extracted Using GLCM for Brown Spot Rice Disease |
|||||||||||
|
S.N |
F1 |
F2 |
F3 |
F4 |
F5 |
F6 |
F7 |
F8 |
F9 |
F10 |
|
|
1 |
0.0005 |
0.999 |
0.99975 |
0.0410 |
1.71416 |
0.01466 |
0.19146 |
2.926556 |
0.9996 |
0.0005 |
|
|
2 |
0.007 |
0.99700 |
0.999042 |
0.0935 |
3.30778 |
0.01632 |
0.14836 |
10.81934 |
0.9998 |
0.007 |
|
|
3 |
0.0185 |
0.986551 |
0.9965 |
0.3431 |
6.96941 |
0.04537 |
0.47066 |
48.21527 |
0.9999 |
0.0185 |
|
|
4 |
0.003 |
0.99700 |
0.999167 |
0.0593 |
2.86016 |
0.00882 |
0.07921 |
8.094559 |
0.9997 |
0.003 |
|
|
5 |
0.01 |
0.99600 |
0.99875 |
0.0966 |
3.50501 |
0.01478 |
0.09728 |
12.07538 |
0.9998 |
0.01 |
|
|
6 |
0.016 |
0.99002 |
0.997146 |
0.4431 |
8.79809 |
0.04657 |
0.59027 |
76.96984 |
0.9999 |
0.016 |
|
|
7 |
0.01875 |
0.98407 |
0.995708 |
0.5896 |
10.3668 |
0.05702 |
0.74933 |
107.0303 |
0.9999 |
0.0187 |
|
|
8 |
0.0155 |
0.99450 |
0.998196 |
0.2161 |
5.60844 |
0.02829 |
0.30561 |
31.11323 |
0.9999 |
0.0155 |
|
|
9 |
0.006 |
0.99500 |
0.998667 |
0.2700 |
6.01230 |
0.03697 |
0.51346 |
35.97286 |
0.9999 |
0.006 |
|
|
10 |
0.0005 |
0.999 |
0.99975 |
0.0410 |
1.71416 |
0.01466 |
0.19146 |
2.926556 |
0.9996 |
0.0005 |
|
|
Feature Extracted Using GLCM for Healthy Leaves of Rice Crop |
|||||||||||
|
1 |
0.1425 |
0.88947 |
0.96875 |
2.2878 |
14.9017 |
0.34361 |
0.59869 |
111.073 |
0.99999 |
255 |
|
|
2 |
0 |
1 |
1 |
0.1887 |
4.75819 |
0.03074 |
0.11977 |
20.38143 |
0.99999 |
3 |
|
|
3 |
0.1165 |
0.88022 |
0.967917 |
2.6520 |
18.2436 |
0.34104 |
2.14899 |
325.9928 |
1 |
155 |
|
|
4 |
0.115 |
0.85959 |
0.962375 |
2.4286 |
16.4073 |
0.36780 |
2.36215 |
266.6453 |
0.99999 |
0 |
|
|
5 |
0.08625 |
0.92721 |
0.979813 |
1.4736 |
13.9275 |
0.18879 |
1.51397 |
191.7975 |
0.99999 |
255 |
|
|
6 |
0.0245 |
0.97421 |
0.993083 |
0.6223 |
9.09622 |
0.08130 |
0.97708 |
82.36429 |
0.99999 |
0 |
|
|
7 |
0.0525 |
0.93540 |
0.983292 |
1.3458 |
13.1196 |
0.18965 |
1.60675 |
170.9371 |
0.99999 |
0 |
|
|
8 |
0.0005 |
0.999 |
0.99975 |
0.3683 |
5.29206 |
0.07920 |
1.04346 |
27.97426 |
0.99999 |
0 |
|
|
9 |
0.11775 |
0.94148 |
0.982804 |
1.3158 |
14.8381 |
0.14259 |
1.27405 |
218.9623 |
0.99999 |
0 |
|
|
10 |
0.07825 |
0.93816 |
0.982979 |
1.1789 |
14.0865 |
0.12688 |
1.20511 |
197.4228 |
0.99999 |
0 |
|
Table 4. A set of data samples is presented for the analysis of the feature extracted using ILMFD for rice crop with healthy and diseased leaves
|
Total 52 Features Extracted Using ILMFD for Brown Spot Rice Disease |
||||||||||||||||||||
|
S.N |
F1 |
F2 |
F3 |
F4 |
F5 |
F6 |
F7 |
F8 |
F9 |
F10 |
||||||||||
|
1 |
0.0005 |
0.999 |
0.9997 |
0.15515 |
4.5260 |
0.02515 |
0.41070 |
20.4587 |
0.3488 |
0 |
||||||||||
|
2 |
0.005 |
0.99301 |
0.9981 |
0.52525 |
8.7958 |
0.07099 |
0.89196 |
77.2289 |
0.3213 |
0 |
||||||||||
|
3 |
0.016 |
0.97227 |
0.9933 |
0.81436 |
11.117 |
0.10428 |
1.00059 |
122.845 |
0.3256 |
255 |
||||||||||
|
4 |
0.006 |
0.98805 |
0.997 |
0.72327 |
10.172 |
0.10524 |
1.09282 |
103.172 |
0.5559 |
185 |
||||||||||
|
5 |
0.006 |
0.99102 |
0.9976 |
0.26396 |
5.9467 |
0.04597 |
0.36402 |
34.8532 |
0.5473 |
124 |
||||||||||
|
6 |
0.005 |
0.99003 |
0.9975 |
0.27326 |
6.1643 |
0.04380 |
0.40515 |
37.6451 |
0.1396 |
2 |
||||||||||
|
7 |
0.018 |
0.98655 |
0.996 |
0.35332 |
6.7925 |
0.05582 |
0.44202 |
45.3705 |
0.7837 |
21 |
||||||||||
|
8 |
0.0065 |
0.98656 |
0.9967 |
0.41941 |
6.9234 |
0.07678 |
0.75402 |
47.4886 |
0.8847 |
114 |
||||||||||
|
9 |
0.0095 |
0.98457 |
0.9965 |
0.35383 |
5.8615 |
0.07426 |
0.55037 |
33.6673 |
0.3332 |
0 |
||||||||||
|
10 |
0.0087 |
0.98308 |
0.9966 |
0.40155 |
6.3352 |
0.0859 |
0.66534 |
39.3286 |
0.3961 |
207 |
||||||||||
|
Features Extracted Using ILMFD for Healthy Leaves of Rice Crop |
||||||||||||||||||||
|
1 |
0.0267 |
0.97518 |
0.9935 |
0.493253 |
9.09651 |
0.055188 |
0.643071 |
82.3765 |
0.42277 |
0 |
||||||||||
|
2 |
0.004 |
0.99550 |
0.9989 |
0.160155 |
4.90642 |
0.02261 |
0.386399 |
24.0253 |
0.57241 |
0 |
||||||||||
|
3 |
0.0127 |
0.98062 |
0.9952 |
0.313644 |
7.23338 |
0.037411 |
0.445556 |
52.1008 |
0.10625 |
0 |
||||||||||
|
4 |
0.0005 |
0.999 |
0.9997 |
0.247294 |
5.95536 |
0.030662 |
0.438088 |
35.3839 |
0.02018 |
255 |
||||||||||
|
5 |
0.14 |
0.90389 |
0.9726 |
1.852485 |
17.9071 |
0.177251 |
1.673863 |
320.124 |
0.01917 |
0 |
||||||||||
|
6 |
0.186 |
0.91604 |
0.9742 |
1.888756 |
18.0805 |
0.182832 |
1.737525 |
326.814 |
0.02488 |
0 |
||||||||||
|
7 |
0.027 |
0.96784 |
0.9919 |
0.677268 |
10.7434 |
0.07184 |
0.900736 |
115.057 |
0.00562 |
0 |
||||||||||
|
8 |
0.0535 |
0.95414 |
0.9876 |
0.831909 |
11.4222 |
0.09478 |
0.866741 |
129.660 |
0.00661 |
0 |
||||||||||
|
9 |
0.336 |
0.82381 |
0.9454 |
3.795186 |
24.2740 |
0.379577 |
2.269724 |
580.471 |
0.00886 |
255 |
||||||||||
|
10 |
0.106 |
0.85865 |
0.961 |
2.30636 |
17.8277 |
0.259505 |
0.61789 |
228.951 |
0.01745 |
255 |
||||||||||
Figure 4. The combinational approach of the GLCM and ILMFD feature extraction method
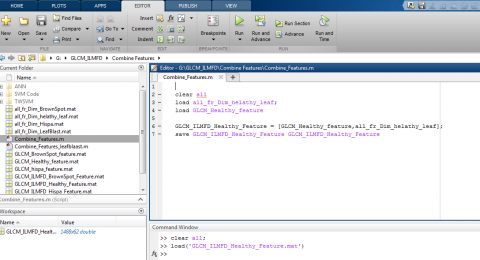
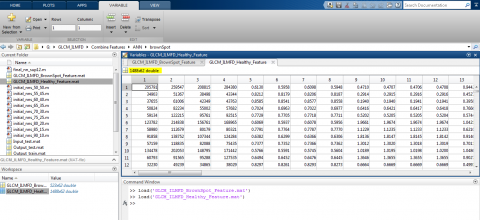
For healthy leaves of rice, we combined the features extracted using the GLCM method and the ILMFD method. Integrating the features of both methods gives a better result for extracting the dataset images. The use of an integrated approach between the extraction methods of the GLCM and the ILMFD is a novel concept. It takes into account the best practices of both methods and provides enhanced accuracy. Figure 5 shows the integrated approach of both the feature extraction methods. It integrates a total 62 features for the 1488 healthy leaves.
For the brown spot rice disease, an integrated feature extraction approach was used, combining both feature extraction methods. In this study, a total of 62 features were extracted: 10 from the GLCM method and 52 from the ILMFD method. Figure 6 shows the results of the features using an integrated approach for 523 brown spot rice diseases.
Figure 5. Integrated feature extraction method using GLCM and ILMFD method for healthy leaves
Figure 6. Integrated feature extraction method using GLCM and ILMFD method for brown spot disease
This work was tested with both healthy and diseased (brown spot) rice disease datasets. After the preprocessing of the sample dataset, the feature extraction process was then performed to get the classification results. The integrated methods of GLCM and ILMFD were used for feature extraction, and unhealthy (brown spot) diseases were classified with the help of the classification methods ANN, Neuro-GA, and SVM classifiers. The advantages of the integrated approach are its high degree of accuracy and versatility in comparison to ANN.
The first case of the test result was conducted using integrated GLCM and ILMFD with the ANN. The results of the test case were presented in Table 5, which is designed to simulate the process for classifying the accuracy of brown spot disease detection. The graph in Figure 7 shows the classification results of the study using the ANN framework. The result presented in the graph also highlighted the various performance measures that the ANN tool achieved. The second test case was performed using the integrated GLCM and ILMFD feature extraction methods with a Neuro-GA classifier. In this test case, based on the collected data, the classification model can predict the identity of a disease. The brown spot rice disease was first classified using the ANN model. We incorporated the GA tool with the ANN framework to improve the efficiency of the classification process. Different performance metrics had been calculated using the training and testing ratios. It is designed to simulate the process of identifying the exact features. The Neuro-GA model's accuracy and other performance metrics were then computed, as shown in Table 6.
The performance of the Neuro-GA tool shown in Figure 8 on different sets of parameters was also analyzed. We found that it performed better than ANN methods. This figure gives a hybrid model approach that can be used to classify brown spots on rice. They were evaluated using various criteria such as accuracy, recall, precision, and F1-score.
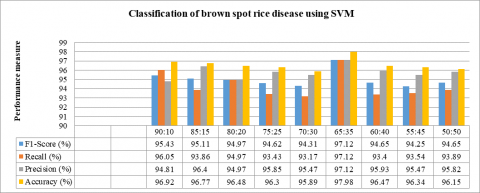
Finally, the SVM classification method was used to improve the accuracy of their classification result, as shown in Table 7. We found that the better tool was able to find more accurate results in comparison to the other classification methods shown in Figure 9.
The graph shown in Figure 10 compares the accuracy results between the ANN, Neuro-GA, and SVM classification models. The Neuro-GA hybrid intelligence classification model consists of ANN, and GA was developed to predict better accuracy than previous ANN models. SVM is a better method for classifying diseases than the ANN or Neuro-GA classification method. The entire framework for the classification process was tested in the popular programming language known as MATLAB. The results of this were impressive and showed that the proposed tool was more accurate than its previous work. The performance of this task was evaluated against the expectations and benchmarks set by the researcher. The output of this work was impressive. Overall, it demonstrated the efficiency and effectiveness of this process. The data gathered was impressive. The data used was impressive.
Table 5. Training and test dataset using integrated (GLCM & ILMFD) method with ANN
|
Training-Testing Ratio GLCM Using ANN |
Training Data |
Testing Data |
F1-Score (%) |
Recall (%) |
Precision (%) |
Accuracy (%) |
|
90:10 |
1810 |
201 |
91.25 |
85.17 |
97.88 |
86.436 |
|
85:15 |
1709 |
302 |
91.03 |
86.28 |
96.56 |
86.649 |
|
80:20 |
1609 |
402 |
92.88 |
86.36 |
98.89 |
86.932 |
|
75:25 |
1508 |
503 |
91.95 |
86.52 |
97.20 |
86.187 |
|
70:30 |
1407 |
604 |
92.74 |
87.69 |
97.54 |
86.883 |
|
65:35 |
1307 |
704 |
91.17 |
85.36 |
97.57 |
85.797 |
|
60:40 |
1206 |
805 |
91.86 |
84.42 |
98.31 |
85.581 |
|
55:45 |
1106 |
905 |
92.28 |
86.35 |
98.00 |
85.307 |
|
50:50 |
1005 |
1006 |
92.65 |
86.48 |
98.32 |
84.328 |
|
Average |
|
|
91.978 |
86.071 |
97.80 |
86.011 |
Table 6. Accuracy measure of rice leaf disease (brown spot) using Neuro-GA
|
Training-Testing Ratio GLCM Using Neuro-GA |
F1-Score (%) |
Recall (%) |
Precision (%) |
Accuracy (%) |
|
90:10 |
93.78 |
89.78 |
99.45 |
91.54 |
|
85:15 |
94.46 |
90.48 |
99.36 |
91.89 |
|
80:20 |
94.89 |
91.50 |
99.27 |
91.49 |
|
75:25 |
94.49 |
91.86 |
99.41 |
91.48 |
|
70:30 |
95.13 |
92.74 |
99.75 |
91.51 |
|
65:35 |
93.76 |
92.89 |
99.23 |
90.17 |
|
60:40 |
93.39 |
91.51 |
99.15 |
90.39 |
|
55:45 |
93.49 |
90.25 |
99.24 |
90.55 |
|
50:50 |
93.47 |
90.98 |
99.47 |
90.41 |
|
Average |
94.095 |
91.332 |
99.370 |
91.047 |
Table 7. Results using combine features of ILMFD_GLCM with SVM on dataset of brown spot rice disease
|
Training-Testing Ratio |
F1-Score (%) |
Recall (%) |
Precision (%) |
Accuracy (%) |
|
90:10 |
95.43 |
96.05 |
94.81 |
96.92 |
|
85:15 |
95.11 |
93.86 |
96.40 |
96.77 |
|
80:20 |
94.97 |
94.97 |
94.97 |
96.48 |
|
75:25 |
94.62 |
93.43 |
95.85 |
96.30 |
|
70:30 |
94.31 |
93.17 |
95.47 |
95.89 |
|
65:35 |
97.12 |
97.12 |
97.12 |
97.98 |
|
60:40 |
94.65 |
93.40 |
95.93 |
96.47 |
|
55:45 |
94.25 |
93.54 |
95.47 |
96.34 |
|
50:50 |
94.65 |
93.89 |
95.82 |
96.15 |
|
Average |
95.057 |
94.442 |
95.752 |
96.687 |
Figure 7. Classification of brown spot rice disease using ANN
Figure 8. Classification of brown spot rice disease using Neuro-GA
Figure 9. Classification of brown spot rice disease using SVM
Figure 10. Accuracy measure for different classification method
In this work, the integration of the extraction capabilities of the ILMFD method and the GLCM method is merged into a single solution. Enhancing efficiency and effectiveness can yield significant improvements. It considers the most advantageous aspects of both methodologies and exclusively utilizes qualities that are pertinent to the current task.
In this study, the integrated method of GLCM and ILMFD, along with the SVM classifier, attained an impressive accuracy rate of 96.68% when applied to the database. The accuracy of the other classification methods, ANN and Neuro-GA, is not high in contrast to SVM. This unique strategy is also really beneficial for identifying the precise problem. It enables us to promptly detect the disease and halt its future dissemination.
This novel method has demonstrated significant utility in promptly identifying diseases or extremely transmissible and perilous viral and bacterial infections that can impact plants and swiftly propagate to neighboring crops or plants.
The study relies on the database, and hence, improving efficiency and generalization is necessary. However, this shortcoming can be overcome through training the databases. The model currently lacks the incorporation of geographical variation or linkage among crop patterns, which is necessary for achieving future improvements in efficiency.
To effectively identify a particular pathogen, a comprehensive feature extraction and classification process is required. This step involves leveraging machine learning techniques and advanced data science tools. The deep dream (DD) method can make use of CNN's learned image modification feature in machine learning in the field of disease detection. It will allow us to develop and refine the classification method to find new pathogens more effectively. These include the ability to analyze huge amounts of information. The deep dream method is a powerful tool for identifying diseases that can be used in the classification process. Most of the time, the training dataset is not available for the classification of non-identified diseases. This issue can affect the detection of pathogens. This makes it difficult and affects the accuracy and classification results needed to identify the disease. The deep dream is a type of machine learning technique that employs a set of principles to perform specific tasks, such as forecasting future prevalence.
Integrated GLCM and ILMFD with SVM classifiers have derived the highest accuracy, so for other dataset development for crop disease identification, the same technique can be used for training and validation of the data sets.
The study can also be used for alternative crops; rice is an alternative crop to wheat and maize, so it needs to be entered into dedicated data sets, and the integrated GLCM and ILMFD with SVM classifier can be applied to the above crops in the future.
The above point provides the tip of the iceberg approach towards the underlying potential of the technique used in this study and hence paves a certain path for the further diversified adoption of this technique in the area of crop disease detection.
Disclosure of potential conflicts of interest - The authors declare that they have no known competing financial interests or personal relationships that could have appeared to influence the work reported in this paper.
Research involving Human Participants and/or Animals - The study was conducted entirely without the involvement of any human participants or animal.
Informed consent – NA.
[1] Farmer’s portal, CROP DESCRIPTION. https://farmer.gov.in/imagedefault/pestanddiseasescrops/rice.pdf, accessed on Nov. 11, 2023.
[2] He, D.C., Zhan, J.S., Xie, L.H. (2016). Problems, challenges and future of plant disease management: From an ecological point of view. Journal of Integrative Agriculture, 15(4): 705-715. https://doi.org/10.1016/S2095-3119(15)61300-4
[3] Tian, H., Wang, T., Liu, Y., Qiao, X., Li, Y. (2020). Computer vision technology in agricultural automation—A review. Information Processing in Agriculture, 7(1): 1-19. https://doi.org/10.1016/j.inpa.2019.09.006
[4] Habib, M.T., Majumder, A., Jakaria, A.Z.M., Akter, M., Uddin, M.S., Ahmed, F. (2020). Machine vision based papaya disease recognition. Journal of King Saud University-Computer and Information Sciences, 32(3): 300-309. https://doi.org/10.1016/j.jksuci.2018.06.006
[5] Benos, L., Tagarakis, A.C., Dolias, G., Berruto, R., Kateris, D., Bochtis, D. (2021). Machine learning in agriculture: A comprehensive updated review. Sensors, 21(11): 3758. https://doi.org/10.3390/s21113758
[6] Nigam, S., Jain, R. (2019). Plant disease identification using Deep Learning: A review. Indian Journal of Agricultural Sciences, 90(2): 249-257. https://doi.org/10.56093/ijas.v90i2.98996
[7] Florinabel, D.J. (2020). Real-time image processing method to implement object detection and classification for remote sensing images. Earth Science Informatics, 13(4): 1065-1077. https://doi.org/10.1007/s12145-020-00486-1
[8] Eunice, J., Popescu, D.E., Chowdary, M.K., Hemanth, J. (2022). Deep learning-based leaf disease detection in crops using images for agricultural applications. Agronomy, 12(10): 2395. https://doi.org/10.3390/agronomy12102395
[9] Temniranrat, P., Kiratiratanapruk, K., Kitvimonrat, A., Sinthupinyo, W., Patarapuwadol, S. (2021). A system for automatic rice disease detection from rice paddy images serviced via a Chatbot. Computers and Electronics in Agriculture, 185: 106156. https://doi.org/10.1016/j.compag.2021.106156
[10] Singh, A.K., Sreenivasu, S.V.N., Mahalaxmi, U.S.B.K., Sharma, H., Patil, D.D., Asenso, E. (2022). Hybrid feature-based disease detection in plant leaf using convolutional neural network, Bayesian optimized SVM, and random forest classifier. Journal of Food Quality, 2022: 2845320. https://doi.org/10.1155/2022/2845320
[11] Arianti, N.D., Saputra, E., Sitorus, A. (2023). An automatic generation of pre-processing strategy combined with machine learning multivariate analysis for NIR spectral data. Journal of Agriculture and Food Research, 13: 100625. https://doi.org/10.1016/j.jafr.2023.100625
[12] Kumar, G., Bhatia, P.K. (2014). A detailed review of feature extraction in image processing systems. In 2014 Fourth International Conference on Advanced Computing & Communication Technologies, Rohtak, India, pp. 5-12. https://doi.org/10.1109/ACCT.2014.74
[13] Ryszard, S.C. (2007). Image feature extraction techniques and their applications for CBIR and biometrics systems. International Journal of Biology and Biomedical Engineering, 1(1): 6-16.
[14] Gavhale, K.R., Gawande, U., Hajari, K.O. (2014). Unhealthy region of citrus leaf detection using image processing techniques. In International Conference for Convergence for Technology-2014, Pune, India, pp. 1-6. https://doi.org/10.1109/I2CT.2014.7092035
[15] Ahamad, M., Shahid, S. (2012). A new multi fractal dimension method for face recognition with fewer features under expression variations. International Journal on Computer Science and Engineering, 4(6): 1086.
[16] Mohanaiah, P., Sathyanarayana, P., GuruKumar, L. (2013). Image texture feature extraction using GLCM approach. International Journal of Scientific and Research Publications, 3(5): 1-5.
[17] Gajula Ramesh, D.D., Ramu, G. (2020). Detection of plant diseases by analyzing the texture of leaf using ANN classifier. International Journal of Advanced Science and Technology, 29(8): 1656-1664.
[18] Harakannanavar, S.S., Rudagi, J.M., Puranikmath, V.I., Siddiqua, A., Pramodhini, R. (2022). Plant leaf disease detection using computer vision and machine learning algorithms. Global Transitions Proceedings, 3(1): 305-310. https://doi.org/10.1016/j.gltp.2022.03.016
[19] Abusham, E.A. (2021). Image processing technique for the detection of Alberseem leaves diseases based on soft computing. Artificial Intelligence & Robotics Development Journal, 1(2): 103-115. https://doi.org/10.52098/airdj.202127
[20] Parikh, A., Raval, M.S., Parmar, C., Chaudhary, S. (2016). Disease detection and severity estimation in cotton plant from unconstrained images. In 2016 IEEE International Conference on Data Science and Advanced Analytics (DSAA), Montreal, QC, Canada, pp. 594-601. https://doi.org/10.1109/DSAA.2016.81
[21] Babu, R. (2019). Plant disease identification and classification using image processing depth resolution in non stationary thermal wave imaging using wavelet transform. International Journal of Engineering and Advanced Technology (IJEAT), 8(3S): 442-446.
[22] Jasim, M.A., Al-Tuwaijari, J.M. (2020). Plant leaf diseases detection and classification using image processing and deep learning techniques. In 2020 International Conference on Computer Science and Software Engineering (CSASE), Duhok, Iraq, pp. 259-265. https://doi.org/10.1109/CSASE48920.2020.9142097
[23] Jiang, F., Lu, Y., Chen, Y., Cai, D., Li, G. (2020). Image recognition of four rice leaf diseases based on deep learning and support vector machine. Computers and Electronics in Agriculture, 179: 105824. https://doi.org/10.1016/j.compag.2020.105824
[24] Chaudhary, S., Kumar, U. (2022). Analysis of methods of machine learning techniques for detection and classification of Brown spot (RICE) disease. Universal Journal of Agricultural Research, 10(5): 464-473. https://doi.org/10.13189/ujar.2022.100502
[25] Chaudhary, S., Kumar, U. (2023). An efficient approach for automated system to identify the rice crop disease using intensity level based multi-fractal dimension and twin support vector machine. Archives of Phytopathology and Plant Protection, 56(10): 806-834. https://doi.org/10.1080/03235408.2023.2222444
[26] Shrivastava, G., Patidar, H. (2022). Rice plant disease identification decision support model using machine learning. ICTACT Journal on Soft Computing, 12(3): 2619-2627. https://doi.org/10.21917/ijsc.2022.0375
[27] Prakash, R.M., Saraswathy, G.P., Ramalakshmi, G., Mangaleswari, K.H., Kaviya, T. (2017). Detection of leaf diseases and classification using digital image processing. In 2017 international conference on innovations in information, embedded and communication systems (ICIIECS), Coimbatore, India, pp. 1-4. https://doi.org/10.1109/ICIIECS.2017.8275915
[28] Toscano-Miranda, R., Toro, M., Aguilar, J., Caro, M., Marulanda, A., Trebilcok, A. (2022). Artificial-intelligence and sensing techniques for the management of insect pests and diseases in cotton: A systematic literature review. The Journal of Agricultural Science, 160(1-2): 16-31. https://doi.org/10.1017/S002185962200017X
[29] Wang, Y., Wang, H., Peng, Z. (2021). Rice diseases detection and classification using attention based neural network and Bayesian optimization. Expert Systems with Applications, 178: 114770. https://doi.org/10.1016/j.eswa.2021.114770
[30] Shah, J.P., Prajapati, H.B., Dabhi, V.K. (2016). A survey on detection and classification of rice plant diseases. In 2016 IEEE International Conference on Current Trends in Advanced Computing (ICCTAC), Bangalore, India, pp. 1-8. https://doi.org/10.1109/ICCTAC.2016.7567333
[31] Sarma, B.K. (2018). Integrated Disease Management. https://www.scribd.com/document/413025286/Integrated-Disease-Management, accessed on Feb. 20, 2018.
[32] Ngugi, L.C., Abelwahab, M., Abo-Zahhad, M. (2021). Recent advances in image processing techniques for automated leaf pest and disease recognition–A review. Information Processing in Agriculture, 8(1): 27-51. https://doi.org/10.1016/j.inpa.2020.04.004
[33] Hall-Beyer, M. (2017). GLCM Texture: A Tutorial v. 3.0 March 2017. University of Calgary. https://doi.org/10.11575/prism/33280
[34] Integrated Disease Management - 0 | PDF | Plant Pathology | Agriculture. (2022). Scribd. https://www.scribd.com/document/413025286/Integrated-Disease-Management.
[35] Arivazhagan, S., Shebiah, R.N., Ananthi, S., Varthini, S.V. (2013). Detection of unhealthy region of plant leaves and classification of plant leaf diseases using texture features. Agricultural Engineering International: CIGR Journal, 15(1): 211-217.
[36] Badiger, M., Kumara, V., Shetty, S.C., Poojary, S. (2022). Leaf and skin disease detection using image processing. Global Transitions Proceedings, 3(1): 272-278. https://doi.org/10.1016/j.gltp.2022.03.010
[37] Hamuda, E., Glavin, M., Jones, E. (2016). A survey of image processing techniques for plant extraction and segmentation in the field. Computers and Electronics in Agriculture, 125: 184-199. https://doi.org/10.1016/j.compag.2016.04.024
[38] Sethy, P.K., Barpanda, N.K., Rath, A.K., Behera, S.K. (2020). Image processing techniques for diagnosing rice plant disease: A survey. Procedia Computer Science, 167: 516-530. https://doi.org/10.1016/j.procs.2020.03.308
[39] Al-Hiary, H., Bani-Ahmad, S., Reyalat, M., Braik, M., Alrahamneh, Z. (2011). Fast and accurate detection and classification of plant diseases. International Journal of Computer Applications, 17(1): 31-38. https://doi.org/10.5120/2183-2754
[40] Mandelbrot, B.B., Wheeler, J.A. (1983). The Fractal Geometry of Nature. American Journal of Physics, 51(3): 286-287. https://doi.org/10.1119/1.13295
[41] Kurtulmus, F., Lee, W.S., Vardar, A. (2014). Immature peach detection in colour images acquired in natural illumination conditions using statistical classifiers and neural network. Precision Agriculture, 15: 57-79. https://doi.org/10.1007/s11119-013-9323-8
[42] Shahin, M.A., Tollner, E.W., McClendon, R.W., Arabnia, H.R. (2002). Apple classification based on surface bruises using image processing and neural networks. Transactions of the ASAE, 45(5): 1619-1627. https://doi.org/10.13031/2013.11047
[43] Srikanth, V., Rajesh, G.K., Kothakota, A., Pandiselvam, R., Sagarika, N., Manikantan, M.R., Sudheer, K.P. (2020). Modeling and optimization of developed cocoa beans extractor parameters using box Behnken design and artificial neural network. Computers and Electronics in Agriculture, 177: 105715. https://doi.org/10.1016/j.compag.2020.105715
[44] Inthachot, M., Boonjing, V., Intakosum, S. (2016). Artificial neural network and genetic algorithm hybrid intelligence for predicting Thai stock price index trend. Computational Intelligence and Neuroscience, 2016: 3045254. https://doi.org/10.1155/2016/3045254
[45] Kilicarslan, S., Celik, M., Sahin, Ş. (2021). Hybrid models based on genetic algorithm and deep learning algorithms for nutritional Anemia disease classification. Biomedical Signal Processing and Control, 63: 102231. https://doi.org/10.1016/j.bspc.2020.102231
[46] Lahiri, T., Kumar, U., Mishra, H., Sarkar, S., Roy, A.D. (2009). Analysis of ECG signal by chaos principle to help automatic diagnosis of myocardial infarction. Journal of Scientific & Industrial Research, 68: 866-870.
[47] Tang, L., Tian, L., Steward, B.L. (2000) Color image segmentation with genetic algorithm for in- field weed sensing. Transactions of the ASAE, 43(4): 1019-1027. https://doi.org/10.13031/2013.2970
[48] Wu, T., Bajwa, W.U. (2015). Learning the nonlinear geometry of high-dimensional data: Models and algorithms. IEEE Transactions on Signal Processing, 63(23): 6229-6244. https://doi.org/10.1109/TSP.2015.2469637
[49] Islam, M., Dinh, A., Wahid, K., Bhowmik, P. (2017). Detection of potato diseases using image segmentation and multiclass support vector machine. In 2017 IEEE 30th Canadian Conference on Electrical and Computer Engineering (CCECE), Windsor, ON, Canada, pp. 1-4. https://doi.org/10.1109/CCECE.2017.7946594
[50] Egmont-Petersen, M., de Ridder, D., Handels, H. (2002). Image processing with neural networks—A review. Pattern Recognition, 35(10): 2279-2301. https://doi.org/10.1016/S0031-3203(01)00178-9
[51] Basha, S.M., Rajput, D.S. (2019). Survey on evaluating the performance of machine learning algorithms: Past contributions and future roadmap. Deep Learning and Parallel Computing Environment for Bioengineering Systems, 153-164. https://doi.org/10.1016/B978-0-12-816718-2.00016-6
[52] Hofmann, T., Schölkopf, B., Smola, A.J. (2008). Kernel methods in machine learning. The Annals of Statistics, 36(3): 1171-1220. https://doi.org/10.1214/009053607000000677
[53] UCI Machine Learning Repository: Rice Leaf Diseases Data Set. (n.d.). Archive.ics.uci.edu. https://archive.ics.uci.edu/ml/datasets/Rice+Leaf+Diseases, accessed on December 18, 2022.