Rahul Saraswat*![]() | Deepak Jhanwar
| Deepak Jhanwar![]() | Manish Gupta
| Manish Gupta![]()
© 2024 The authors. This article is published by IIETA and is licensed under the CC BY 4.0 license (http://creativecommons.org/licenses/by/4.0/).
OPEN ACCESS
In the field of solar energy forecasting, the accurate prediction of photovoltaic (PV) system output remains a pivotal challenge. This study addresses this challenge through an innovative approach, employing sky image processing for the prediction of solar power energy production. Central to this approach is the utilization of the XG Boost Regressor, a machine learning algorithm renowned for its efficiency and accuracy. Unlike traditional methods such as Random Forest Regression, Gradient Boosting, K-Nearest Neighbors (KNN), and Support Vector Regression (SVR), the XG Boost Regressor demonstrated superior performance, evidenced by its lower Mean Squared Error (MSE). A key aspect of this study was the application of Principal Component Analysis (PCA) for dimensionality reduction within the sky image dataset. This technique effectively distilled the dataset to its most essential features, thereby enhancing the modeling process. The predictive model, based on images captured at regular intervals, was rigorously evaluated using several metrics, including Root Mean Squared Error (RMSE), Mean Absolute Error (MAE), relative absolute error (RAE), and relative squared error (RSE). The results were compelling, with the XG Boost Regressor achieving a RAE rate of 0.100121089, a MSE of 0.001425576, a MAE of 0.0019102173, and a root relative squared error (RRSE) of 0.146707803. These metrics underscore the model’s high accuracy in forecasting solar power energy. Additionally, the study incorporated RGB histograms for the extraction of dimensional features from the image data. This, coupled with the PCA for dimensionality reduction, formed a robust methodology for estimating solar energy output. The integration of the XG Boost Regressor and PCA not only facilitated accurate solar power energy predictions but also marked a significant advancement in the field of renewable energy forecasting. The findings from this research underscore the efficacy of the XG Boost Regressor and PCA in solar power prediction, offering a promising avenue for future developments in the renewable energy sector.
solar energy forecasting, XG Boost regression, Principal Component Analysis (PCA), sky image analysis, renewable energy, machine learning, photovoltaic (PV) system
Solar energy is acknowledged as one of the most sustainable and widely available forms of energy on the planet [1]. Its growing popularity in recent times can be attributed to its potential in reducing carbon emissions and serving as an alternative to traditional fossil fuels [2]. This form of energy, notable for its accessibility, can be harnessed in diverse ways, including PV panels, solar thermal collectors, and solar cookers [3]. However, despite its numerous advantages, solar energy remains significantly underutilized, primarily due to its intermittent nature and the challenges associated with predicting its availability. To overcome this hurdle, predictive models for solar power have been developed, aiming to accurately forecast solar power production [4]. Among these, the XG Boost Regressor stands out as a machine learning algorithm that has demonstrated high accuracy in solar power prediction [5]. The current research landscape in solar power prediction predominantly focuses on the effectiveness of individual machine learning models, revealing a notable gap in the exploration of ensemble techniques and the integration of varied data sources [6]. This gap in incorporating diverse data sources hampers progress towards more precise forecasting [7]. Furthermore, the scalability and generalizability of these models across different geographical locations and climates have not received adequate attention, a crucial aspect considering the global applicability of solar energy [8]. This limitation, impacting the flexibility of the models, poses a significant challenge in developing solar power forecast models that are universally applicable [9]. To address these challenges and advance the field, there is an urgent need for research that systematically explores ensemble techniques, integrates a variety of data sources, and assesses the scalability and generalizability of models. Filling these knowledge gaps is essential and will substantially contribute to the development of more robust and broadly applicable models. Such advancements are expected to lead to improvements in the accuracy and reliability of renewable energy predictions.
Solar energy is acclaimed for its environmental friendliness, cost-effectiveness, and long-term sustainability, positioning it as a viable solution to the global energy crisis. The potential of solar energy has been underscored in research, notably in studies existing literature which emphasize the significant role of solar power in fostering a cleaner and more sustainable energy future. However, existing models for solar power forecasting exhibit substantial limitations. Traditional statistical approaches, such as basic linear regression, often fail to capture the intricate interplay of various influencing factors. This shortfall is frequently attributed to the complexities posed by variables like weather patterns, atmospheric fluctuations, and regional variances [10]. These complexities impede the accuracy of forecasts, as current models struggle to encapsulate the dynamic and non-linear nature of these factors. Within the context of this research, the challenge of reliably predicting solar power energy is heightened due to the dynamic and non-linear interactions of these key components [11]. The application of machine learning techniques, particularly the XG Boost regressor, offers a promising avenue to enhance prediction accuracy. Additionally, the incorporation of novel data sources, such as sky imagery, provides a strategy to address the limitations of existing models. The synergy of machine learning with innovative data inputs has the potential to surmount the challenges inherent in solar power prediction, paving the way for more precise and reliable forecasting models.
The present study makes a significant contribution by employing the XG Boost regressor, integrated with PCA. This approach optimizes the model for enhanced efficiency in forecasting solar power, addressing the challenge of accurately estimating energy generation from solar panels. Factors such as sunlight intensity, weather conditions, and location are considered in the model. The effectiveness of this combined approach is demonstrated, not only in improving accuracy but also in ensuring the reliability of solar energy output predictions. Furthermore, this research offers valuable insights for stakeholders, aiding informed decision-making in solar power utilization and planning. By advancing the understanding of solar power prediction methodologies, this study lays the groundwork for more effective and reliable renewable energy forecasting.
The paper is structured as follows: Section 2 presents the related work in the prediction of solar energy. Section 3 provides the background of the XG Boost regressor and PCA. Section 4 describes the proposed methodology in detail. Section 5 presents the obtained results along with a discussion. Finally, the paper concludes in Section 6.
A considerable body of research has been dedicated to enhancing the understanding of solar power energy's potential and developing methods for more accurately predicting solar power energy output. Various methodologies have been explored in these studies. Zhang et al. [12] developed a solar power forecast model employing a combination of support vector machines and artificial neural networks. This model demonstrated efficacy in predicting solar energy output, achieving a mean absolute error of 0.3%. Chen et al. [13] utilized support vector machines in conjunction with random forests to create a solar power prediction model. This model yielded a mean absolute error of 0.2%, indicating its effectiveness in forecasting solar power energy output. Further, Munawar and Wang [14] applied the XG Boost regressor and PCA to predict solar power energy in the United States, using historical data on solar irradiance, temperature, and wind speed. The results indicated that the model had a prediction accuracy of 97.5%, with the XG Boost regressor successfully capturing the non-linear correlations between the characteristics and solar energy. Additionally, Nguyen et al. [15] employed Long Short-Term Memory (LSTM) models along with meteorological data to forecast the performance of PV systems. The findings showed that the LSTM models were capable of accurately predicting PV system output, evidenced by a mean absolute error of 3.5%. It was concluded that the combination of LSTM models with climatic data forms an effective method for solar power energy prediction.
The existing research on solar power prediction has largely focused on the effectiveness of individual machine learning models. However, there exists a significant research gap in the exploration of ensemble methods, particularly the integration of diverse models or the inclusion of additional data sources, to augment predictive accuracy. Moreover, there is a paucity of studies investigating the scalability and generalizability of these models across different geographical locations and climatic conditions. Addressing these gaps is crucial for advancing the development of more robust and universally applicable solar power prediction models, which would significantly enhance the accuracy and reliability of renewable energy forecasting.
This section provides a detailed background on the XG Boost regressor, PCA for dimensionality reduction, and RGB Histogram, which are pivotal in the context of solar power prediction.
3.1 XG Boost regressor
The XG Boost, an advanced machine learning technique based on gradient boosting, is highly effective in estimating solar power production with notable accuracy and efficiency. It excels in both classification and regression tasks [16]. The algorithm is particularly suited for solar power output prediction due to its proficiency in handling large datasets, its relative speed, and its effectiveness with datasets featuring non-linear relationships between input and output variables [17]. For effective solar power prediction using the XG Boost algorithm, access to relevant data is crucial. This data should encompass details such as the location of the solar installation, panel size, panel orientation, local weather conditions, and anticipated solar irradiance. Upon gathering the data, the XG Boost algorithm can be trained accordingly. Post-training, the algorithm can predict solar energy production for specific locations and times with precision [18]. This prediction capability is instrumental in determining the potential energy generation of solar installations and optimizing the utilization of solar energy.
3.2 PCA for dimensionality reduction
PCA is a linear dimensionality reduction technique that transforms a high-dimensional space of correlated properties into a low-dimensional space of uncorrelated characteristics, known as principal components [19]. These components are orthogonal linear transformations, aiming to capture the largest variance in the original data with the first component [20]. Being an unsupervised algorithm, PCA operates without considering class labels. The rationale for employing dimensionality reduction includes data compression to minimize storage requirements, acceleration of computations, elimination of redundant features, removal of correlated features, enhanced data visualization in reduced dimensions (2D or 3D), and noise reduction, thereby potentially improving model performance [21, 22].
3.3 RGB histogram
The RGB Histogram is an image processing technique where a color image is analyzed by counting the pixels in each of the three-color channels: red, green, and blue (RGB). This histogram is a graphical representation of the distribution of colors in an image, aiding in the identification of dominant colors and the overall content. It also measures the color balance, indicating the contribution of each channel to the image's overall color. To extract features using the RGB Histogram, each image is dissected into individual pixels, with each pixel characterized by three values corresponding to the RGB channels.
The primary goal of this study is to forecast solar energy output, employing a two-step process involving feature extraction and dimensionality reduction. Initially, an RGB histogram is utilized to extract features from image data, dissecting each image into a 254×254 pixel grid. This process generates a substantial number of dimensional features from each image. To manage and streamline these features, PCA is employed. PCA, a linear algebraic method, effectively reduces the dimensionality of the data. This dual approach of first expanding the feature set through the RGB histogram and then condensing it via PCA, ensures that essential information is retained while reducing complexity, thereby facilitating more accurate solar energy prediction.
PCA
PCA is a statistical technique employed to reduce the dimensionality of large data sets. By transforming high-dimensional data into a lower-dimensional space, PCA retains as much of the original variability of the data as possible. In the context of solar power prediction using sky images, PCA plays a crucial role in simplifying the complexity of the image data. By reducing the dimensionality of the image components, PCA makes the data more manageable and efficient for subsequent analysis.
Covariance Matrix
A key step in PCA is the computation of the covariance matrix (Σ) of the standardized feature matrix. The covariance matrix is pivotal as it captures the relationships and dependencies between different features. This matrix forms the foundation for identifying the principal components, which are the directions in the feature space that maximize the variance of the data.
$\sum=\frac{1}{m} \sum_{i=1}^m\left(x^{(i)}\right)\left(x^{(i)}\right)^T$ (1)
Eigenvalue Decomposition
The process begins with performing eigenvalue decomposition on the covariance matrix Σ, which yields a set of eigenvalues (λ) and corresponding eigenvectors. This step is crucial for identifying the principal components that capture the maximum variance in the data, a fundamental aspect of PCA.
$\sum \mu=\lambda \mu$ (2)
Dataset Description
In this research, the dataset comprises images of the sun captured using a Nikon camera with specifications mentioned in Table 1. Table 2 in the accompanying documentation provides a detailed view of these images, taken at various times, illustrating the sun's position and intensity.
Image Pre-processing
The collected images undergo a vital enhancement phase known as "pre-processing." This stage involves applying morphological transformations to the digital images to eliminate noise from the region of interest. Such refinement is pivotal in enhancing the accuracy of solar power prediction, as it ensures that the data fed into the model is of high quality and free from distortions that could skew the results.
RGB Histogram
The RGB histogram plays a significant role in the process of predicting solar power energy. It serves as a tool for representing the color distribution in an image through the Red, Green, and Blue color channels. The procedure involves counting the occurrences of various intensity levels within each channel and constructing a histogram to depict the frequency of these intensity levels. This histogram provides critical insights into the color composition of an image, which can be leveraged in image processing and computer vision applications. The formulation of the RGB histogram HRGB(i) for each color channel (i) is an integral part of this analysis, offering a granular view of the image’s color dynamics.
$H_{R G B}(i)=\frac{1}{N} \sum_{j=1}^N \delta\left(i-I_j\right)$ (3)
Table 1. Camera specifications
|
Brand |
Nikon |
|
Model Name |
D7500 |
|
Form Factor |
DSLR |
|
Effective Still |
20.9 MP |
|
Special Feature |
Special Effects Modes (Night Vision, Super Vivid, Pop, Photo, Illustration, Toy Camera Effect, Miniature Effect, Selective Colour) |
|
Optimal Zoom |
5 x |
|
Colour |
Black |
|
Screen Size |
3.2 Inches |
|
Photo Sensor Size |
APS-C fps |
|
Connector Type |
Bluetooth, Wi-Fi |
Table 2. Sun images in various times
|
S. No |
Morning Time Images |
Afternoon Time Images |
Evening Time Images |
|
1 |
|||
|
2 |
|||
|
3 |
In this study, a range of machine learning based predictive modeling techniques are employed for solar forecasting. Evaluating the effectiveness and precision of each model's forecasts is crucial. Performance metrics play a significant role as they directly impact the assessment of the model's prediction accuracy. The following metrics are used to calculate the error rate between the predicted values and actual observations:
(1) MAE
MAE measures the average magnitude of errors in a set of predictions, without considering their direction. It sums the absolute differences between predicted and actual outputs. MAE provides a straightforward measure of prediction error, but it does not differentiate between under forecasting and over forecasting. The calculation of MAE is outlined in the provided Eq. (1).
$M A E=\frac{1}{N} \sum_{i=1}^N\left|S W L_{F O R, i}-S W L_{O B S, i}\right|$ (4)
(2) RMSE
RMSE is computed as the square root of the average squared differences between the predicted and actual outputs. It is particularly useful when errors exhibit non-linearity. RMSE offers a reliable measure of the average magnitude of the prediction errors, as detailed in Eq. (2).
$R M S E=\sqrt{\sum_{i=1}^N \frac{\left(S W L_{F O R, i}-S W L_{O B S, i}\right)^2}{N}}$ (5)
(3) RAE
RAE compares the prediction error of the model with the residual or mean error of a naive model. It is expressed as a ratio, with a value less than 1 indicating that the proposed model outperforms the basic model. In the calculation of RAE, as shown in Eq. (3), "P" represents the predicted value, and "A" represents the actual value.
$R A E=\frac{\left[\sum_{i=1}^n\left(P_i-A_i\right)^2\right]^{\frac{1}{2}}}{\left[\sum_{i=1}^n A_i^2\right]^{\frac{1}{2}}}$ (6)
(4) RRSE
RRSE is the square root of the RSE, which contrasts the forecast error against the error of a naive model. RRSE is applicable in models where errors are measured across multiple units. The naive model typically uses the average of the actual values for prediction. In this context, "T" denotes the target value, while "P" represents the predicted output. The model is indicated by "I" and the record by "j". The subsequent equation illustrates the calculation of RRSE, providing an assessment of the magnitude error in the forecasted quantity.
$R S E_i=\frac{\sum_{j-1}^n\left(P_{i j}-T_j\right)^2}{\sum_{j-1}^n\left(T_j-T\right)^2}$ (7)
$\bar{T}=\frac{1}{n} \sum_{j=1}^n T_j$ (8)
In evaluating the performance of our solar power prediction model, a variety of performance metrics were utilized, as illustrated in the figures provided. These metrics, including RAE, MSE, and MAE, offer a multifaceted assessment of the model's precision and effectiveness in forecasting solar power energy, considering the selected features and methodologies.
Figure 1. RAE
In Figure 1, a comparative analysis of the RAE for various regression methods, including Random Forest Regression, Gradient Boosting, KNN, SVR, and our proposed XG Boost Regressor, is showcased. Notably, the XG Boost Regressor exhibits a relative absolute error rate of 0.100121089. This data distinctly highlights the XG Boost Regressor as having the lowest RAE among the evaluated methods, underscoring its superior accuracy in predicting solar power energy.
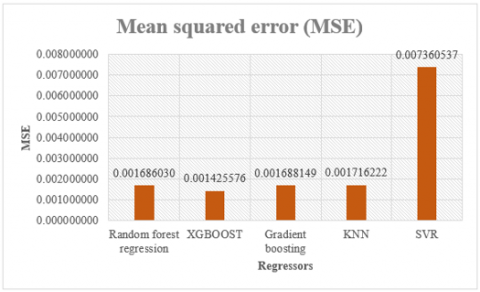
Figure 2. MSE
Figure 2 provides a clear comparison of the MSE across different regression methods used in solar power prediction. A critical observation from this graph is the outstanding performance of the XG Boost Regressor. It is noteworthy that the XG Boost Regressor achieves the lowest RAE, recorded at 0.001425576, which is significantly lower compared to the other methods included in the study. This comparison reveals that the Random Forest Regression, Gradient Boosting, KNN, and SVR all exhibit higher MSE when contrasted with the XG Boost Regressor.
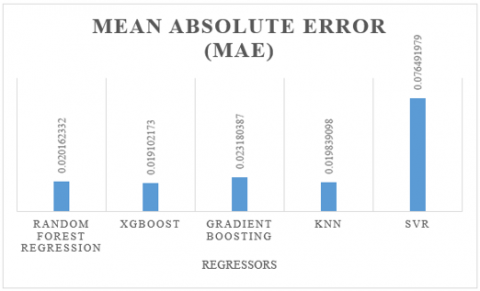
Figure 3. MAE
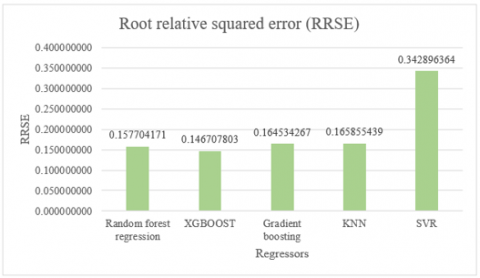
Figure 4. RRSE
Figure 3 provides an insightful comparison of the MAE for various machine learning methods used in solar power prediction, including Random Forest Regression, Gradient Boosting, KNN, SVR, and the proposed XG Boost Regressor. A key finding from this graphical representation is the performance of the XG Boost Regressor, which demonstrates a RAE rate of 0.0019102173. This rate is notably lower than those achieved by the other methods.
Figure 4 illustrates the RRSE for various regression techniques, including Gradient Boosting, KNN, SVR, Random Forest Regression, and the proposed method, XG Boost Regressor. A notable observation from this data is that the XG Boost Regressor exhibits the lowest root relative squared error, recorded at 0.146707803. This value is significantly lower than those associated with the other methods. This finding underscores the superior accuracy of the XG Boost Regressor in comparison to the other evaluated regression techniques, indicating that the proposed XG Boost Regressor method is the most precise for solar power prediction among the models tested.
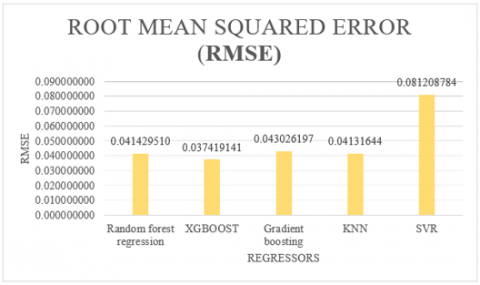
Figure 5. RMSE
Figure 5 displays the RMSE rates for a variety of regression methods, including Random Forest Regression, Gradient Boosting, KNN, SVR, and the XG Boost Regressor. From this data, it becomes evident that the XG Boost Regressor outperforms the other methods, achieving the lowest RMSE rate of 0.146707803. This result underscores the superior accuracy of the XG Boost Regressor in comparison to its counterparts. Therefore, based on this evidence, it can be confidently concluded that the XG Boost Regressor is the most effective and reliable option for regression tasks in the context of this study.
Figure 6. R-Squared
Figure 6 provides a comparative analysis of the R-squared errors for various regression methods, including the XG Boost Regressor, Random Forest Regression, Gradient Boosting, KNN, and SVR. Notably, the XG Boost Regressor exhibits the lowest R-squared error, recorded at 0.146707803. This outcome indicates a superior level of accuracy for the XG Boost Regressor relative to the other methods.
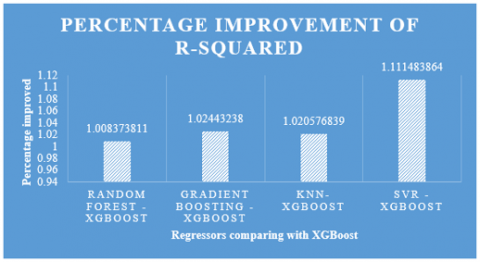
Figure 7. Percentage improvement of R-squared
Figure 7 showcases the percentage improvement in R-squared error across various regression methods, notably, the SVR-XG Boost method exhibits the most significant improvement in R-squared error, with a percentage increase of 1.11148. This notable enhancement in R-squared error for SVR-XG Boost, compared to other methods like Random Forest Regression, Gradient Boosting, and KNN, suggests its superior effectiveness in reducing prediction error and enhancing model accuracy.
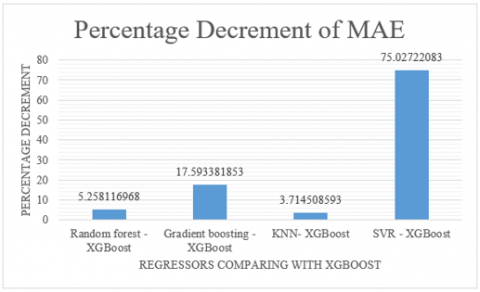
Figure 8. Percentage decrement of MAE
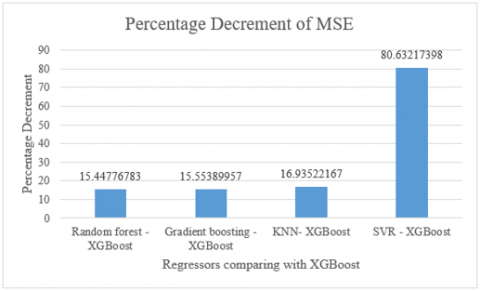
Figure 9. Percentage decrement of MSE
Figure 8 compares the percentage decrement in MAE across various regression methods, including KNN-XG Boost, Random Forest Regression, Gradient Boosting, and SVR. The data reveals KNN-XG Boost with the smallest percentage decrement in MAE at 3.714508, followed by Random Forest Regression at 5.258116, and Gradient Boosting at 17.593381. Notably, SVR shows the most significant decrease in MAE, with a percentage decrement of 75.027220. This indicates that while KNN-XG Boost has the least reduction in MAE, SVR significantly outperforms all other methods in minimizing prediction errors, demonstrating its superior efficacy in this aspect.
Figure 9 illustrates the percentage decrement in MSE for a variety of regression methods. Among these, Random Forest-XG Boost stands out with the highest reduction in MSE, registering a decrement of 15.447767. This is followed by SVR, Gradient Boosting, and KNN in terms of their respective decrements in MSE. Clearly, Random Forest-XG Boost surpasses the other methods in terms of reducing the Mean Squared Error, indicating its superior performance in this specific metric.
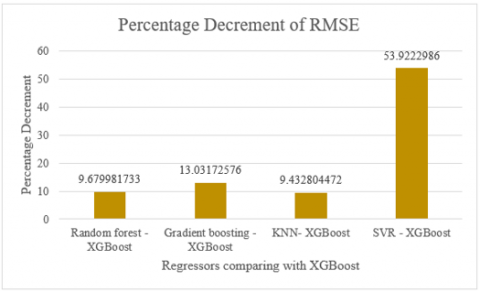
Figure 10 showcases the decrement in RMSE across various regression methods. In this analysis, KNN-XG Boost emerges as the leading approach with a significant RMSE decrement of 9.679981733. This is closely followed by the decrements observed in SVR, Gradient Boosting, and Random Forest Regression. The data clearly indicates that KNN-XG Boost outshines the other methods, demonstrating the most substantial reduction in RMSE and thereby yielding the most effective results among the evaluated approaches.
Figure 10. Percentage decrement of RMSE
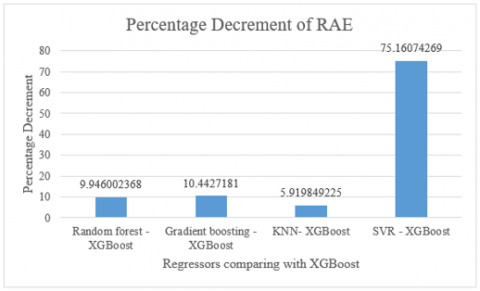
Figure 11. Percentage decrement of RAE
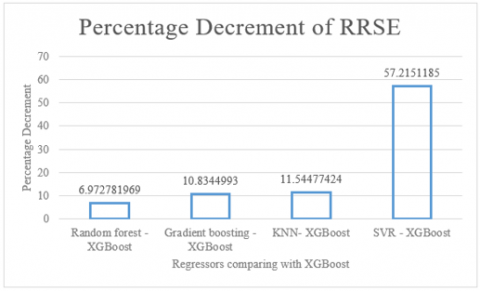
Figure 12. Percentage decrement of RRSE
Figure 11 highlights the decrement in RAE for various regression methods. From this data, it is observable that the KNN-XG Boost method registers the lowest decrement, marked at 5.919849225. This is followed by the decrements in SVR, Gradient Boosting, and Random Forest Regression. This trend in the data indicates that KNN-XG Boost has demonstrated superior performance compared to the other methods, achieving the most significant reduction in RAE and thus yielding the best results in terms of relative accuracy.
Figure 12 compares the decrement in RRSE among four different regression methods. Notably, Random Forest-XG Boost exhibits the lowest RRSE decrement, with a value of 6.972781969. This figure surpasses those of SVR, Gradient Boosting, and Random Forest. The data clearly indicates that Random Forest-XG Boost has achieved superior performance, outshining the other methods tested. Its lower decrement in RRSE demonstrates its effectiveness in reducing error rates, thereby making it the most successful approach among those evaluated in the study.
In the realm of PV system power output estimation, the integration of the XG Boost Regressor with PCA for dimensionality reduction has been demonstrated to be highly effective. This research utilized the RGB histogram for the extraction of a substantial quantity of dimensional features from image data. Subsequently, PCA was employed to adeptly reduce these features. It is highlighted that the linear algebraic approach of PCA facilitates automatic dimensionality reduction.
The findings of this study underscore the efficacy of combining the XG Boost Regressor with PCA in estimating the power production of solar systems. The performance metrics, including a relative absolute error rate of 0.100121089, a Mean Squared Error of 0.001425576, a mean absolute error of 0.0019102173, and a root relative squared error of 0.146707803, attest to the accuracy of the XG Boost Regressor as a predictive tool. These results significantly indicate that the XG Boost Regressor, complemented by PCA dimensionality reduction, stands as the most accurate method among those tested for predicting solar power energy.
In conclusion, the application of the XG Boost Regressor in conjunction with PCA has not only yielded precise predictions of solar energy output but also contributed to the advancement of methodologies in renewable energy forecasting. This approach sets a precedent for future research in the field, opening avenues for further exploration and refinement of predictive models in solar energy estimation.
[1] Carrera, B., Kim, K. (2020). Comparison analysis of machine learning techniques for photovoltaic prediction using weather sensor data. Sensors, 20(11): 3129. https://doi.org/10.3390/s20113129
[2] Kim, Y., Byun, Y. (2022). Predicting solar power generation from direction and tilt using machine learning XGBoost regression. In Journal of Physics: Conference Series, 2261(1): 012003. https://doi.org/10.1088/1742-6596/2261/1/012003
[3] Kamarouthu, P.S. (2020). Solar Irradiance Prediction Using Xg-boost With the Numerical Weather Forecast Doctoral dissertation, Utah State University.
[4] Aupke, P., Kassler, A., Theocharis, A., Nilsson, M., Andersson, I.M. (2022). Impact of clustering methods on machine learning-based solar power prediction models. In 2022 IEEE International Smart Cities Conference (ISC2), Pafos, Cyprus, pp. 1-7. https://doi.org/10.1109/ISC255366.2022.9922507
[5] Bae, D.J., Kwon, B.S., Song, K.B. (2021). XGBoost-based day-ahead load forecasting algorithm considering behind-the-meter solar PV generation. Energies, 15(1): https://doi.org/10.3390/en15010128
[6] Ferrero Bermejo, J., Gómez Fernández, J.F., Olivencia Polo, F., Crespo Márquez, A. (2019). A review of the use of artificial neural network models for energy and reliability prediction. A study of the solar PV, hydraulic and wind energy sources. Applied Sciences, 9(9): 1844. https://doi.org/10.3390/app9091844
[7] Sun, Y., Haghighat, F., Fung, B.C. (2020). A review of the-state-of-the-art in data-driven approaches for building energy prediction. Energy and Buildings, 221: https://doi.org/10.1016/j.enbuild.2020.110022
[8] Aslam, S., Herodotou, H., Mohsin, S.M., Javaid, N., Ashraf, N., Aslam, S. (2021). A survey on deep learning methods for power load and renewable energy forecasting in smart microgrids. Renewable and Sustainable Energy Reviews, 144: 110992. https://doi.org/10.1016/j.rser.2021.110992
[9] Hossain, M.A., Pota, H.R., Hossain, M.J., Blaabjerg, F. (2019). Evolution of microgrids with converter-interfaced generations: Challenges and opportunities. International Journal of Electrical Power & Energy Systems, 109: 160-186. https://doi.org/10.1016/j.ijepes.2019.01.038
[10] Mosavi, A., Salimi, M., Faizollahzadeh Ardabili, S., Rabczuk, T., Shamshirband, S., Varkonyi-Koczy, A.R. (2019). State of the art of machine learning models in energy systems, a systematic review. Energies, 12(7): 1301. https://doi.org/10.3390/en12071301
[11] Chen, C., Zuo, Y., Ye, W., Li, X., Deng, Z., Ong, S.P. (2020). A critical review of machine learning of energy materials. Advanced Energy Materials, 10(8): 1903242. https://doi.org/10.1002/aenm.201903242
[12] Zhang, W., Zhang, H., Liu, J., Li, K., Yang, D., Tian, H. (2017). Weather prediction with multiclass support vector machines in the fault detection of photovoltaic system. IEEE/CAA Journal of Automatica Sinica, 4(3): 520-525. https://doi.org/10.1109/JAS.2017.7510562
[13] Chen, J.X., Zhang, P.W., Mao, Z.J., Huang, Y.F., Jiang, D.M., Zhang, Y.N. (2019). Accurate EEG-based emotion recognition on combined features using deep convolutional neural networks. IEEE Access, 7: 44317-44328. https://doi.org/10.1109/ACCESS.2019.2908285
[14] Munawar, U., Wang, Z. (2020). A framework of using machine learning approaches for short-term solar power forecasting. Journal of Electrical Engineering & Technology, 15: 561-569. https://doi.org/10.1007/s42835-020-00346-4
[15] Nguyen, N.Q., Bui, L.D., Van Doan, B., Sanseverino, E. R., Di Cara, D., Nguyen, Q.D. (2021). A new method for forecasting energy output of a large-scale solar power plant based on long short-term memory networks a case study in Vietnam. Electric Power Systems Research, 199: 107427. https://doi.org/10.1016/j.epsr.2021.107427
[16] Avanijaa, J. (2021). Prediction of house price using xgboost regression algorithm. Turkish Journal of Computer and Mathematics Education (TURCOMAT), 12(2): 2151-2155. https://doi.org/10.17762/turcomat.v12i2.1870
[17] Patel, S.K., Surve, J., Katkar, V., Parmar, J., Al-Zahrani, F.A., Ahmed, K., Bui, F.M. (2022). Encoding and tuning of THz metasurface-based refractive index sensor with behavior prediction using XGBoost Regressor. IEEE Access, 10: 24797-24814. https://doi.org/10.1109/ACCESS.2022.3154386
[18] Jabreel, M., Moreno, A. (2018). EiTAKA at SemEval-2018 Task 1: An ensemble of n-channels ConvNet and XGboost regressors for emotion analysis of tweets. NAACL HLT 2018 - Int. Work. Semant. Eval. SemEval 2018 - Proc. 12th Work., 193–199. https://doi.org/10.48550/arXiv.1802.09233
[19] Salem, N., Hussein, S. (2019). Data dimensional reduction and principal components analysis. Procedia Computer Science, 163: 292-299. https://doi.org/10.1016/j.procs.2019.12.111
[20] Salo, F., Nassif, A.B., Essex, A. (2019). Dimensionality reduction with IG-PCA and ensemble classifier for network intrusion detection. Computer networks, 148: 164-175. https://doi.org/10.1016/j.comnet.2018.11.010
[21] Reddy, G.T., Reddy, M.P.K., Lakshmanna, K., Kaluri, R., Rajput, D.S., Srivastava, G., Baker, T. (2020). Analysis of dimensionality reduction techniques on big data. IEEE Access, 8: 54776-54788. https://doi.org/10.1109/ACCESS.2020.2980942
[22] Hasan, B.M.S., Abdulazeez, A.M. (2021). A review of principal component analysis algorithm for dimensionality reduction. Journal of Soft Computing and Data Mining, 2(1): 20-30. https://doi.org/10.30880/jscdm.2021.02.01.003