Minna Wang![]() | Jiajia Ma*
| Jiajia Ma*![]() | Xuan Zhao | Xin Xing
| Xuan Zhao | Xin Xing
© 2024 The authors. This article is published by IIETA and is licensed under the CC BY 4.0 license (http://creativecommons.org/licenses/by/4.0/).
OPEN ACCESS
In the realm of critical care, precise detection of physiological status and disease evaluation are paramount for effective treatment and nursing. With the continuous advancement of medical imaging technology, image processing techniques herald new possibilities for achieving these objectives. This study is dedicated to enhancing the automation level and accuracy of physiological status monitoring and disease evaluation for critical patients through cutting-edge image analysis technologies. The background section explores the current application of medical imaging in critical care, underscoring the significance and developmental trends of automated image processing in this domain. The state-of-the-art review highlights existing image segmentation and classification methods, addressing challenges encountered in complex critical care scenarios, such as insufficient segmentation precision and weak feature representation capabilities. To tackle these issues, a novel image segmentation approach based on boundary learning and enhancement (BLE), along with a disease severity classification model leveraging feature augmentation, is proposed. Through optimization of deep learning models, the segmentation part strengthens the identification of subtle boundaries in images depicting the physiological status of critical patients, thereby enhancing segmentation accuracy and robustness. In the aspect of disease classification, the study improves the model's ability to recognize features indicative of the patients' condition through feature enhancement techniques, leading to heightened classification precision. The application of these methodologies not only elevates the quality of care but also aids healthcare professionals in making more rapid and accurate decisions. The outcomes of this study hold significant implications for advancing the level of automation in physiological status monitoring and disease evaluation of critical patients, and they positively impact the further development of medical imaging technology in clinical applications.
medical imaging technology, critical care, physiological status detection, disease evaluation, image segmentation, feature enhancement, deep learning
With the rapid development of medical imaging technology, image processing has become an indispensable part of modern medicine [1-4]. Particularly in the field of critical care, the swift and accurate assessment of a patient's physiological status is vital for clinical decision-making [5, 6]. The integration of big data and artificial intelligence technologies has increasingly made image-based automatic detection and condition assessment a focus of research. The goal is to monitor patients' physiological signals in real time through efficient image analysis techniques, thereby providing more precise disease evaluations [7, 8].
The significance of related research is manifested in its ability to offer continuous, non-invasive, and real-time monitoring, which is especially crucial for the management of critically ill patients. Traditional methods for monitoring physiological status and assessing conditions rely on the experience of clinical doctors and regular manual checks, which are not only time-consuming and labor-intensive but also challenging to achieve 24-hour real-time monitoring [9-11]. Therefore, the development of automated image analysis tools can undoubtedly enhance the quality and efficiency of care, reduce the consumption of medical resources, and provide immediate feedback and treatment for patients [12, 13].
However, existing image processing methods still exhibit numerous deficiencies and limitations when confronted with the complex scenarios in critical care. On one hand, current technologies often struggle with the variability of patient conditions and the uncertainty of image quality in the segmentation of physiological state images, leading to insufficient accuracy and robustness [14-16]. On the other hand, in the classification of disease levels based on physiological signal images, existing models lack specificity and differentiation in feature expression, indicating that there is room for improvement in classification performance [17-20].
The main research contents of this study include two parts: firstly, the segmentation of critically ill patients' physiological state images based on boundary learning and boundary enhancement, which improves the quality of image segmentation through precise boundary recognition, thereby providing accurate foundational data for subsequent analysis. Secondly, the classification of critically ill patients' disease levels based on feature enhancement, which enhances the expression capability of disease features through improvements in deep learning models, thereby increasing classification accuracy. These studies not only promote the development of image processing technology in the field of critical care but also hold significant clinical application value. They can provide more precise monitoring and assessment for critically ill patients, thereby guiding clinical treatment.
In the current medical field, physiological state monitoring and disease evaluation of critically ill patients constitutes an essential component of therapeutic efforts. Given the rapid changes in the condition of such patients, conventional methods for physiological monitoring and assessment necessitate extensive manual operations and real-time surveillance, imposing significant demands on medical resources and professional healthcare personnel. The evolution of computer vision and image processing technologies has rendered the study of physiological state automatic detection and disease evaluation of critically ill patients through image processing highly valuable and promising. Real-time monitoring and automatic analysis of physiological images of critically ill patients enable the swift and accurate grasp of their physiological state, timely detection of changes in diseases, and provision of crucial information for clinical decision-making. Compared to traditional invasive monitoring methods, image-based monitoring approaches reduce patient discomfort and potential complications, enhancing patient comfort and acceptance. The automation of image processing and analysis diminishes reliance on professional healthcare personnel, facilitating the optimization of medical resource allocation and enhancing work efficiency.
Physiological images of critically ill patients typically encompass: a) Skin images for monitoring the wound healing process and changes in skin color (e.g., cyanosis); b) Vascular images for assessing the blood flow status in arteries and veins, monitoring for blockages or bleeding; c) Pupil images where variations in pupil size can indicate brain pathology or changes in the nervous system; d) Respiratory images for monitoring chest movement to evaluate respiratory rate and depth, crucial for assessing respiratory failure; e) Other images such as bedside ultrasound images, thoracic X-ray images, and electrocardiogram waveform images, which serve as vital data sources for evaluating the physiological state and condition of critically ill patients.
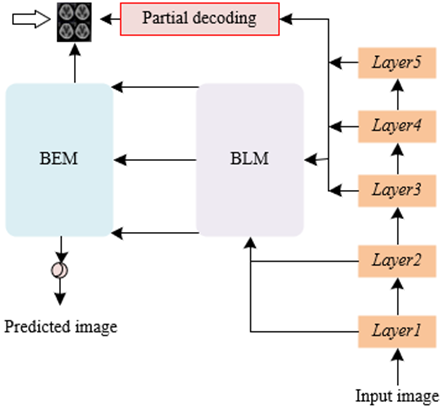
In addressing the practical needs of physiological state automatic detection and disease evaluation of critically ill patients, image segmentation technology plays a crucial role. In this context, an image segmentation method based on BLE network is proposed, with its principle illustrated in Figure 1. This method, designed specifically for identifying and processing images of the physiological state of critically ill patients, exhibits enhanced capabilities in capturing pathological features and refining precise boundaries compared to general image segmentation approaches. A U-shaped encoder-decoder structure is adopted, tailored to the specificity of the task of segmenting images related to the physiological state of critically ill patients. During the encoding phase, ResNeXt-101 is utilized as the backbone network, capable of extracting features across multiple levels, thereby capturing physiological information at various scales. These features are further processed through the boundary learning module (BLM), refined by a series of processing blocks, and merged in a bottom-up manner, aimed at generating features with stronger discriminative power beneficial for accurately identifying pathological areas. In the decoding phase, BLE-Net initially deploys a partial decoding module to integrate high-level features and roughly locate abnormal areas of physiological states, such as polyps, inflammation, or other pathological changes. Subsequently, under the guidance of features output by the partial decoding module, the boundary enhancement module (BEM), through cascaded boundary-aware attention blocks (BABs), progressively deepens the identification of ambiguous boundaries, generating refined features. This coarse-to-fine feature optimization process is particularly suited for handling images with unclear boundaries, such as those involved in monitoring vascular conditions or skin lesions. Finally, an upsampling operation adjusts the resolution to match that of the original input image, producing refined output features that are converted into the final prediction map via a Sigmoid function. This prediction map clearly delineates the areas of interest within the abnormal physiological state and their boundaries.
Figure 1. Schematic of the method for segmenting physiological state images in critically ill patients
2.1 Boundary learning
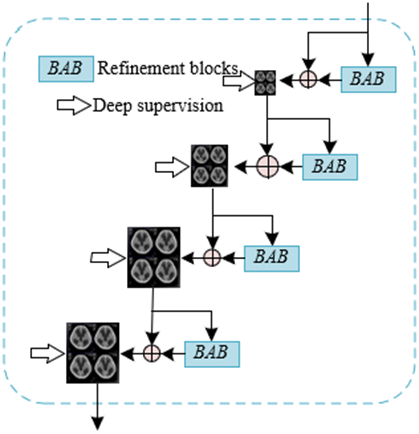
BLM aims to integrate low-level boundary information with high-level semantic information to produce feature representations that are rich in boundary detail and contain sufficient semantic content. This integration is crucial for addressing the common issues of blurred boundaries and complex backgrounds found in images depicting the physiological state of critically ill patients. Figure 2 illustrates the structural framework of the BLM. In the context of image segmentation for critically ill patient physiological states, images often encompass intricate physiological structures and pathological features. To this end, BLM initially leverages boundary information from low-level features, which, despite containing background noise, are rich in boundary details. Subsequently, these boundary details are fused into high-level semantic features in a bottom-up approach. Although high-level features are semantically more abstract and robust, they typically lack sufficient detail, resulting in unclear boundaries of pathological areas. To effectively combine these two levels of features and reduce noise interference from low-level features, BLM in BLE-Net employs refinement blocks with a residual structure. These refinement blocks, while enhancing boundary information, also suppress irrelevant background noise through their internal processing mechanisms, thereby improving the discriminative power of the features. Repeated integration of these refinement blocks further strengthens the boundary perception capabilities of the high-level features, allowing for the clear delineation of pathological area edges while preserving semantic information. The configuration mechanism of the refinement blocks, denoted as EY(∙), is characterized as follows:
${{R}_{i}}=\left\{ \begin{align} & EY\left( {{D}_{u}} \right),u=1 \\ & EY\left( {{D}_{u}} \right)+EY\left( {{D}_{u-1}} \right),2\le u\le 5 \\\end{align} \right.$ (1)
Figure 2. Structural framework of the BLM
2.2 Boundary enhancement
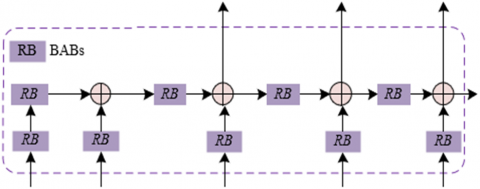
Blurred boundaries are a common issue in pathological images. This blurring may arise due to indistinct transitions between pathological regions and normal tissue, image quality issues, or the inherent complexity of physiological structures. Such blurred boundaries often result in initial prediction maps that lack precision, potentially leading to erroneous diagnostic and therapeutic decisions in the monitoring and assessment of critically ill patients. To tackle this issue, the BEM refines features progressively through a cascade of BABs. Each BAB focuses on capturing boundary-related features, enhancing boundary signals through an attention mechanism while suppressing irrelevant background, thereby improving the ability to localize blurred boundaries. This cascading structure facilitates a progressive optimization from coarse to fine, enhancing segmentation precision through multi-scale and multi-stage processing. Figure 3 presents the structural framework of the BEM. Unique challenges in segmenting images of critically ill patients' physiological states include handling subtle changes related to vital signs and identifying urgent and critical physiological information within unclear medical images. Thus, BEM is required not only to provide precise boundary detection but also to maintain robustness in poor-quality images and under conditions of ambiguous physiological information.
Figure 3. Structural framework of the BEM
Assuming the features from the decoding layer are denoted as Lu+1, discriminative features as Ru, spatial attention maps as Xu, sampling operations as ψ(∙), Sigmoid function as δ(∙), and threshold as S, the process of calculating Xu from Lu+1 by a BAB is expressed as follows:
${{X}_{u}}=1-\frac{\left| \delta \left( \psi \left( {{L}_{u+1}} \right)-S \right) \right|}{MAX\left( S,1-S \right)}$ (2)
Through Xu, the model's feature learning process is guided by the BAB, which further mines information on blurred boundaries. Assuming the enhanced features obtained through the above steps are denoted as Eu, and pixel-level multiplication as *, the calculation formula is as follows:
${{E}_{u}}=\left( {{R}_{u}}*{{X}_{u}}+{{R}_{u}} \right)*{{R}_{u}}$ (3)
The optimization of the output features of the BAB is achieved through residual learning. The following expression outlines the process of residual learning:
${{L}_{u}}=\psi \left( {{L}_{u+1}} \right)+{{E}_{u}}$ (4)
2.3 Loss function
In the BLE-Net, a deep supervision strategy is employed during the training process, meaning that the loss function is calculated not only at the final output layer but also at intermediate layers within the model. This approach compels the network to focus on accurate boundary information at deeper levels, enabling the final output layer to generate more precise segmentation results. Before the loss calculation for these intermediate layer features, an upsampling operation is performed to align their resolution with that of the original input image. This ensures that the loss function can compare the predicted results with the true labels on the same scale, allowing for a more accurate assessment of model performance. To further enhance the model's capability to capture details, pixel-wise location-aware loss is adopted. This loss combines weighted binary cross-entropy loss and weighted Intersection over Union (IoU) loss, providing finer supervision of the model's pixel-level predictions. The weighting mechanism adjusts the loss contribution according to the pixel's position in the image and its class, with a particular emphasis on higher weights for edge regions. This encourages the model to focus more on accurate segmentation of edge areas under the guidance of the loss function. Specifically, assuming the input image is represented by U∈EG×Q×3, the BLE-Net generates five features at the decoding stage, denoted as L7 and the optimized features {Lu|3≤u≤6}. The weighted binary cross-entropy loss MWB and weighted IoU loss MWI are employed to supervise each Lu. Assuming the ground truth is represented by H, the total loss function is expressed as follows:
$M=\sum\limits_{u=3}^{7}{\left( {{M}_{WB}}\left( {{L}_{u}},H \right)+{{M}_{WI}}\left( {{L}_{u}},H \right) \right)}$ (5)
Assuming the index of each pixel in the image is represented by j, with lj∈Lu, and hj∈H. The total number of pixels is denoted as V=G×Q. The binary labels are represented by m∈{0,1}. The indicator function is denoted as d (∙). The prediction probability is represented by O(lj=1). Let qj=(1+εβj)/εβj, and q′j=1+εβj, then the calculation formulas for MWB and MWI are as follows:
${{M}_{WB}}\left( {{L}_{u}},H \right)=-\sum\limits_{j=1}^{B}{{{q}_{j}}}\sum\limits_{m=0}^{1}{d}\left( {{h}_{j}}=m \right)\log O\left( {{l}_{j}}=m \right)$ (6)
${{M}_{WI}}\left( {{L}_{u}},H \right)=1-\frac{\sum\limits_{j=1}^{V}{\left( {{h}_{j}}\times {{l}_{j}} \right)\times {{{{q}'}}_{j}}}}{\sum\limits_{j=1}^{V}{\left( {{h}_{j}}+{{l}_{j}}-{{h}_{j}}\times {{l}_{j}} \right)\times {{{{q}'}}_{j}}}}$ (7)
βj is calculated through the pixel j and its surrounding area Ej, with the formula given as follows:
${{\beta }_{j}}=\left| \frac{\sum\limits_{k\in {{E}_{j}}}{{{h}_{k}}}}{\sum\limits_{k\in {{E}_{j}}}{1}}-{{h}_{j}} \right|$ (8)
In the critical care domain, accurate physiological state automatic detection and disease evaluation are crucial for timely and effective clinical decision-making. The focus is on the utilization of image processing techniques, combined with machine learning and deep learning methodologies, for the automatic detection of the physiological state of critically ill patients and the subsequent classification of their disease levels. This approach aids medical professionals in rapidly identifying the severity of diseases, facilitating precise monitoring and evaluation of patient states. The value of this research is twofold: firstly, it enhances the efficiency of disease monitoring, reducing errors associated with manual judgment; secondly, it enables more detailed and personalized disease management, offering tailored treatment plans for each patient.
A two-stage disease level classification method, based on feature enhancement, is designed for the physiological state automatic detection and disease evaluation of critically ill patients, effectively improving the model's diagnostic accuracy and granularity. The first stage employs a cascaded multi-task convolutional neural network (CNN) for the precise identification and localization of key physiological markers that influence disease evaluation, such as organ boundaries, areas of inflammation, or vascular conditions. The second stage introduces a feature-enhanced classification model that combines global and local feature fusion strategies, utilizing Residual Network34 (ResNet34) as the backbone network. This model captures not only global physiological information but also focuses on local detail features. In this classification model, a global attention module is embedded after the last convolutional layer to extract global semantics and contextual information, aiding the model's understanding of the overall condition and relationships within physiological images. Furthermore, near the fully connected layer, local feature maps of significant physiological markers are extracted, and through a local attention module, the feature learning of these key areas is intensified. This strategy of fusing local and global features enables the model to more accurately capture the subtle changes and complexities of critically ill patients' conditions, thereby achieving higher accuracy and reliability in disease level classification.
3.1 Localization of lesion areas
Inspired by the Multi-task CNN (MTCNN) method, an improved cascaded Multi-task CNN approach is proposed for the precise localization of lesion areas in the automatic detection of physiological state images and disease evaluation for critically ill patients. In the first-level network of lesion localization within physiological state images of critically ill patients, three convolution operations followed by a single max pooling are initially performed to extract basic features. This is succeeded by three additional convolution operations to further refine the features. The output of this stage of the neural network comprises two vectors: a one-dimensional vector indicating the presence of lesion areas within the image, and another four-dimensional vector providing preliminary coordinates for the candidate lesion area bounding boxes. In the second-level network, three convolution operations and max pooling commence the process, enhancing features transferred from the first-level network. This is followed by an additional convolution layer aimed at further refining features, subsequently linked to two fully connected layers. The output of the second-level network expands upon that of the first level: in addition to confirming the presence of lesions and the coordinates of the candidate lesion bounding boxes, a twelve-dimensional vector for six key physiological structures within the identified lesion area is added, representing two coordinates for each key point.
Assuming the number of training samples is denoted by V, the importance of the tasks of critically ill patient disease classification, lesion area bounding box regression of physiological state images, and key point localization are represented by βDE, βBO, and βKP, respectively. The cross-entropy loss for disease classification of critically ill patients, the Euclidean loss for lesion area bounding box regression of physiological state images, and the Euclidean loss for key point localization for the u-th sample are denoted as LODEu, LOBOu, and LOKPu, respectively. Thus, the overall training objective expression for the lesion area detection model of physiological state images is illustrated as follows:
$MIN\sum\limits_{u=1}^{V}{\left\{ {{\beta }_{DE}}LO_{u}^{DE}+{{\beta }_{BO}}LO_{u}^{BO}+{{\beta }_{KP}}LO_{u}^{KP} \right\}}$ (9)
3.2 Classification of lesion levels
In comparison with other image classification tasks, the classification of disease levels in critical illness poses more complex challenges, including, but not limited to, multi-organ involvement, diversity in disease presentation, and dynamic changes in acute lesions. In response to these challenges, the CNN ResNet34, renowned for its exceptional performance, is utilized as the foundational architecture for the classification model. To more effectively capture information critical to disease evaluation, both global and local attention modules are further integrated into the backbone network. The global attention module enables the network to focus on the global distribution across the entire physiological state image, while the local attention module directs the network's focus towards specific regions within the image that bear pathological significance. This method of fusing global and local features aids in the model's comprehensive understanding of the image content, automatically learning and emphasizing features that are decisive for disease evaluation. Furthermore, to enhance the model's capability to differentiate between various disease levels, a joint weighted loss function is proposed. Through a weighted combination of loss functions, the model, during its learning process, is tasked not only with reducing classification errors but also with enhancing its capacity for capturing and localizing features indicative of critical illness conditions.
3.2.1 Global attention module
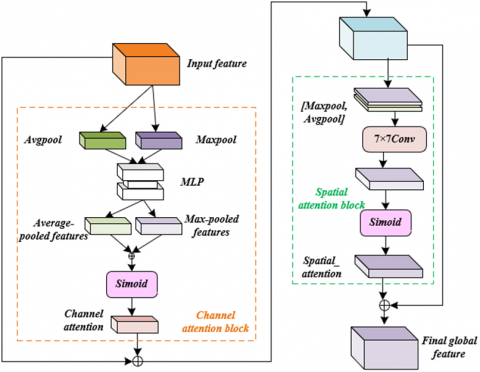
To better meet the requirements for physiological state automatic detection and disease evaluation of critical patients, a global attention module is introduced into the backbone network of ResNet34, aimed at enhancing the capture of subtle yet crucial physiological features, as depicted in Figure 4. This global attention module comprises two sub-modules: a channel attention module and a spatial attention module. These jointly act on the final convolutional layer of the network to bolster the extraction of semantic features crucial for classifying severity levels of critical conditions. Specifically, the channel attention module first receives output features D from the last convolutional layer of ResNet34, which contain deep semantic information of the image. To obtain channel-level attention, features D are processed through both max pooling and average pooling operations, aggregating spatial information of each feature map to produce max-pooled and average-pooled features, respectively. These features are then input into a shared multi-layer perceptron (MLP) with a hidden layer, which serves to further refine and enhance these features, resulting in enhanced max-pooled and average-pooled features. Subsequently, these enhanced features are fused by element-wise summation, and the fused features are processed through a Sigmoid activation function to calculate attention weights Qz for each channel. These weights represent the importance of each channel in disease evaluation, applied to the original features D to weight them, thereby highlighting the most crucial channel features. The features Dz, processed through the channel attention module, are then input into the spatial attention module, which further focuses on the most critical spatial areas of the image for disease determination, extracting the final global features Dh. These features not only contain rich physiological state information but are also adjusted and optimized according to the severity of the disease. Specifically, with element-wise summation denoted by ⨁, the Sigmoid function by δ, element-wise multiplication by $\otimes$, channel attention features by Dz, spatial attention weights by Qt, and max-pooled and average-pooled features by MP and AP respectively, the calculation formula is presented as:
${{D}_{z}}=D\otimes \delta \left( MLP\left( MP\left( D \right) \right)\oplus MLP\left( AP\left( D \right) \right) \right)$ (10)
Assuming the convolution kernel size is τ×τ, the global features Dh can be calculated through the following equation:
${{D}_{h}}={{D}_{t}}={{D}_{z}}\otimes \delta \left( CONV\ \tau \times \tau \left( \left[ MP\left( {{D}_{z}} \right);AP\left( {{D}_{z}} \right) \right] \right) \right)$ (11)
Figure 4. Structural framework of the global attention module
3.2.2 Local attention module
In the investigation of physiological state automatic detection and disease evaluation of critically ill patients, informed by specific medical prior knowledge, a local attention module has been developed with the aim of prioritizing the learning of key physiological features critical for disease evaluation. This module specifically focuses on detecting and precisely locating key regions of vital signs in critically ill patients. Within the context of intensive care, these key areas may include, but are not limited to, specific parts of the heart, lungs, areas of brain activity, or critical nodes within the vascular system. To achieve this objective, the module is designed to automatically learn key regions within images and, through feature enhancement techniques such as CNN in deep learning, extract detailed features of these regions. Subsequently, these key features are combined according to the classification needs of the disease level of critically ill patients, forming an accurate judgment of the severity of the disease. Compared to applications in other image classifications, this local attention module places greater emphasis on the analysis of complex physiological signals and the recognition and classification of abnormalities in vital signs. In the classification of severity levels of critical illness, the model is required not only to detect key medical image regions but also to understand their medical significance and how they interact to reflect the patient's physiological state and the severity of the disease. Specifically, each detected physiological state image lesion area is input into the ResNet34 network, assuming the top-left, top-right, bottom-left, and bottom-right coordinates of each local area in the originally detected physiological state image lesion area are represented by (aT_L,bT_L), (aT_R,bT_R), (aB_L,bB_L), and (aB_R,bB_R), respectively, and the corresponding coordinates in the global feature map are represented by $\left(\tilde{a}_{T L}, \tilde{b}_{T L}\right),\left(\tilde{a}_{T R}, \tilde{b}_{T R}\right),\left(\tilde{a}_{B L}, \tilde{b}_{B L}\right)$, and $\left(\tilde{a}_{B R}, \tilde{b}_{B R}\right)$, respectively, with the width and height of the originally located physiological state image lesion area represented by q and g, then the relationship between the features of each local area within the detected physiological state image lesion area and the global features is given by the following equations:
$\left( {{{\tilde{a}}}_{T\_L}},{{{\tilde{b}}}_{T\_L}} \right)=\left( \frac{{{a}_{T\_L}}}{\mu }\times \tau ,\frac{{{b}_{T\_L}}}{g}\times \tau \right)$ (12)
$\left( {{{\tilde{a}}}_{T\_R}},{{{\tilde{b}}}_{T\_R}} \right)=\left( \frac{{{a}_{T\_R}}}{\mu }\times \tau ,\frac{{{b}_{T\_R}}}{g}\times \tau \right)$ (13)
$\left( {{{\tilde{a}}}_{B\_L}},{{{\tilde{b}}}_{B\_L}} \right)=\left( \frac{{{a}_{B\_L}}}{\mu }\times \tau ,\frac{{{b}_{B\_L}}}{g}\times \tau \right)$ (14)
$\left( {{{\tilde{a}}}_{B\_R}},{{{\tilde{b}}}_{B\_R}} \right)=\left( \frac{{{a}_{B\_R}}}{\mu }\times \tau ,\frac{{{b}_{B\_R}}}{g}\times \tau \right)$ (15)
3.2.3 Loss function
In the domain of image classification tasks leveraging CNN, it is posited that the features of the u-th sample, belonging to the class bu, are denoted by au. With the batch size represented by l, the number of classes by z, the final fully connected layer's weights by Q, and bias by y, the expression for the cross-entropy loss function adopted is as follows:
$L{{O}_{C\_E}}=-\frac{1}{l}\sum\limits_{u=1}^{l}{\text{log}\frac{{{r}^{Q_{{{b}_{u}}}^{S}{{a}_{u}}+{{y}_{{{b}_{u}}}}}}}{\sum\nolimits_{k=1}^{z}{{{r}^{Q_{k}^{S}{{a}_{k}}+{{y}_{k}}}}}}}$ (16)
The objective of the disease level classification model for critically ill patients is to accurately categorize patients' physiological states into distinct disease levels. While cross-entropy loss functions guide the training of conventional CNN classification tasks, achieving the classification goal fundamentally, reliance solely on cross-entropy loss at times leads to significant dispersion within class features. That is, features of physiological state images within the same disease level vary widely. The model is desired to aggregate features of the same disease level more closely to reduce misclassification. To address this issue, a center loss function is introduced in the task of classifying disease levels in critically ill patients. This function aims to minimize the distance between features of samples within the same class, thus reducing intra-class variance while ensuring that features of different classes are more dispersed, thereby increasing inter-class variance. Specifically, a combination of cross-entropy loss and center loss is employed. Cross-entropy loss ensures good classification accuracy of the model, while center loss brings the features of physiological signals images of patients within the same disease level closer together in the feature space and increases the separation between different disease levels. This combined weighted loss function not only enhances the model's accuracy in recognizing the disease levels of critically ill patients but also forms a clearer separation of categories in the feature space, providing a more distinct feature boundary for subsequent disease evaluation.
Specifically, assuming the deep features of the u-th sample are denoted by au, and the feature center of class bu is represented by zbu, with the batch size denoted by l, the expression for the center loss function is given as follows:
$L{{O}_{CE}}=\frac{1}{2l}\sum\limits_{u=1}^{l}{\left\| {{a}_{u}}-{{z}_{{{b}_{u}}}} \right\|_{2}^{2}}$ (17)
Assuming the weight for balancing the cross-entropy loss function and the center loss function is denoted by η, the expression for the combined loss function is given by:
$LO=L{{O}_{C\_E}}+\eta L{{O}_{CE}}$ (18)
Table 1 presents the performance evaluation of various image segmentation methods applied to physiological state images of critically ill patients. The metrics utilized for this assessment include Mean Absolute Error (MAE), mean Dice (mDice) coefficient, mean IoU (mIoU), weighted F-measure, enhanced alignment index, and structural measure index. According to these metrics, the method proposed herein demonstrated superior performance across several key indicators. Specifically, the proposed method achieved or closely approached the best results in MAE (0.008), mDice (0.935), mIoU (0.874), weighted F-measure (0.923), enhanced alignment index (0.945), and structural measure index (0.987). Notably, it matched the optimal value in the structural measure index, while securing the highest rankings in MAE, mDice, mIoU, and weighted F-measure among all evaluated methods. These outcomes indicate that the image segmentation approach introduced, which focuses on BLE, significantly improves the segmentation quality of physiological state images of critically ill patients. Compared with other advanced segmentation methods, such as RCCNet and Res-UNet, the proposed method not only scored the highest in overall average performance (0.936) but also exhibited superior scores in almost all individual metrics, particularly in mDice and mIoU. This emphatically validates its effectiveness in enhancing the accuracy and reliability of image segmentation.
Table 1. Experimental results of physiological state image segmentation methods for patients with different severity levels
|
Method |
MAE |
mDice |
mIoU |
Weighted F-Measure |
Enhanced Alignment Index |
Structural Measure Index |
Average |
|
V-Net |
0.021 |
0.812 |
0.735 |
0.821 |
0.889 |
0.921 |
0.835(7) |
|
R2U-Net |
0.021 |
0.836 |
0.784 |
0.836 |
0.894 |
0.936 |
0.845(4) |
|
Nested-UNet |
0.021 |
0.834 |
0.774 |
0.798 |
0.895 |
0.935 |
0.846(5) |
|
tSFA |
0.022 |
0.798 |
0.798 |
0.785 |
0.824 |
0.854 |
0.789(8) |
|
hSFA |
0.023 |
0.812 |
0.732 |
0.789 |
0.874 |
0.924 |
0.841(6) |
|
RCCNet |
0.013 |
0.912 |
0.845 |
0.912 |
0.926 |
0.987 |
0.923(2) |
|
3D UNet |
0.041 |
0.712 |
0.612 |
0.635 |
0.789 |
0.887 |
0.732(9) |
|
ResUNet |
0.009 |
0.914 |
0.845 |
0.912 |
0.963 |
0.956 |
0.921(3) |
|
The method proposed in this study |
0.008 |
0.935 |
0.874 |
0.923 |
0.945 |
0.987 |
0.936(1) |
Table 2. Influence of BAB quantity on segmentation performance
|
Quantity |
Training Set |
Test Set |
||||||||
|
Skin Images |
Vascular Images |
Pupil Images |
Respiratory Images |
Ultrasonic Images |
||||||
|
mDice |
mIoU |
mDice |
mIoU |
mDice |
mIoU |
mDice |
mIoU |
mDice |
mIoU |
|
|
1 |
0.921 |
0.835 |
0.889 |
0.825 |
0.689 |
0.623 |
0.578 |
0.512 |
0.812 |
0.745 |
|
2 |
0.932 |
0.856 |
0.854 |
0.789 |
0.721 |
0.635 |
0.546 |
0.478 |
0.823 |
0.752 |
|
3 |
0.934 |
0.878 |
0.915 |
0.845 |
0.732 |
0.654 |
0.689 |
0.589 |
0.889 |
0.812 |
|
4 |
0.926 |
0.856 |
0.889 |
0.836 |
0.725 |
0.635 |
0.612 |
0.548 |
0.878 |
0.815 |
Table 3. Ablation study results on physiological state image segmentation methods for critically ill patients
|
Model Variant |
Backbone Network |
+Boundary Learning |
+Partial Decoding |
+Boundary Enhancement |
||
|
Module |
Boundary learning |
|
√ |
|
|
|
|
Partial decoding |
|
|
√ |
|
||
|
Boundary enhancement |
|
|
|
√ |
||
|
Training set |
Skin images |
mDice |
0.895 |
0.925 |
0.912 |
0.936 |
|
mIoU |
0.935 |
0.945 |
0.845 |
0.845 |
||
|
Vascular images |
mDice |
0.884 |
0.879 |
0.912 |
0.879 |
|
|
mIoU |
0.812 |
0.823 |
0.835 |
0.835 |
||
|
Test set |
Pupil images |
mDice |
0.711 |
0.721 |
0.714 |
0.689 |
|
mIoU |
0.615 |
0.623 |
0.623 |
0.624 |
||
|
Respiratory images |
mDice |
0.612 |
0.623 |
0.678 |
0.645 |
|
|
mIoU |
0.524 |
0.532 |
0.589 |
0.578 |
||
|
Ultrasonic images |
mDice |
0.854 |
0.874 |
0.879 |
0.889 |
|
|
mIoU |
0.785 |
0.812 |
0.812 |
0.823 |
||
|
Model Variant |
+Boundary Learning + Partial Decoding |
+Boundary Learning + Boundary Enhancement |
+Partial Decoding + Boundary Enhancement |
Complete Model |
||
|
Module |
Boundary learning |
√ |
√ |
|
√ |
|
|
Partial decoding |
√ |
|
√ |
√ |
||
|
Boundary enhancement |
|
√ |
√ |
√ |
||
|
Training set |
Skin images |
mDice |
0.925 |
0.914 |
0.923 |
0.926 |
|
mIoU |
0.879 |
0.856 |
0.889 |
0.878 |
||
|
Vascular images |
mDice |
0.912 |
0.875 |
0.912 |
0.913 |
|
|
mIoU |
0.845 |
0.821 |
0.845 |
0.854 |
||
|
Test set |
Pupil images |
mDice |
0.723 |
0.725 |
0.724 |
0.725 |
|
mIoU |
0.635 |
0.638 |
0.645 |
0.658 |
||
|
Respiratory images |
mDice |
0.635 |
0.658 |
0.678 |
0.678 |
|
|
mIoU |
0.574 |
0.598 |
0.589 |
0.589 |
||
|
Ultrasonic images |
mDice |
0.898 |
0.874 |
0.898 |
0.874 |
|
|
mIoU |
0.841 |
0.815 |
0.856 |
0.845 |
||
An investigation was conducted into the effect of varying quantities of BABs on the segmentation performance across different types of medical images, as detailed in Table 2. It can be observed that, in the majority of cases, an increase in the number of BABs tends to enhance performance metrics, notably mDice and mIoU. Specifically, for skin and vascular images, a significant improvement in both mDice and mIoU is noted as the quantity of BABs increases from one to three. For instance, the mDice for vascular images escalates from 0.889 to 0.915, while the mIoU rises from 0.825 to 0.845, indicating the effectiveness of the methodology. Similarly, enhancements in segmentation performance for pupil, respiratory, and ultrasonic images are also observed with the increment in the number of BABs. Notably, in the segmentation of respiratory images, the mDice and mIoU metrics jump from 0.578 and 0.512 to 0.689 and 0.589, respectively. However, when the number of BABs increases to four, except for a slight improvement in the mIoU for ultrasonic images, no significant enhancement, or even a reduction, in performance metrics is observed for the other types of images. This could possibly be attributed to overfitting or unnecessary parameter complexity introduced by an excess of BABs. In summary, BABs play a crucial role in enhancing the performance of segmentation for critical patient physiological state images. Optimal enhancement in the model's ability to perceive image boundaries, thereby improving segmentation accuracy, is particularly evident when the number of blocks is moderate (e.g., three). This effect is significantly confirmed through the notable improvements in the segmentation of vascular and respiratory images.
Table 3 delineates the outcomes of ablation experiments conducted on physiological state image segmentation methods for critical patients under various configurations. Through the comparison of model variants, the impact of the BLM, partial decoding module, and BEM, whether applied individually or in combination, on segmentation performance is observed. For instance, on skin images, the introduction of the BLM elevated the mDice from 0.895 to 0.925, highlighting the significant improvement in performance attributable to boundary learning. Furthermore, the combination of BLE resulted in an increase in mIoU for pupil images from 0.615, with the backbone network alone, to 0.638, underscoring the complementary and synergistic effects of these modules. The complete model exhibited robust performance across all types of images, indicating that while individual modules can enhance performance for specific tasks, the integrated application of modules is crucial for achieving optimal segmentation outcomes. Based on the results of the ablation experiments, it is concluded that the physiological state image segmentation method for critical patients, proposed in this work and based on BLE, is effective. The integration of different modules not only improved the quality of segmentation but also demonstrated the model's scalability and flexibility. Especially notable is the superior segmentation performance displayed by the complete model across all tested image types, further validating the importance of the collaborative function of the various modules.
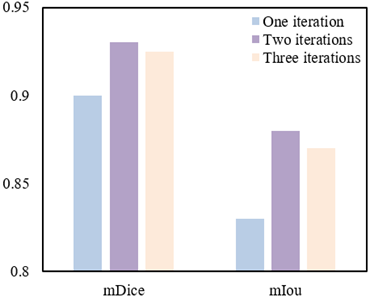
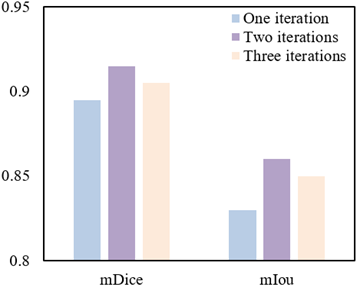
In the exploration of the impact of iteration quantity on segmentation performance, it can be observed from Figure 5 that, on the training dataset, segmentation performance significantly improves with an increase in iteration quantity. Specifically, when the iteration quantity raises from one to two, mDice improves from 0.9 to 0.93, and mIoU increases from 0.83 to 0.88. However, a further increment of iteration quantity to three results in a slight decline in performance, with mDice decreasing to 0.925 and mIoU to 0.87. A similar trend is noted on the testing dataset, where mDice and mIoU reach their peak values of 0.915 and 0.86, respectively, at two iterations. Yet, akin to the training set, a marginal reduction in performance is observed upon increasing iterations to three. These outcomes suggest that the model potentially achieves optimal generalization capability at two iterations. It can be concluded that the proposed method for segmenting physiological state images of critically ill patients demonstrated its efficacy and stability across different iteration quantities, particularly achieving optimum segmentation performance on both the training and testing datasets at two iterations. This reveals that within the given experimental setup, increasing iteration quantity enhances the model's learning capability, yet poses the risk of overfitting, leading to a decline in performance beyond a certain point. Hence, the method advocated in this study can optimize the model's generalization performance through the selection of an appropriate iteration quantity.
(a) Training set
(b) Test set
Figure 5. Impact of Iterations on segmentation performance
Table 4. Comparative accuracy of lesion localization methods for different physiological state images
|
Region No. |
HOG+RF |
FCN |
The Proposed Method |
|
1 |
71.26(81.25%) |
84.26(98.23%) |
85.69(98.36%) |
|
2 |
71.21(83.26%) |
82.16(98.36%) |
82.31(98.69%) |
|
3 |
67.59(92.36%) |
71.26(98.25%) |
73.26(98.36%) |
|
4 |
71.26(81.25%) |
71.26(81.25%) |
71.26(81.25%) |
|
5 |
67.56(91.25%) |
71.26(98.69%) |
71.32(99.36%) |
|
6 |
66.35(97.48%) |
67.59(98.69%) |
68.36(99.21%) |
|
7 |
31.24(98.57%) |
33.24(98.36%) |
32.47(100%) |
|
8 |
32.54(98.36%) |
34.56(98.69%) |
31.25(100%) |
|
9 |
41.23(92.31%) |
43.26(98.23%) |
44.56(99.36%) |
Table 4 presents a comparative analysis of the accuracy of different methods for localizing lesions in various physiological state images. It is demonstrated that the method proposed in this study surpasses the accuracy of both Histogram of Oriented Gradient+Random Forest (HOG+RF) and Fully Convolutional Network (FCN) across the majority of the areas analyzed. Notably, in terms of accuracy, the proposed method achieved or exceeded a high accuracy of 98.36% across all areas, indicating an exceptionally high precision in lesion localization. For instance, in area 1, an accuracy of 85.69% was recorded for the proposed method, marginally higher than the 84.26% achieved by FCN and significantly surpassing the 71.26% accuracy of HOG+RF. In areas 7 and 8, although the numerical accuracy of the proposed method was not the highest, an accuracy of 100% was reached, indicating perfect localization of lesions within these areas by the proposed method. Overall, the proposed method exhibited superior performance in the task of localizing lesions in images of various physiological states, outperforming traditional methods and FCN not only in numerical accuracy but also in demonstrating its robustness and high reliability through accuracy. These findings underscore the efficacy of the proposed feature enhancement-based method for classifying the disease levels of critically ill patients, confirming that enhancing the expressiveness of disease features through improvements in deep learning models can significantly increase the precision of lesion localization.
Table 5. Performance comparison of disease level classification methods for critically ill patients
|
Method |
Top Accuracy |
Kappa |
MSE |
|
MTCNN |
61.23% |
0.7569 |
0.7548 |
|
Attention U-Net |
71.58% |
0.8312 |
0.4562 |
|
The proposed method |
75.36% |
0.8759 |
0.3654 |
Table 5 offers a comparative analysis of the performance of different methods for classifying the disease levels of critically ill patients. The method introduced in this study surpasses the comparative approaches, MTCNN and Attention U-Net, in performance metrics relevant to the classification of disease levels in critically ill patients. Specifically, a top accuracy of 75.36% is achieved by the introduced method, demonstrating a significant improvement over the 61.23% and 71.58% achieved by MTCNN and Attention U-Net, respectively. In terms of the Kappa coefficient, a higher consistency is observed with a value of 0.8759, compared to 0.7569 for MTCNN and 0.8312 for Attention U-Net. Moreover, the introduced method exhibits superior performance in mean square error (MSE), recorded at 0.3654, significantly lower than the 0.7548 for MTCNN and 0.4562 for Attention U-Net. These metrics collectively reflect the comprehensive performance of the introduced method in terms of classification accuracy, consistency, and prediction error. Considering the performance data from Table 5, it can be concluded that the feature enhancement-based deep learning model introduced in this study demonstrates significant efficacy in the task of classifying the disease levels of critically ill patients. The improved model is capable of more accurately expressing the features of diseases, surpassing existing methods in classification accuracy, consistency of predictions, and error control. The higher top accuracy indicates an enhanced ability of the model to classify, a higher Kappa value suggests better consistency and reliability, while a lower MSE value reflects the precision and stability of the model in predictions.
Table 6 presents the results of ablation experiments that clearly demonstrate the performance enhancements achieved by the method introduced in this study through the sequential incorporation of different components. The backbone network alone achieved a top accuracy of 73.26%, indicating robust foundational classification capabilities. The inclusion of a local attention mechanism increased the model's top accuracy to 74.23%, with the Kappa value rising from 0.8547 to 0.8695, and the MSE decreasing from 0.4123 to 0.3569. This indicates the efficacy of the local attention mechanism in enhancing the model's ability to recognize detailed disease features. Further incorporation of a global attention mechanism resulted in a top accuracy of 75.48%, with the Kappa value increasing to 0.8795 and the MSE further reducing to 0.3458. This improvement underscores the importance of the global attention mechanism in capturing overall disease features. The complete model, integrating all aforementioned enhancements, achieved the highest top accuracy (75.69%), Kappa (0.8796), and the lowest MSE (0.3356), collectively confirming that each step of improvement positively contributes to the overall performance of the model. The ablation study results explicitly indicate that each component of the method for classifying disease levels of critically ill patients proposed in this study is beneficial. When used in combination, these components synergize to further enhance the model's classification performance. The integration of a local attention mechanism improved the model's sensitivity to local features, whereas the inclusion of a global attention mechanism optimized the grasp of overall disease features. The performance of the complete model surpasses that of any single component or partial combination, validating the crucial role of feature enhancement in the classification of critical diseases. Through this series of component and mechanism enhancements, the method showcased in this study exhibits exceptional performance in the task of disease level classification, establishing its potential and efficacy as a tool for clinical decision support.
Table 6. Ablation study results of disease level classification methods for critically ill patients
|
Model Variant |
Top Accuracy |
Kappa |
MSE |
|
Backbone network |
73.26% |
0.8547 |
0.4123 |
|
+Local attention mechanism |
74.23% |
0.8695 |
0.3569 |
|
+Local and global attention mechanisms |
75.48% |
0.8795 |
0.3458 |
|
Complete model |
75.69% |
0.8796 |
0.3356 |
Significant progress has been made in the field of critical care medical image processing and analysis, encompassing two primary aspects: high-quality segmentation of images depicting patients' physiological states and precise classification of disease levels based on these segmentation results. Initially, accuracy in physiological state image segmentation was successfully enhanced through BLE techniques, forming the critical foundation for all subsequent analyses. The introduction of BABs significantly improved the identification of image edges, with ablation studies and analyses on the number and iterations of BABs further validating the effectiveness and robustness of the proposed methods. Furthermore, the accuracy in classifying the disease levels of critical patients was effectively increased through a feature enhancement-based deep learning model. Ablation experiments confirmed the importance of both local and global attention mechanisms in enhancing model performance. The comprehensive model outperformed other comparative methods across all performance metrics, a finding thoroughly demonstrated through detailed performance comparisons.
The methods introduced offer a more precise and detailed technological approach to analyzing the physiological state of critically ill patients, aiding clinical practitioners in better understanding their diseases and thus making more informed treatment decisions. Moreover, the high accuracy and low error of the classification model further confirm its potential application in disease monitoring and prognostic assessment. However, limitations exist in the current study. For instance, the proposed methods may require substantial computational resources, potentially posing a barrier to practical application in resource-limited clinical settings. Additionally, the study results, based on a specific dataset, may need further validation across more diverse and complex datasets to verify their generalizability.
Future research directions should include further optimization of the model to reduce computational costs, making it more suitable for deployment in real clinical settings. Expanding the dataset to include a greater diversity and complexity will also be crucial in testing and improving the model's generalizability. Furthermore, refining the model's output in collaboration with clinical experts to provide more granular analysis of diseases could enhance the precision of clinical treatments. Lastly, exploring the application of the model in other medical imaging tasks, such as other types of disease classification and prognostic prediction, represents a meaningful direction for research.
[1] Almotairi, K.H., Hussein, A.M., Abualigah, L., Abujayyab, S.K., Mahmoud, E.H., Ghanem, B.O., Gandomi, A.H. (2023). Impact of artificial intelligence on COVID-19 pandemic: a survey of image processing, tracking of disease, prediction of outcomes, and computational medicine. Big Data and Cognitive Computing, 7(1): 11. https://doi.org/10.3390/bdcc7010011
[2] Pang, G., Yu, Z., Pan, H., Xie, C., Gong, P., Zhu, X., Peng, Z. (2022). An effective automatic recognition approach of Chinese herbal medicine by micro image processing. In 2022 IEEE 21st International Conference on Ubiquitous Computing and Communications (IUCC/CIT/DSCI/SmartCNS), Chongqing, China, pp. 261-267. https://doi.org/10.1109/IUCC-CIT-DSCI-SmartCNS57392.2022.00049
[3] Wei, J., Jia, D. (2022). Deep learning for image processing in traditional medicine cosmetology surgery. Innovative Computing, pp. 1535-1539. https://doi.org/10.1007/978-981-16-4258-6_191
[4] Wang, Q. (2022). Application of computer image processing technology in clinical medicine. In 2022 3rd International Conference on Education, Knowledge and Information Management (ICEKIM), Harbin, China, pp. 1120-1123. https://doi.org/10.1109/ICEKIM55072.2022.00243
[5] Rafl, J., Bachman, T.E., Martinek, T., Tejkl, L., Huttova, V., Kudrna, P., Roubik, K. (2019). Design and demonstration of a complex neonatal physiological model for testing of novel closed-loop inspired oxygen fraction controllers. In World Congress on Medical Physics and Biomedical Engineering 2018, Prague, Czech Republic, pp. 725-729. https://doi.org/10.1007/978-981-10-9035-6_134
[6] Vo, A. T.N., Le, T.Q., Le, T.N.H., Van Toi, V. (2020). Predictive modelling for cardiovascular disease mortality in intensive care units. In 7th International Conference on the Development of Biomedical Engineering in Vietnam (BME7), Ho Chi Minh, Vietnam, pp. 505-511. https://doi.org/10.1007/978-981-13-5859-3_88
[7] Meline, V., Caldwell, D.L., Kim, B.S., et al. (2023). Image‐based assessment of plant disease progression identifies new genetic loci for resistance to Ralstonia solanacearum in tomato. The Plant Journal, 113(5): 887-903. https://doi.org/10.1111/tpj.16101
[8] Hasan, A., Widodo, Mutaqin, K.H., Hidayat, S.H., Taufik, M. (2021). Quantitative assessment of mosaic disease severity based on digital image processing. IOP Conference Series: Earth and Environmental Science, 694(1): 012043. https://doi.org/10.1088/1755-1315/694/1/012043
[9] Ribeiro, G., Postolache, O., Martín, F.F. (2023). A new intelligent approach for automatic stress levels assessment based on multiple physiological parameters monitoring. IEEE Transactions on Instrumentation and Measurement, 73: 1-14. https://doi.org/10.1109/TIM.2023.3342218
[10] Wang, Z., Liang, H., Wang, J., Zang, Y., Xu, H., Lan, K., He, M., Yan, W., Cao, D., Yan, M., Zhang, Z. (2021). Investigation on new paradigm of clinical physiological monitoring by using wearable devices. Shengwu Yixue Gongchengxue Zazhi/Journal of Biomedical Engineering, 38(4): 753-763.
[11] Ma, C., Xu, H., Li, D., Zhang, Z. (2021). Research progress on wearable physiological parameter monitoring and its clinical applications. Shengwu Yixue Gongchengxue Zazhi/Journal of Biomedical Engineering, 38(3): 583-593. https://doi.org/10.7507/1001-5515.202010021
[12] Khalifa, A.F., Badr, E. (2023). Deep learning for image segmentation: A focus on medical imaging. Computers, Materials and Continua, 75(1): 1995-2024. http://dx.doi.org/10.32604/cmc.2023.035888
[13] Li, Z. (2023). Application of artificial intelligence and internet of things in medical imaging teaching. Journal of Biotech Research, 15: 58-65.
[14] Cai, W., Zhang, M., Wen, G., Yang, P. (2024). TSRNet: Tongue image segmentation with global and local refinement. Displays, 81: 102601. https://doi.org/10.1016/j.displa.2023.102601
[15] Jiang, J., Guo, Y., Bi, Z., Huang, Z., Yu, G., Wang, J. (2023). Segmentation of prostate ultrasound images: the state of the art and the future directions of segmentation algorithms. Artificial Intelligence Review, 56(1): 615-651. https://doi.org/10.1007/s10462-022-10179-4
[16] Liu, Y., Shen, W., Wu, D., Shao, J. (2023). IrisST-Net for iris segmentation and contour parameters extraction. Applied Intelligence, 53(9): 11267-11281. https://doi.org/10.1007/s10489-022-03973-8
[17] Dai, G., Tian, Z., Fan, J., Sunil, C.K., Dewi, C. (2024). DFN-PSAN: Multi-level deep information feature fusion extraction network for interpretable plant disease classification. Computers and Electronics in Agriculture, 216: 108481. https://doi.org/10.1016/j.compag.2023.108481
[18] Sharma, R., Kukreja, V., Bordoloi, D. (2023). Deep learning meets agriculture: A faster RCNN based approach to pepper leaf blight disease detection and multi-classification. In 2023 4th International Conference for Emerging Technology (INCET), Belgaum, India, pp. 1-5. https://doi.org/10.1109/INCET57972.2023.10170692
[19] Brar, S.K., Sharma, R., Vats, S., Kukreja, V. (2023). A smart approach to coconut leaf spot disease classification using computer vision and deep learning technique. In 2023 World Conference on Communication & Computing (WCONF), Raipur, India, pp. 1-6. https://doi.org/10.1109/WCONF58270.2023.10235251
[20] Tepdang, S., Chamnongthai, K. (2023). Boundary-based rice-leaf-disease classification and severity level estimation for automatic insecticide injection. Applied Engineering in Agriculture, 39(3): 367-379. https://doi.org/10.13031/aea.15257