Congcong Li*![]() | Yueting Cai
| Yueting Cai![]() | Yifan Li
| Yifan Li![]() | Penghui Zhang
| Penghui Zhang![]()
© 2024 The authors. This article is published by IIETA and is licensed under the CC BY 4.0 license (http://creativecommons.org/licenses/by/4.0/).
OPEN ACCESS
Nowadays, falls are one of the important causes of accidental death in older people. Assessment of fall risk can help to protect older adults in a timely manner. Current studies tend to use a single type of sensor, which always suffers from insufficient robustness, and the accuracy of the risk assessment model is low. In this study, we proposed a Convolutional Neural Network (CNN)-Bi Long Short-Term Memory (LSTM) fall risk assessment model based on the fusion of multi-sensor information with improved efficient channel attention (ISA-ECA-CNN-BiLSTM). Firstly, we construct a hybrid network consisting of a LSTM network and a CNN, which can capture the features hidden in asynchronous gait data sequences very well. An improved efficient Channel Attention Mechanism was also incorporated to make the model more attentive to the global features of the gait. Since the features extracted from the plantar pressure distribution signal and the IMU signal do not contribute to the fall risk assessment to the same extent, an adaptive weighted feature fusion method was introduced to enhance the influence of important features on the assessment results while weakening the influence of unimportant features on the assessment results. The improved method has higher sensitivity, specificity, and accuracy compared to the direct cascade method. The experimental results show that the accuracy, precision, sensitivity, and F1-score of the ISA-ECA-CNN-BiLSTM model proposed in this study were 98.4%, 99.1%, 98.8%, and 98.9%, respectively, which are higher than other classification models and can effectively extract gait features, thus improving the accuracy of fall risk recognition.
efficient channel attention mechanism, fall risk, feature weighted fusion, inertial sensor, neural network, plantar pressure
Falls are recognized as the leading cause of accidental deaths and injuries among people over the age of 65 years. Reduced mobility and impaired balance make older adults more prone to falls, which threatens their safety. Therefore, it is important to conduct a risk assessment for falls to predict the risk of falls in time and to take active preventive and intervention measures to minimize falls in the elderly. The purpose of fall risk assessment is to identify the elderly with high risk of falls and to propose individualized fall prevention methods, so as to we hope to reduce or avoid the occurrence of fall accidents. Clinical assessment of fall risk mainly uses fall risk scales such as the Berg Balance Scale, Tinetti Balance and Gait Scale, and the TUGT test [1, 2]. These methods require doctors to score, so it takes a long time and the process is complicated. With the development of technologies such as the Internet of Things and artificial intelligence, researchers have started to monitor human gait with wearable devices, by analyzing kinematic and kinetic characteristics such as acceleration, rhythm, gait speed, plantar pressure, and step length, to assess fall risks [3]. Gait is the posture and state of the human body when walking. Gait analysis can be used to effectively evaluate the risk of falls. The selection of gait features directly affected the assessment accuracy. Identifying the gait features with a high risk of falls can help doctors objectively evaluate the walking ability of the elderly in clinics. The preventive program has important practical significance for scientifically guiding the elderly to walk with a minimized fall risk.
Among the many wearable sensors, IMU and plantar pressure sensors are widely used in fall risk assessment because of their small size, low price and little impact on wearers and that IMU is ideal devices for detecting gait in daily life. However, since the IMU signals only capture gait kinematic parameters, the model's performance for fall risk assessment is poor [4-7]. Although the plantar pressure signal has rich dynamic gait information, research on fall risk assessment based on plantar pressure is still in its early stages. If only a single IMU or plantar pressure signal is used, there is a problem of insufficient robustness. Furthermore, most of the construction of risk assessment models lacks real-life data in daily scenarios, resulting in a lack of effectiveness in the risk assessment model [8, 9].
Therefore, the existing risk assessment model lacks validity, and the single-mode IMU and plantar pressure signals used alone have poor robustness. We proposed a new method based on the ISA-ECA-CNN-BiLSTM model with an improved attention mechanism, to perform fall risk assessment through adaptive weighted feature fusion based on the collected IMU signal and plantar pressure signal datasets.
1.1 Related work
Scholars have proposed a various fall risk assessment methods that use wearable devices. Among these methods and their variants, methods based on inertial sensors and plantar pressure sensors are the most attractive, as inertial sensors and plantar pressure transmitters can be mounted on the body and collect very detailed movement characteristics [10-16], and the acquired time-series gait data can be used to identify and authenticate people [17, 18]. Initially, machine learning methods were adopted for fall risk assessment. Wang et al. [19] designed an insole pressure sensor system that could provide users with real-time predictions and early warnings. It can predict the risk of falls in advance, allowing users sufficient time to take effective intervention measures and effectively reduce the occurrence of falls. Yang et al. [20] collected acceleration, angular velocity, and plantar pressure data of nine common lower limb movements of 10 subjects, extracted 13 gait features as the input of a common classifier to identify motion postures, and found that KNN has the highest classification accuracy. The recognition rate of 9 kinds of common types was high as 99.96%. Yu et al. [21] designed a plantar pressure sensor-based inversion-detection system. The fuzzy inference algorithm is used to divide the gait phase and then detect whether the inversion of the foot occurs, and the experimental results show that the plantar pressure data have an important predictive value for sports risk. Zhao et al. [22] developed a wearable plantar pressure force measurement and analysis (WPPFMA) system based on a flexible sensor matrix film to monitor plantar pressure force in real time. This system is highly valuable for personal foot care, gait analysis, and clinical diagnosis. Peng et al. [23] used an integrated empirical modal decomposition to decompose Parkinsonist left and right VGRF signals from high to low frequency bands into intrinsic modal functions. A person's gait health is then analyzed using their instantaneous phase dependence to assess the strength of the causal interaction between each intrinsic mode function. Gao et al. [24] collected the foot low-pressure data of 48 subjects, extracted 44 multi-dimensional weak foot features based on one legged COP, and analyzed the symmetry and time consistency of the gait line by using the probability distribution method. The final model achieved an accuracy of 87.5% for the test data. These methods can differentiate individual features with transparency, and the individual contribution of features to the decision is visible. However, manual feature extraction relies heavily on human experience, which is time-consuming and inefficient in fall prediction [25, 26]. Deep learning models can gradually extract higher-level features from raw inputs; therefore, there is no need to manually select relevant features that may require expert knowledge. In particular, for gait analysis, deep learning can handle complex data and provide accurate results. For example, Nait Aicha et al. [27] first studied CNN and LSTM networks that can automatically extract features from raw accelerometer data for fall risk assessment. Experiments showed that this method has a higher prediction accuracy than CNN and LSTM alone. Tunca et al. [28] used an inertial sensor-based gait analysis system with a LSTM neural network to extract gait spatiotemporal parameter sequences as input features for fall risk assessment and achieved an excellent classification accuracy of 92.1%. Baloch et al. [29] performed early fusion and late fusion based on acceleration sensors and angular velocity sensors to identify human activity using CNN and convolutional CNN-LSTM. A weighted f1 score of 93.78% was obtained on the RealDisp dataset when late fusion was performed. Liang et al. [30] proposed a fall risk prediction model for the elderly using the plantar center of force with the ConvLSTM algorithm. This method achieved an accuracy of 94 percent accuracy. Yu et al. [31] used three deep networks, CNN, LSTM, and Hybrid Convolutional Long Short-Term Memory (ConvLSTM), to construct a fall prediction model, with model inputs of raw IMU data. The results on the SisFall dataset showed that the hybrid ConvLSTM model had an average of non-fall, pre-impact fall, and fall sensitivity of 93.15%, 93.78%, and 96.00%, respectively, which are higher than the LSTM (except for the, fall class) and CNN models. Shalin et al. [3] used 16 gait features extracted from plantar pressure data for gait freezing detection, the study collected plantar pressure data from 11 Parkinson's disease and classified them using the LSTM network. The experimental results showed that the classification model achieved 82.1% (SD 6.2%) mean sensitivity and 89.5% (SD 3.6%) mean specificity.
1.2 Motivation and contribution
In summary, currently, IMU-based fall risk assessment methods still have the problem of low accuracy, and there are relatively few fall risk assessment methods based on plantar pressure sensors. It is still debatable how to improve the accuracy and reliability of fall risk assessment. In addition, IMU can acquire gait kinematic parameters, and plantar pressure sensor contains rich gait dynamics information, combining IMU and plantar pressure sensor may be an effective way to improve fall risk assessment. So Based on the above, this study establishes a dataset containing multi-sensor information for fall risk assessment and proposes a fall risk assessment model that fuses multi-modal data and achieves 98.4% accuracy.
The main innovations and contributions of this work include:
We built a dataset that includes labels indicating fall risk.
We proposed a deep learning framework incorporating an improved attention mechanism to better focus on global features, thereby improving recognition accuracy.
By employing adaptive weighting, we fused signals from two sensors at the feature level, ensuring a higher recognition accuracy and enhancing the robust-ness of the fall risk assessment model.
2.1 Experimental scheme and data
By reviewing the literature [19-31], it is evident that the number of participants in fall risk assessment experiments typically ranges from 5 to 30 individuals. There are variations in the types and quantities of sensors used by different researchers, but the emphasis is predominantly on sensors located on the lower limbs. Although walking test tasks differ across studies, they commonly include activities such as straight-line walking and turning. In this study, 24 elderly individuals in and around nursing homes were used as experimental subjects. Eighteen men, 75%) had an average age of 70 years and six women, 25%) had an average age of 65 years. They were all over 60 years old, cognitively capable, and able to walk independently.
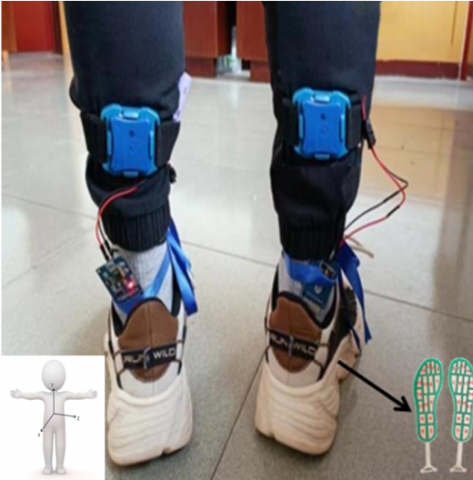
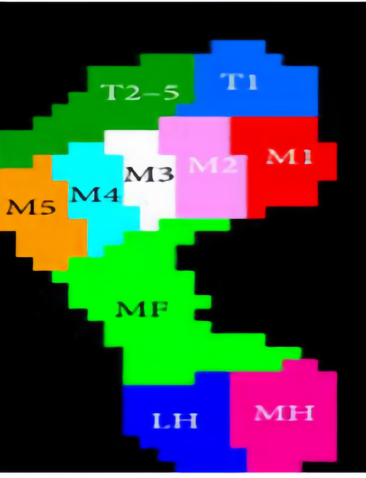
The three-dimensional coordinates of the human body and the sensor placement are shown in Figure 1. The plantar pressure sensor was incorporated into an insole to obtain the plantar pressure of the human body. According to the structure of the human foot, the sole of the foot is divided into five areas, as shown in Figure 2, including the first toe (T1), second to fifth toe (T2-5), metatarsals (M1-5), midfoot (MF), and heel (HM, HL) [32]. Note that the data represent the vertical direction of the ground. Since there were a large number of missing values in the data of the toe area, we deleted the T2-5 data and only used the remaining four parts of the data. An inertial sensor unit IMU was placed on each ankle to collect the triaxial acceleration and angular velocity. The experiment was carried out on flat ground, and the experimental environment did not require special arrangements. At the beginning of the experiment, the subjects were first asked to stand still on the spot, keep their feet without obvious movements, and shake their body involuntarily. After the recorder gave the start signal, the volunteers began to walk forward, and the walking speed was not specified, but it was carried out at a speed that the volunteers thought was comfortable until the recorder gave the end signal. Each subject repeated the experiment to 2-3 times. However, not all experimental data contain complete information; therefore, in this study, two of the more complete experimental data were selected for the subsequent study.
Figure 1. Sensor wearing condition
Figure 2. Plantar partition
2.2 Data label
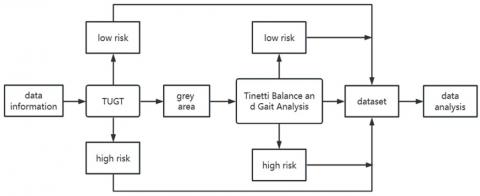
Supervised learning labels must be added to the elderly after data collection; the process of data labels is shown in Figure 3. The Timed Up and Go Test (TUGT) has been widely used in clinical trials and is considered an effective method for measuring homeostasis [33, 34]. Therefore, we used TUGT in the first stage of the labeling process. This test records the time the volunteers stand up from a chair, walk 3 m at a constant speed, turn around, and sit down. The risk of falling was positively correlated with the time spent. We classified the elderly according to the research results of Pardoel et al. [35], and there were 15 in the high-risk group, 5 in the low-risk group and 4 in the "grey zone.” The 'grey zone' population was not clearly classified in the TUGT trial, so this group was further assessed using the Tinetti Balance and Gait Scale. The Tinetti Balance and Gait Scale is a comprehensive gait and balance assessment tool for the elderly developed by Tinetti in 1986. The balance test consists of a balance test and a gait test consisting of 10 items with a total score of 16 points, consisting of eight items with a total score of 12 points, which was improved by Tinetti [36] in 1986. Beck [37] modified the scale in 1999, with nine entries in the Balance Test section totaling 16 points and seven entries in the Gait Test section totaling 12 points, still giving the scale a full score of 28 points. A score of less than 15 indicated a higher risk of falling [38]. Finally, the results of the two experiments were combined to obtain data labels. Of the 24 volunteers, 17 were at low risk of falls and 7 were at high risk of falls.
Figure 3. Data labeling flow chart
2.3 Sliding window method to construct sequence samples
The CNN model is usually used to process one-dimensional grid data, and it is necessary to convert the one-dimensional data into grid data as the input of the CNN model. The use of the sliding window method to process time-series data is very effective. One-dimensional data can be constructed into a grid data structure. The sample segmentation process is illustrated in Figure 4. Taking the triaxial acceleration data in the inertial data as an example, the entire process of constructing sequence samples using the sliding window method is described. Suppose the window size is T, and the sliding overlap rate is 50%. The T data records covered by the window will be used as a new sequence sample, and each sliding window will cover T/2 new data records. Some studies [39, 40] point out that the label of the sample with the highest frequency in the window should be used as the label of the data segment, whereas others believe that it is more reasonable to use the label of the last frame use the label of the last frame sample as the label of the data segment. We chose the first method, as shown in Figure 4, where blue and green rep-resent high and low fall risks, respectively. The sequence sample categories generated by the first and second sliding windows are blue and green, respectively. To better identify the gait of the monitoring object, it is necessary to use the feature parameters within a period of time, and the optimal length T of the sliding window is determined by the minimum duration of the falling gait and the sampling frequency. When T is too large, the window can contain enough fall features, but the model cannot recognize short-duration gaits, and the detection delay becomes longer. When T is too small, the window lacks sufficient gait features, and the detection accuracy reduces accordingly. Therefore, through experimental verification in Section 3.3.5 of this paper, the optimal sliding window size was selected to be 1s, and the sliding overlap rate was 50%. Finally, 2085 high-risk and 826 low-risk samples were obtained.
Figure 4. Sample segmentation diagram
3.1 Improved ECA attention mechanism
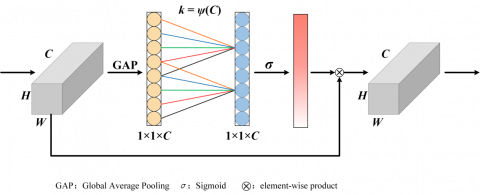
Wang et al. [41] believed that the compression and dimensionality reduction of SE (Squeeze and Excitation) attention model has a negative impact on learning the dependencies between channels, and capturing the dependencies between all channels is inefficient and unnecessary. Therefore, an ECA attention mechanism was proposed, as shown in Figure 5. The ECA module proposes a local cross-channel interaction strategy without a dimensionality reduction. The ECA attention mechanism uses 1-dimensional convolution to effectively realize partial cross-channel interaction and obtain dependencies between channels, thereby avoiding the negative effects of dimensionality reduction. The ECA mechanism plays a crucial role in enhancing the accuracy of fall risk assessment by focusing on the most informative channels within the input data. This selective attention mechanism helps highlight the key features that distinguish an individual's gait. Additionally, it aids in reducing the impact of irrelevant or noisy data, ultimately improving the accuracy and robustness of the fall risk assessment model. However, the ECA attention mechanism ignores the spatial attention module.
Figure 5. Schematic diagram of the ECA attention mechanism module
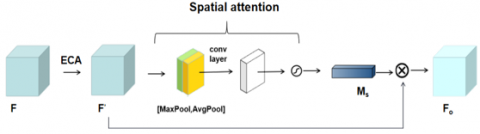
Figure 6. Schematic diagram of the improved ECA attention mechanism module (ISA-ECA)
Therefore, we have introduced an enhanced ECA attention mechanism, as delineated in Figure 6. Following the ECA operation, a spatial attention module has been incorporated. The output feature map, enriched with channel attention, is fed into this spatial attention module. Within the spatial attention module, initial operations entail average pooling and maximum pooling along the channel axis of the input feature map, yielding intermediate results denoted as A and B, respectively. Subsequently, these outcomes undergo connections and convolutions via a conventional convolutional layer, thereby generating a 2D spatial attention map. The mathematical formulation of the spatial attention module is expressed as follows. This innovative augmentation aims to address issues of redundancy and elevate the discriminative power of the attention mechanism for improved performance in the given context.
$\begin{aligned} M_S(F)=\sigma\left(f^{7 \times 7}\right. & ([\operatorname{AvgPool}(F) ; \operatorname{MaxPool}(F)])) =\sigma\left(f^{7 \times 7}\left(\left[F_{\text {avg }}^S ; F_{\max }^S\right]\right)\right)\end{aligned}$ (1)
Among them, $f^{7 \times 7}$ represents the convolution operation with a convolution kernel size of 7*7, and $\sigma$ represents the Sigmoid function. $\mathrm{F}_{\mathrm{avg}}^{\mathrm{S}}$ and $\mathrm{F}_{\mathrm{max}}^{\mathrm{S}}$ represent average pooling features and maximum pooling features, respectively.
The integration of the spatial attention module serves as a remedial measure for the limitations inherent in the ECA attention mechanism. This enhancement facilitates a more precise extraction of human gait features, thereby contributing to an elevated model accuracy. The incorporation of the spatial attention module is a strategic refinement aimed at mitigating deficiencies in the original ECA mechanism, ultimately bolstering the discernment and fidelity of the model's representations of intricate gait patterns.
3.2 ISA-ECA-CNN-BiLSTM model architecture
The overall process of fall gait risk assessment proposed in this paper is shown in Figure 7. Firstly, data collection is carried out through human walking experiments, fixing the IMU and plantar pressure sensor on human’s sole and the calf respectively, the gait sequence data set was constructed by filtering and segmenting the IMU and plantar pressure signals. Then the gait data set was inputted into the ISA-ECA-CNN-BiLSTM network model for the gait detection task. The main network structure of the model is a CNN module and a Bi-LSTM module, where the CNN module is used to provide an abstract representation of the gait signal in the feature map. LSTM is used to model the feature maps output by the CNN module. The translation invariance of the convolution operation in the convolutional layer ensures that the key timing of the features is preserved while extracting low-level local features, that is why the output vector of the CNN module can be used as the input of the LSTM module. After the multi-layer convolution operation, the field of view of the convolution kernel is expanded, and the length of the feature sequence is shortened, which realizes the compression of the original information and is more conducive to the modeling of the LSTM network. In addition, max pooling and improved ECA attention are added after the second or fourth layers of convolutional blocks. This operation can fuse channel and spatial global information during local feature extraction, improving the ability to represent gait signals. Finally, the features extracted from the IMU signal and the plantar pressure signal are fused with adaptive weighted features to perform the fall risk detection task. The framework of the fall gait risk analysis model is shown in Figure 8.
The ISA-ECA-CNN-BiLSTM model consists of the following seven parts:
Input layer: Acceleration and angular velocity data and plantar pressure data, pre-processed and fed into the target network.
Convolution layer: In time series data, adjacent signals can be correlated with each other, and CNN can capture the local correlation of time series data; therefore, we used it to extract local features. Each convolution layer contains 64 filters and the kernel size is 7×1. Each unit is activated according to the ReLU activation function after convolution.
Pooling layer: The second and fourth layer convolutions of the model used the maximum pooling method for sub-sampling, further reducing the dimensionality of the information extracted by the convolutional layer, the size of the model and the number of calculations to prevent overfitting. The size of the kernel in this layer is 2×2, the stride is 2.
Attention Mechanism: The attention mechanism can make the model more accurate and efficient in processing sequence data. In the attention mechanism, the output of each neuron depends not only on the output of all the neurons in the previous layer, but can also be weighted according to different parts of the input data. In order to better extract features of human gait, we added the above-mentioned improved ECA module at different positions of the model.
Bidirectional LSTM layer: The input sequences are input into two LSTM neural networks in positive and reverse order respectively for feature extraction. The word vector is formed after the two output vectors are spliced together as the final feature expression of the word. The final prediction result is determined by both forward propagation and back propagation.
Figure 7. Fall risk assessment framework
Figure 8. Schematic diagram of model frame of ISA-ECA-CNN-BiLSTM
Dropout layer: It is added after the fully connected layer and bidirectional LSTM layers. When propagating forward, it makes the activation value of a neuron stop working with a certain probability p, which makes the model more generalized, we set the value of dropout to 0.5.
Output layer: The features processed by the designed network are connected to each node and all nodes of the previous layer through the fully connected layer to synthesize the features extracted before, and after obtaining a specific value, the final classification result is obtained based on the softmax classifier.
In this paper, we used the above model for fall risk assessment using a multimodal fusion approach. The conventional approach for combining multimodal features is to concatenate the feature vectors of each modality directly. Employing a direct concatenation of feature vectors may not be the most optimal approach due to the inherent dissimilarity in the contributions of plantar pressure signals and IMU signals to the fall risk assessment task. Additionally, there exists a likelihood of high redundancy or, conversely, complementary relationships between features extracted from these two signal sources. This elevated duplication rate underscores the necessity for a more nuanced strategy that captures the nuanced interplay and unique characteristics of each signal type in order to enhance the overall effectiveness of fall risk assessment. Therefore, this paper adopts adaptive feature weighted fusion, and automatically shields redundant features and highlights complementary features through network training to achieve feature fusion of the two signals. We assigned a weight to each feature parameter to indicate how important that feature parameter is for the fall risk assessment task. The weight value can be learned automatically through neural network training, and automatically assign higher weights to the feature parameters with high contribution degree.
The computational process of adaptive weighted feature fusion is shown in Figure 9. For each gait parameter, a weight β is set. Suppose FM is the inertial feature vector output after the network model structure removes the last layer, F is the plantar feature vector output after the network model structure removes the last layer, and $F_S$ is the feature vector after splicing the two feature vectors. Then $F_S$ can be obtained by the following formula:
$F_s=\operatorname{conat}\left(F_M, F\right)\left[\begin{array}{c}F_M \\ F\end{array}\right]$ (2)
Next, the concatenated feature vector $F_S$ is assigned weights to obtain the fused feature vector $F_F$, which is calculated as follows:
$F_F=\beta F_S=\left[\begin{array}{c}\beta_M F_M \\ \beta_P F\end{array}\right]$ (3)
In Eq. (3), $\beta, \beta_M$, and $\beta_P$ represent weight vectors. After obtaining the fused feature vector, calculate the category score G:
$G= softmax\left(W F_F+b\right)$ (4)
In Eq. (4), $\mathrm{W} \in \mathrm{R}^{\mathrm{C}_1 * \mathrm{~F}_{\mathrm{s}}}$ and $\mathrm{b} \in \mathrm{R}^{\mathrm{C}_l}$, both are the weight matrix and bias vector respectively. Cl is the number of classification categories, and FF is the dimension of the fused vector. The softmax function is defined as:
$softmax\left(Z_i\right)=\frac{e^{Z_i}}{\sum_{i=1}^{C_i} e^{Z_j}},\left(i, 1,2,3, \ldots C_l\right)$ (5)
Figure 9. Feature fusion based on adaptive weighting
Finally, the final predicted category y is calculated, and its calculation formula is:
$y=argmax(G)$ (6)
The loss calculation method in the feature fusion network model is the cross entropy loss function, which can be obtained by the following formula:
Loss $=\frac{1}{N} \sum_{\mathrm{j}} \operatorname{loss}_{\mathrm{j}}=-\frac{1}{\mathrm{~N}} \sum_{\mathrm{j}} \sum_{\mathrm{h}}^{\mathrm{C}_{\mathrm{l}}} \mathrm{y}_{\mathrm{jh}} \log \left(\mathrm{G}_{\mathrm{jh}}\right)$ (7)
The Eq. (7), N is the total number of samples, and Gjh represents the probability that sample j belongs to category h. yjh is a symbolic function, which can be expressed as:
$y_{jh}=\left\{\begin{array}{c}1(\text { The real category of sample } j \text { is } h) \\ 0(\text { The real category of sample } j \text { is not } h)\end{array}\right.$ (8)
In the model training phase, the single-modal ISA-ECA-CNN-BiLSTM model is first trained as a pre-training model. The multimodal adaptive weighted feature fusion model is then trained by fixing the network parameters of the ISA-ECA-CNN-BiLSTM model, and the weights in the feature fusion network model change with training. This training method can speed up model convergence and save training time.
4.1 Experimental environment
Experiment and result analysis the purpose of the experiment is to identify the risk of human falls and verify its accuracy. The experiment uses the Win10 operating system, the CPU is Intel(R) Core (TM) i9-7900X 3.30GHz, the GPU is GeForce RTX 3090, the Python version is 3.8.4, the Cuda and Cudnn versions are 11.2 and 8.1.0 respectively.
The constructed dataset is used to train and test the model. We used 80% of the dataset as the training set and 20% as the test set. When dividing the dataset, we ensured that the data was random and reproducible. In this experiment, trial and error was used to set hyperparameters, and the early termination condition was that the loss of model did not decrease for 5 consecutive times. The final selected hyperparameter in this experiment is the super-parameter set with the best performance of the model on the verification set, as shown in Table 1. The network is optimized using the Adam algorithm.
Table 1. Model parameter setting
|
Setting Item |
Parameter Value |
|
Learning rate |
0.0001 |
|
Batch size |
256 |
|
Epoch |
100 |
|
Dropout |
0.5 |
|
Number of hidden layer units |
512 |
4.2 Evaluation indicators
In the classification problem, the indicators for quantitatively evaluating the performance of classifiers include accuracy, precision, sensitivity and F1-score. Different indicators are interrelated and each has its emphasis. Huang et al. [42] pointed out in their research that in the fall risk assessment algorithm, the most important indicator is sensitivity, followed by accuracy. Because low sensitivity will mean that the elderly who are at high risk of falls have not been correctly classified. From the perspective of economic costs, these high-risk individuals underestimate their own risk of falls. Once a fall occurs, it will bring serious economic and health loss. Similarly, high sensitivity and low specificity will mean that some people with low fall risk will also be classified as high fall risk group, but compared with low sensitivity, the economic loss caused by such misclassification is relatively small only increasing the allocation of social resources accordingly. Therefore, to ensure that as many high-fall risk groups as possible are correctly classified into high-fall risk groups, the classification algorithm is required to have higher sensitivity. At the same time, the British National Institute for Health and Service Optimization also believes that the sensitivity index should be as high as possible in the "Guidelines for Assessment and Prevention of Falls in the Elderly", and pointed out that both the sensitivity and accuracy indicators should reach 70% and above.
In this paper, high-fall-risk groups are used as positive samples and low-fall-risk groups are used as negative samples. Among them, TP refers to the number of samples correctly identified as high risk, TN refers to the number of samples correctly identified as low risk, FP refers to the number of samples incorrectly identified as high risk, and FN refers to the number of samples incorrectly identified as low risk. The definitions of accuracy, precision, sensitivity and F1-score are given below:
$Accuracy =\frac{T P+T N}{T P+T N+F P+F N}$ (9)
$Precision =\frac{T P}{T P+F P}$ (10)
$Sensitivit =\frac{T P}{T P+F N}$ (11)
$\text{F1}score =\frac{2 * Precision * Recall}{Precision+ Recall}$ (12)
4.3 Model evaluation test
In this paper, the models CNN, LSTM, GRU, CNN-LSTM and CNN-BiLSTM in the existing fall risk assessment research are compared and the results are shown in Table 2. The CNN-BiLSTM model has the highest accuracy and precision. The results show that compared with CNN and LSTM alone all four metrics have been improved to a certain extent. Compared with GRU, the accuracy, precision and F1Score have increased by 6.5%, 13.4% and 4.4%. Compared with CNN-LSTM, the accuracy and sensitivity of this model are similar, but the precision and F1Score are 4.8% and 1.1% higher than CNN-LSTM. So finally, CNN-BiLSTM is chosen as the baseline model for optimization improvement in this paper.
Table 2. Performance comparison of baseline models
|
Model |
Accuracy |
Precision |
Sensitivity |
F1 Score |
|
CNN |
82.7% |
92.7% |
87.9% |
90.1% |
|
LSTM |
81.1% |
94.5% |
87.2% |
89.8% |
|
GRU |
81.6% |
83.0% |
89.9% |
87.8% |
|
CNN-LSTM |
87.6% |
91.6% |
90.1% |
91.1% |
|
CNN-BiLSTM |
88.1% |
96.4% |
89.6% |
92.2% |
4.4 Effect of attention mechanism and max pooling layer on model performance
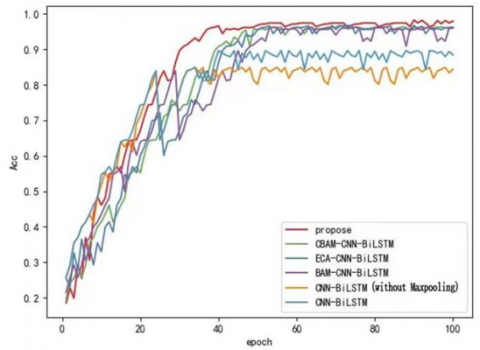
Figure 10. Training accuracy/loss for different models
Table 3. Performance comparison of the ISA-ECA-CNN-BiLSTM model with other models
|
Model |
Accuracy |
Precision |
Sensitivity |
|
|
CNN-BiLSTM(noMaxpooling) |
88.1% |
96.4% |
89.6% |
92.2% |
|
CNN-BiLSTM |
90.0% |
95.8% |
95.1% |
95.5% |
|
CBAM-CNN-BiLSTM |
96.5% |
98.7% |
97.4% |
98.5% |
|
ECA-CNN-BiLSTM |
97.1% |
98.9% |
98.3% |
98.6% |
|
BAM-CNN-BiLSTM |
96.4% |
98.1% |
97.6% |
98.0% |
|
ISA-ECA-CNN-BiLSTM |
98.4% |
99.1% |
98.8% |
98.9% |
To assess the practicality of integrating the enhanced ECA attention module and max pooling layer into the CNN-BiLSTM model, we performed experimental evaluations using a custom dataset across six distinct network model configurations:
(1) CNN-BiLSTM (lacking a max pooling layer);
(2) CNN-BiLSTM with an added max pooling layer for enhanced feature extraction;
(3) CBAM-CNN-BiLSTM, incorporating CBAM attention for refined focus on relevant features;
(4) ECA-CNN-BiLSTM, enhanced with ECA attention to improve accuracy by emphasizing important features;
(5) BAM-CNN-BiLSTM, augmented with BAM attention for better feature representation;
(6) ISA-ECA-CNN-BiLSTM, the model introduced in this study, featuring an advanced version of ECA attention for superior performance.
The outcomes of the six network models are illustrated in Figure 10, with the experimental results detailed in Table 3. These results clearly demonstrate that the ISA-ECA-CNN-BiLSTM model outperforms the others in terms of accuracy and sensitivity. As depicted in Figure 10, the ISA-ECA-CNN-BiLSTM model in our investigation significantly surpasses alternative models in accuracy and convergence speed. A comparison between models (1) and (2) reveals that incorporating a max-pooling layer enhances the accuracy and sensitivity by 2.5% and 5.7%, respectively. The integration of an attention mechanism preserves critical feature information, thereby increasing model precision. Further analysis of the CNN-BiLSTM model, upon integrating BAM, ECA, and CBAM attention mechanisms, shows that the ECA attention mechanism notably boosts model accuracy by 7.7%. However, ECA attention overlooks the spatial attention module, unlike CBAM and BAM. Consequently, our study introduces a spatial attention module following ECA attention. Within this module, global and maximum pooling operations are initially executed, followed by concatenation and convolution using standard convolutional layers to produce a two-dimensional spatial attention map. This enhancement significantly refines the attention mechanism's impact on model accuracy. The experimental findings confirm that the refined model exhibits commendable accuracy, precision, and sensitivity.
4.5 Effect of different CNN layers on model performance
In examining the impact of varying the number of CNN layers on classification accuracy, we conducted a comparative analysis across different configurations, specifically focusing on models with 1, 2, 3, and 4 CNN layers, while keeping the LSTM parameters constant. The outcomes of these experiments are presented in Table 4. Notably, when employing 4 CNN layers, the model achieved the highest accuracy, surpassing the performance observed with 1, 2, and 3 layers. Consequently, we opted to fix the number of CNN layers at 4 based on these findings.
Table 4. Accuracy of the model at different CNN layers
|
CNN Layer |
Accuracy |
Precision |
Sensitivity |
F1 Score |
|
1 |
97.1% |
98.9% |
98.5% |
98.8% |
|
2 |
96.8% |
98.8% |
98.0% |
98.4% |
|
3 |
95.2% |
98.3% |
96.9% |
97.9% |
|
4 |
98.4% |
99.1% |
98.8% |
98.9% |
4.6 Effect of different LSTM layers on model performance
To assess how the classification accuracy is influenced by the number of LSTM layers, we maintained the CNN parameters constant and manipulated the number of LSTM layers. The results of these experiments are detailed in Table 5. Notably, the model achieved its highest accuracy when employing a single LSTM layer, outperforming configurations with 2 and 3 layers. Consequently, we opted to settle on a single LSTM layer based on these results.
Table 5. Accuracy of the model at different LSTM layers
|
LSTM Layer |
Accuracy |
Precision |
Sensitivity |
F1 Score |
|
1 |
98.4% |
99.1% |
98.8% |
98.9% |
|
2 |
94.2% |
96.9% |
97.4% |
97.9% |
|
3 |
91.9% |
96.3% |
94.7% |
96.6% |
4.7 Effect of different sliding window sizes on model performance
In order to observe the effect of the sliding window size on the classification accuracy, we compared the model accuracy changes with window sizes of 1, 2, and 3 seconds, while keeping other parameters unchanged. The experimental results are shown in Table 6. When the size of the sliding window is 1 second, the accuracy of the model is the highest, and the performance is better than 2 seconds and 3 seconds, so we finally set the sliding window size to 1 second. Then, we compared the model accuracy changes with window sliding overlap rate of 40%, 50%, and 60%, while keeping the sliding window size to 1 second. When the sliding overlap rate is 50%, the accuracy of the model is the highest. The experimental results are shown in Table 7.
Table 6. Accuracy of the model at different sliding window sizes
|
Sliding Window Size (s) |
Accuracy |
Precision |
Sensitivity |
F1 Score |
|
1 |
98.4% |
99.1% |
98.8% |
98.9% |
|
2 |
96.9% |
98.8% |
98.0% |
98.7% |
|
3 |
96.1% |
98.3% |
97.8% |
98.0% |
Table 7. Accuracy of the model at different sliding overlap rate
|
Sliding Overlap Rate |
Accuracy |
Precision |
Sensitivity |
F1-Score |
|
40% |
97.0% |
98.8% |
98.2% |
98.4% |
|
50% |
98.4% |
99.1% |
98.8% |
98.9% |
|
60% |
95.3% |
97.8% |
97.4% |
97.5% |
4.8 Analysis of model test results
We analyze the IMU signal and plantar pressure signal to assess the risk of falls in humans. The performance indicators of the fall risk assessment model on the test set are shown in Table 8, where the prediction accuracies for high-risk and low-risk are 98.1% and 99.0% respectively. The test results demonstrate the effectiveness of the ISA-ECA-CNN-BiLSTM algorithm with fused signal features.
Table 8. ISA-ECA-CNN-BiLSTM model test results
|
Fall Risk |
Accuracy |
Precision |
Sensitivity |
|
|
high |
98.1% |
98.6% |
98.2% |
98.5% |
|
low |
99.0% |
99.4% |
99.1% |
99.3% |
4.9 Analysis of model test results
Table 9 provides a comparison of the recognition performance between our approach and existing studies. Although the performance of fall risk assessment cannot be directly compared to previous findings due to different experimental conditions, our approach achieved comparable performance: using our own constructed dataset as a benchmark. In this study, the LSTM model proposed by Tunca et al. [28] achieved 91.88% recognition accuracy, whereas the ConvLSTM model proposed by Liang et al. [30], which uses a convolutional kernel instead of the fully-connected layer in the LSTM, achieves 94.2% accuracy. The CNN model proposed by Baloch et al. [29] achieved 93.6% accuracy. Baloch et al. [29] also proposed combining CNN and LSTM to achieve 95.2% accuracy, exceeding the performance of the CNN model alone. However, the comparison in Table 9 indicates that the model in this study had the highest accuracy rate. The results show that the classification accuracy of the fall risk assessment method designed in this chapter is 98.4%. Compared with other methods, the fall risk assessment method based on multi-sensor information in this study also has a high classification accuracy, and by continuously adjusting the model parameters, it has achieved better experimental results in fall risk assessment research.
Table 9. Performance comparison with the existing methods
|
Study |
Technology |
Accuracy |
|
[29] |
CNN-LSTM |
95.2% |
|
[28] |
LSTM |
94.9% |
|
[29] |
CNN |
93.6% |
|
[30] |
ConvLSTM |
94.2% |
|
propose |
ISA-ECA-CNN-BiLSTM |
98.4% |
In this study, we propose a fall risk assessment model based on the fusion of multisensory information to improve the efficiency of the channel attention mechanism of CNN-BILSTM. First, unlike existing fall risk assessment methods, our model accepts inputs as fixed-length segments, an improvement that allows the recognition model to be freed from noise- and bias-sensitive fall risk assessment tasks. Second, an improved network structure of an efficient channel attention mechanism is designed to incorporate a spatial attention module, which allows the model to efficiently extract global gait features. Based on this, based on this, gait features extracted from IMU signals and plantar pressure signals are adaptively weighted and fused, and the evaluation of our constructed dataset demonstrates that this approach outperforms existing fall risk assessment models and achieves new state-of-the-art performance in recognition and validation tasks.
This study had several limitations. First, the number of people in the constructed dataset is small and the size of the data is small. If it were trained using a larger dataset, the current model might perform better. Second, there were mainly male participants-75%). Future research should consider how male and female models perform differently. Deep learning models are also difficult to interpret. Future research that aims to create interpretable models may provide a more in-depth understanding of the factors that affect fall risk. Due to the lack of suitable public datasets, all experiments in this study were validated on a self-constructed dataset. In the future, it may be beneficial to consider employing external datasets for more comprehensive validation or cross-validation to ensure the generalizability of the model.
This work was supported by the S&T program of Hebei (Grant No.: 203777119D), and the Scientific Research Projects of Universities in Hebei Province (Grant No.: ZD2021056).
[1] Howcroft, J., Lemaire, E.D., Kofman, J. (2018). Prospective elderly fall prediction by older-adult fall-risk modeling with feature selection. Biomedical Signal Processing and Control, 43: 320-328. https://doi.org/10.1016/j.bspc.2018.03.005
[2] Wei, T.S., Liu, P.T., Chang, L.W., Liu, S.Y. (2017). Gait asymmetry, ankle spasticity, and depression as independent predictors of falls in ambulatory stroke patients. PloS One, 12(5): e0177136. https://doi.org/10.1371/journal.pone.0177136
[3] Shalin, G., Pardoel, S., Lemaire, E.D., Nantel, J., Kofman, J. (2021). Prediction and detection of freezing of gait in Parkinson’s disease from plantar pressure data using LSTM neural-networks. Journal of Neuroengineering and Rehabilitation, 18(1): 1-15. https://doi.org/10.1186/s12984-021-00958-5
[4] Marschollek, M., Rehwald, A., Wolf, K.H., Gietzelt, M., Nemitz, G., Zu Schwabedissen, H.M., Haux, R. (2011). Sensor-based fall risk assessment-an expert ‘to go’. Methods of Information in Medicine, 50(5): 420-426. https://doi.org/10.3414/ME10-01-0040
[5] Li, C.C., Cai, Y.T., Habeeb, L.J., Rahman, A., Ritzkal (2023). Enhancing fall risk assessment in the elderly: A study utilizing transfer learning in an improved efficientNet Network with the gramian angular field technique. Healthcraft Frontiers, 1(1): 1-14. https://doi.org/10.56578/hf010101
[6] Panel on Prevention of Falls in Older Persons, American Geriatrics Society and British Geriatrics Society. (2011). Summary of the updated American Geriatrics Society/British Geriatrics Society clinical practice guideline for prevention of falls in older persons. Journal of the American Geriatrics Society, 59(1): 148-157. https://doi.org/10.1111/j.1532-5415.2010.03234.x
[7] Shi, L.F., Liu, Z.Y., Zhou, K.J., Shi, Y., Jing, X. (2023). Novel deep learning network for gait recognition using multimodal inertial sensors. Sensors, 23(2): 849. https://doi.org/10.3390/s23020849
[8] Dong, D., Ma, C., Wang, M., Vu, H.T., Vanderborght, B., Sun, Y. (2023). A low-cost framework for the recognition of human motion gait phases and patterns based on multi-source perception fusion. Engineering Applications of Artificial Intelligence, 120: 105886. https://doi.org/10.1016/j.engappai.2023.105886
[9] Ihlen, E.A., Weiss, A., Beck, Y., Helbostad, J.L., Hausdorff, J.M. (2016). A comparison study of local dynamic stability measures of daily life walking in older adult community-dwelling fallers and non-fallers. Journal of Biomechanics, 49(9): 1498-1503. https://doi.org/10.1016/j.jbiomech.2016.03.019
[10] Plötz, T., Hammerla, N.Y., Olivier, P.L. (2011). Feature learning for activity recognition in ubiquitous computing. In Twenty-Second International Joint Conference on Artificial Intelligence. Culture Lab School of Computing Science Newcastle University Newcastle upon Tyne, UK, pp. 1729-1734.
[11] Yang, J.Y., Wang, J.S., Chen, Y.P. (2008). Using acceleration measurements for activity recognition: An effective learning algorithm for constructing neural classifiers. Pattern Recognition Letters, 29(16): 2213-2220. https://doi.org/10.1016/j.patrec.2008.08.002
[12] Alsheikh, M.A., Selim, A., Niyato, D., Doyle, L., Lin, S., Tan, H.P. (2016). Deep activity recognition models with triaxial accelerometers. In Workshops at The Thirtieth AAAI Conference on Artificial Intelligence, pp. 1-7. https://doi.org/10.48550/arXiv.1511.04664
[13] Ward, J.A., Lukowicz, P., Troster, G., Starner, T.E. (2006). Activity recognition of assembly tasks using body-worn microphones and accelerometers. IEEE Transactions on Pattern Analysis and Machine Intelligence, 28(10): 1553-1567. https://doi.org/10.1109/TPAMI.2006.197
[14] Shrestha, B., Ma, D., Zhu, Y., Li, H., Saxena, N. (2015). Tap-wave-rub: Lightweight human interaction approach to curb emerging smartphone malware. IEEE Transactions on Information Forensics and Security, 10(11): 2270-2283. https://doi.org/10.1109/TIFS.2015.2436364
[15] Mayagoitia, R.E., Nene, A.V., Veltink, P.H. (2002). Accelerometer and rate gyroscope measurement of kinematics: An inexpensive alternative to optical motion analysis systems. Journal of Biomechanics, 35(4): 537-542. https://doi.org/10.1016/S0021-9290(01)00231-7
[16] Zhao, H., Wang, Z., Qiu, S., Shen, Y., Zhang, L., Tang, K., Fortino, G. (2018). Heading drift reduction for foot-mounted inertial navigation system via multi-sensor fusion and dual-gait analysis. IEEE Sensors Journal, 19(19): 8514-8521. https://doi.org/10.1109/JSEN.2018.2866802
[17] Sprager, S., Juric, M.B. (2015). An efficient HOS-based gait authentication of accelerometer data. IEEE Transactions on Information Forensics and Security, 10(7): 1486-1498. https://doi.org/10.1109/TIFS.2015.2415753
[18] Frank, J., Mannor, S., Precup, D. (2010). Activity and gait recognition with time-delay embeddings. In Proceedings of the AAAI Conference on Artificial Intelligence, 24(1): 1581-1586. https://doi.org/10.1609/aaai.v24i1.7724
[19] Wang, C., Kim, Y., Lee, S.H., Sung, N.J., Min, S.D., Choi, M.H. (2020). Activity and safety recognition using smart work shoes for construction worksite. KSII Transactions on Internet & Information Systems, 14(2). https://doi.org/10.3837/tiis.2020.02.010
[20] Yang, J., Li, Q., Wang, X., Di, P., Ding, H., Bai, Y.,Dong, W., Zhu, S. (2021). Smart wearable monitoring system based on multi-type sensors for motion recognition. Smart Materials and Structures, 30(3): 035017. https://doi.org/10.1088/1361-665X/abdc04
[21] Yu, J., Gao, W., Jiang, W. (2020). Foot pronation detection based on plantar pressure measurement. In Journal of Physics: Conference Series. IOP Publishing, 1646(1): 012041. https://doi.org/10.1088/1742-6596/1646/1/012041
[22] Zhao, S., Liu, R., Fei, C., Zia, A.W., Jing, L. (2020). Flexible sensor matrix film-based wearable plantar pressure force measurement and analysis system. Plos One, 15(8): e0237090. https://doi.org/10.1371/journal.pone.0237090
[23] Peng, X., Feng, Y., Ji, S., Amos, J. T., Wang, W., Li, M., Ai, S., Qiu, X., Dong, Y., Ma, D., Yao, D., Valdes-Sosa, P.A., Ren, P. (2021). Gait analysis by Causal Decomposition. IEEE Transactions on Neural Systems and Rehabilitation Engineering, 29: 953-964. https://doi.org/10.1109/TNSRE.2021.3082936
[24] Gao, W.D., Zhao, Z.W. (2021). Gait phase recognition using fuzzy logic regulation with multisensor data fusion. Journal of Sensors, 2021: 1-13. https://doi.org/10.1155/2021/8776059
[25] Li, W., Lu, W., Sha, X., Xing, H., Lou, J., Sun, H., Zhao, Y. (2021). Wearable gait recognition systems based on MEMS pressure and inertial sensors: A review. IEEE Sensors Journal, 22(2): 1092-1104. https://doi.org/10.1109/JSEN.2021.3131582
[26] Diao, Y., Lou, N., Liang, S., Zhang, Y., Ning, Y., Li, G., Zhao, G. (2021). A novel environment-adaptive timed up and go test system for fall risk assessment with wearable inertial sensors. IEEE Sensors Journal, 21(16): 18287-18297. https://doi.org/10.1109/JSEN.2021.3082982
[27] Nait Aicha, A., Englebienne, G., Van Schooten, K.S., Pijnappels, M., Kröse, B. (2018). Deep learning to predict falls in older adults based on daily-life trunk accelerometry. Sensors, 18(5): 1654. https://doi.org/10.3390/s18051654
[28] Tunca, C., Salur, G., Ersoy, C. (2019). Deep learning for fall risk assessment with inertial sensors: Utilizing domain knowledge in spatio-temporal gait parameters. IEEE Journal of Biomedical and Health Informatics, 24(7): 1994-2005. https://doi.org/10.1109/JBHI.2019.2958879
[29] Baloch, Z., Shaikh, F.K., Unar, M.A. (2022). CNN-LSTM-Based late sensor fusion for human activity recognition in big data networks. Wireless Communications and Mobile Computing, 2022. https://doi.org/10.1155/2022/3434100
[30] Liang, S., Liu, Y., Li, G., Zhao, G. (2019). Elderly fall risk prediction with plantar center of force using convlstm algorithm. In 2019 IEEE International Conference on Cyborg and Bionic Systems (CBS), Munich, Germany, pp. 36-41. https://doi.org/10.1109/CBS46900.2019.9114487
[31] Yu, X., Qiu, H., Xiong, S. (2020). A novel hybrid deep neural network to predict pre-impact fall for older people based on wearable inertial sensors. Frontiers in Bioengineering and Biotechnology, 8: 63. https://doi.org/10.3389/fbioe.2020.00063
[32] Taylor, A.J., Menz, H.B., Keenan, A.M. (2004). Effects of experimentally induced plantar insensitivity on forces and pressures under the foot during normal walking. Gait & Posture, 20(3): 232-237. https://doi.org/10.1016/j.gaitpost.2003.02.001
[33] Long, J.W., Cai, T.P., Huang, X.Y., Zhou, Y.P., Kuang, J., Wu, L. (2020). Reference value for the TUGT in healthy older people: A systematic review and meta-analysis. Geriatric Nursing, 41(3): 325-330. https://doi.org/10.1016/j.gerinurse.2019.11.012
[34] Podsiadlo, D., Richardson, S. (1991). The timed “Up & Go”: a test of basic functional mobility for frail elderly persons. Journal of the American Geriatrics Society, 39(2): 142-148. https://doi.org/10.1111/j.1532-5415.1991.tb01616.x
[35] Pardoel, S., Shalin, G., Nantel, J., Lemaire, E.D., Kofman, J. (2021). Early detection of freezing of gait during walking using inertial measurement unit and plantar pressure distribution data. Sensors, 21(6): 2246. https://doi.org/10.3390/s21062246
[36] Tinetti, M.E. (1986). Performance-oriented assessment of mobility problems in elderly patients. Journal of The American Geriatrics Society, 34(2): 119-126. https://psycnet.apa.org/doi/10.1111/j.1532-5415.1986.tb05480.x
[37] Beck, J.C. (2002). Geriatrics Review Syllabus: A Core Curriculum in Geriatric Medicine. John Wiley & Sons.
[38] Raîche, M., Hébert, R., Prince, F., Corriveau, H. (2000). Screening older adults at risk of falling with the Tinetti balance scale. The Lancet, 356(9234): 1001-1002. https://doi.org/10.1016/S0140-6736(00)02695-7
[39] San-Segundo, R., Navarro-Hellín, H., Torres-Sánchez, R., Hodgins, J., De la Torre, F. (2019). Increasing robustness in the detection of freezing of gait in Parkinson’s disease. Electronics, 8(2): 119. https://doi.org/10.3390/electronics8020119
[40] Yang, J., Nguyen, M.N., San, P.P., Li, X., Krishnaswamy, S. (2015). Deep convolutional neural networks on multichannel time series for human activity recognition. In The International Joint Conferences on Artificial Intelligence, Inc. (IJCAI), 15: 3995-4001. https://dl.acm.org/doi/10.5555/2832747.2832806
[41] Wang, Q., Wu, B., Zhu, P., Li, P., Zuo, W., Hu, Q. (2020). ECA-Net: Efficient channel attention for deep convolutional neural networks. In Proceedings of the IEEE/CVF Conference on Computer Vision and Pattern Recognition, pp. 11534-11542. https://doi.org/10.48550/arXiv.1910.03151
[42] Huang, S., Yang, Y., Liu, W. (2011). An enhanced fall detection approach based on cost sensitivity analysis. In 2011 First ACIS International Symposium on Software and Network Engineering, Seoul, Korea (South), pp. 81-85. https://doi.org/10.1109/SSNE.2011.30