Naveen Sharma![]() | Sarfaraj Mirza
| Sarfaraj Mirza![]() | Ashu Rastogi*
| Ashu Rastogi*![]() | Prasant K. Mahapatra
| Prasant K. Mahapatra![]()
© 2023 IIETA. This article is published by IIETA and is licensed under the CC BY 4.0 license (http://creativecommons.org/licenses/by/4.0/).
OPEN ACCESS
The healing trajectory of diabetic foot ulcers (DFUs) is commonly determined through manual inspection, a method which is often subjective and prone to errors. In an effort to address these limitations, this study explores an artificial intelligence-based, computer-aided assessment technique as an alternative. This approach leverages the power of a Hue, Saturation, and Value (HSV)-based image fusion technique, integrating thermal and visual data to deliver precise wound characterizations. Further, through the deployment of an instance segmentation-based Mask Region-based Convolutional Neural Network (Mask-RCNN), the area of the wound is estimated. This randomized, prospective, single-blind study was conducted over a 12-week period, focusing on neuropathic DFUs (Wagner grade 2) located on the plantar aspect of the foot. Forty-two patients were enrolled, with an average age of 54.28 ±7.45 years and an average ulcer duration of 5.86±2.22 years. The healing trajectory of eight patients, observed weekly, was further analyzed. The absolute temperature difference (ATD) between contralateral ulcer regions was found to be 2.63±1.99℃, with the respective z-score values of ATD providing a significant p-value of 0.000040412 (i.e., p<0.05). The correlation between the ground truth (ulcer area estimation by clinicians using Woundly software) and the proposed method was found to be at an average of 92.50%. The study ultimately concludes that the Mask-RCNN technique, when applied to fused images, can facilitate automated and user-independent assessments of DFUs. This method has the potential to aid in the accurate characterization of healing trajectories, thereby enhancing the overall understanding of wound progression in diabetic patients.
thermal image, image fusion, segmentation, deep learning, diabetic foot, healing trajectory, Mask R-CNN
The majority of countries have designated diabetes, a metabolic disease, as a “public health priority” due to its increasing global prevalence. Diabetic foot ulcer (DFU) is one of the most serious complications of the disease, which can lead to amputation of the lower extremities and even mortality [1, 2]. According to studies, at least 10 percent of diabetics patients will develop DFU in their life span, with the number increasing to 25% depending on lifestyle aspects [3]. DFU may be a consequence of neuropathy, recurrent trauma, foot deformity, or vascular disease, which are long-term consequences of diabetes [4]. Monitoring the wound to assess the efficacy of treatment is an essential component of DFU management. It is important to properly segment the ulcer from the rest of the foot to know the healing status of the foot ulcer. Traditional noninvasive skin assessment techniques of palpation and visual inspection, are useful diagnostic tools, but they don’t reveal full skin integrity abnormalities until skin breakdown has occurred [5]. In clinical practice, physicians rely on basic visual inspection to determine the healing progress of chronic wounds, however, it is fraught with significant inter-and intra-observer variations [6]. As a result, a viable approach is to acquire images of the region of interest (ROI) and segment the ulcer using computer-assisted techniques.
Prior studies have proposed varying methods for wound segmentation and temporal healing progress. These comprise methods ranging from traditional computer vision techniques to cutting-edge deep learning and machine learning techniques. Traditional approaches to wound segmentation in the field of image processing include adaptive thresholding, edge detection, region growth, and clustering [7, 8]. However, these algorithms are susceptible to noise and may lead to over or under segmentation [9]. Classifiers like support vector machine (SVM), multi-layer perceptron (MLP) etc., which use handcrafted features, (COMMA) can also be trained to segment the required ROI [8, 10]. These methods require extensive knowledge to achieve the required precision. On the other hand, it has been observed that algorithms based on deep learning perform better than conventional approaches when it comes to foot ulcer segmentation [11]. An increasing plantar foot temperature is an important indicator of underlying inflammation [12], particularly useful for the diagnosis of charcot foot [13], osteomyelitis [14], and neuropathic ulcers [15]. The majority of imaging techniques reported in the literature for the diagnosis and management of diabetic foot ulcers include either visual [16-18] or thermal image [19, 20] modalities. It ultimately gives clinicians either the external perspective of the wound or the thermal perspective (inflammation). However, when we fused both, i.e., the visual image and the thermal image, we improved the ulcer feature space to detect a more accurate and precise region of interest [21]. In recent times, instance segmentation [22] has been immensely helpful in classifying, detecting, and segmenting the ROIs from an image by distinguishing each object from a class separately. Mask Region-Based Convolutional Neural Network (Mask R-CNN) [23] is considered a state-of-the-art model as a state-of-the-art model for instance segmentation. In this study, we have used Mask R-CNN as a segmentation technique, which has shown promising results. Following are the primary contributions of this paper:
1. Use of a novel thermogram dataset (developed by us) for diabetic foot ulcers that is suitable for Indian healthcare settings. The significance of the dataset was evaluated using statistical methods.
2. Utilizes the image fusion (thermal + visual) technique to enhance the ulcer’s feature space, which ultimately aids in accurately segmenting the foot ulcer.
3. Based on the literature on diabetic foot, this may be the first time that the advanced, deep learning-based Mask R-CNN method has been applied to a fused image to precisely segment an ulcer.
4. Lastly, the proposed technique (healing trajectory) has been clinically validated based on case studies of diabetic foot patients.
The organization of the remaining section of the paper is as follows: Section 2 describes the methodology in detail, including experimental setup, database creation, expert labeling, implementation, etc.; Section 3 describes the experimental results in detail and discusses the important case studies on actual foot patients, and Section 4 summarizes the proposed research.
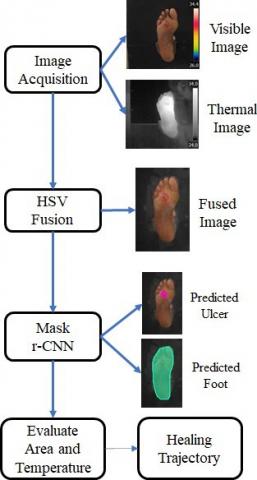
The study was conducted at a diabetic foot clinic of a tertiary care health facility in North India. The protocol was approved (Ref. No-2020/000170) by the Research Ethics Committee of the PGIMER Chandigarh, and infirmed, written consent was obtained from all the participants. The method for evaluating the healing trajectory of a diabetic foot ulcer consisted of the following steps: image acquisition (visible and thermal image), image fusion, ROI segmentation, automatic measurement of the ulcer’s size (weekly) and its thermal parameters, and finally prediction of the ulcer’s healing status as depicted in Figure 1.
2.1 Data acquisition
The imaging setup consists (Figure 2) of three main components i.e., infrared (IR) camera, a thermally insulated foot holding box and subjects (patients). As per the approved protocol, all trials were conducted in a controlled hospital setting. In order to reduce the impact of temperature variations, subjects were instructed to fast for two hours before the study [24]. This assured that the digestive system would not affect the temperature. Also, prior to data collection, adequate rest time (minimum 15 minutes) was given to the subjects to normalise blood circulation. A FLIR E-60 infrared thermo-imaging camera (which gives thermal as well as RGB images) was used to photograph all of the ulcers. This is a non-contact tool for assessing the surface temperature of the targeted ROI. The thermal camera, having an image resolution of 320×240 pixels, thermal sensitivity ¡ 0.05℃ @ 30℃ and ±2℃ or 2% of reading, for ambient temperature of 10℃ to 35℃, field of view (FOV) / minimum focus distance 25°×19° / 0.4 m (1.31 ft.), was lodged in a room space (minimum 2 square meter), and distance (fixed 1 m) between the subject and the IR camera. The observation area was appropriately protected from outside infrared radiation, and the background was kept non-reflective.
Figure 1. Process flow diagram of proposed methodology
Figure 2. Image acquisition setup
2.2 Thermal and visible image fusion
The process of integrating two or more images into one composite image that combines the information contained within the individual images is referred to as image fusion. The purpose of the merging of thermal and visual images in this study was to obtain the finest features to localize the ROI (foot ulcer) [25]. The primary objective of the fusion approach is to effectively overlap the colour value from one image onto the resulting fused image. In this case, the thermal image serves as the overlapping candidate. We used the HSV fusion method (Figure 3) to fuse the visible and thermal images. The Structural Similarity Index (SSIM) was calculated to figure out how well these fusion methods work for each fused image [26].
$\operatorname{SSIM}=\frac{\left(2 \times \bar{x} \times \bar{y}+c_1\right)\left(2 \times \sigma_{x y}+c_2\right)}{\left.\left(\sigma_x^2+\sigma_y^2\right)\right) \times\left((\bar{x})^2+(\bar{y})^2+c_1\right)}$ (1)
The HSV-based fusion was performed on both the thermal and visible images, ensuring that both the visual and thermal properties are intact. HSV-based fusion is described as the HSV color space, which represents how humans see and interpret color using three main components: hue (H), saturation (S), and value (V). The HSV colour space distinguishes between chromatic and achromatic information (H and S, respectively) and expresses them separately. Hue is defined as a 0° to 360° angle that represents the type of colour (red, green, blue, etc.). Saturation is the percentage of gray in a colour that ranges from 0% to 100%. The value of a colour describes its brightness or intensity. The appropriate hues get gradually brighter as V ranges from 0 to 100% [27]. This approach allows for easy interpretation of both thermal and visual information; it preserves the visual information and enhances the thermal information with improved contrast. Many studies have used the HSV fusion method in medical images from different modalities such as Magnetic Resonance Imaging (MRI), Computed Tomography (CT), Single Photon Emission Computed Tomography (SPECT), and Positron Emission Tomography (PET) for better visualization of anatomical and functional information, improved accuracy, and reduced radiation exposure [28-30].
Figure 3. HSV fusion method
2.3 Expert labelling and data annotation
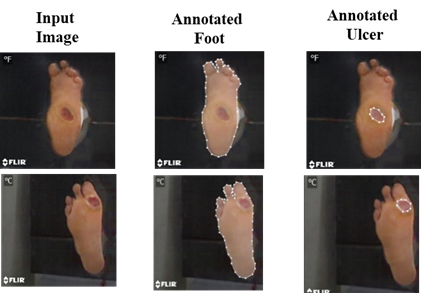
One of the clinical investigators annotated the wound area (ulcer) and the full foot via the annotation tool makesense.ai. The annotations are in Coco format, and both the dataset and the annotations are given to the R-CNN model for training. Data labelling is shown in Figure 4.
Figure 4. Data labelling process
2.4 Features extraction and ROI segmentation
We employed the Mask R-CNN technique for the segmentation of foot ulcers and the whole foot from the fused images [23, 31]. Mask R-CNN relies on region proposals, which are generated via a Region Proposal Network (RPN) (Figure 5). Mask r-CNN follows the Faster r-CNN model by having a feature extractor followed by the RPN. This is then supplemented by an operation known as ROI-Pooling, consisting of three important modifications to produce standard sized outputs suitable for input to a classifier [32]. First, Mask R-CNN replaces the somewhat imprecise ROI-Pooling operation used in Faster R-CNN with an operation called ROI-Align that allows very accurate instance segmentation masks to be constructed; and second, Mask R-CNN adds a network head (a small fully convolutional neural network) to produce the desired instance segmentation. Finally, mask and class predictions are decoupled. The mask network head predicts the mask independently from the network head predicting the class. This entails the use of a multi-task loss function. The loss function [33] of Mask R-CNN is defined as:
$L=L_{\text {class }}+L_{\text {box }}+L_{\text {mask }}$ (2)
where, Lclass + Lbox are identified the same as in Faster R-CNN [34, 35], Lclass + Lbox are defined as:
$\begin{gathered}L_{\text {class }}+L_{\text {box }}=\frac{1}{N_{\text {cls }}} \sum_i L_{\text {cls }}\left(p_i, p_i^*\right)+ \frac{1}{N_{\text {box }}} \sum_i p_i^* L_1^{\text {smooth }}\left(t_i-t_i^*\right)\end{gathered}$ (3)
$L_{\mathrm{cls}}\left(\left\{p_i, p_i^*\right\}\right)=-p_i^* \log p_i^*-\left(1-p_i^*\right) \log \left(1-p_i^*\right)$ (4)
And the Lmask is the average binary cross-entropy loss.
$\begin{gathered}L_{\mathrm{mask}}=-\frac{1}{m^2} \sum_{1 \leq i, j \leq m}\left[y_{i j} \log \circ y_{i j}^k+(1-\right. \left.\left.y_{i j}\right) \log \left(1-\circ y_{i j}^k\right)\right]\end{gathered}$ (5)
where, $p_i$ = predicted probability of anchor i being an object, $p_i^*$ = ground truth label (binary) of whether anchor I is an object, $t_i$ = predicted 4 parameterized coordinates, $t_i^*$ = ground truth coordinates, Ncls = Normalization term, set to be mini-batch size (~2) in the paper, Nbox = normalization term, set to the number of anchor locations (~256).
Figure 5. Mask r-CNN architecture
A total of 42 patients with diabetic foot ulcer (Wagner grade 2) on the plantar aspect of the foot were enrolled to generate patients’ thermal and visual imaging datasets. Eight patients who were followed weekly for their healing trajectory were further analyzed. The remaining patients’ data was utilized to train the proposed deep learning model. The baseline characteristics of the participants are presented in Table 1.
Table 1. Baseline characteristics of subjects enrolled in study
|
Parameter |
Mean ± S.D./ Frequency (%) /Interquartile Range |
|
Total Patient (N) |
42 |
|
Gender |
Male: 85.71% (N=36), Female: 14.29% (N= 6) |
|
Age (Years) |
54.28 ± 7.45, (40 - 69) |
|
BMI (kg/m2) |
25.50 ± 4.23, (17.8 - 37.6) |
|
Duration of Diabetics (Years) |
12.76 ± 7.40, (1 - 20) |
|
Duration of Ulcer (years) |
5.86 ± 2.22, (1 – 72 months) |
|
Smoking |
Yes: 19.04% |
|
Alcoholic |
Yes: 38.09% |
|
Nephropathy |
Yes: 33.33% |
|
Neuropathy |
Yes: 92.85% |
|
HbA1C |
9.60 ± 2.12%, (5.6 - 14)% |
|
Creatinine(mg/dL) |
1.72 ± 0.57, (0.59 - 9) |
|
VPT Score(V) |
46 ± 7.14, (24 - 50) |
|
ABI (Left Foot) |
1.07 ± 0.13, (0.74 - 1.42) |
|
ABI (Right Foot) |
1.10 ± 0.12, (0.59 -1.47) |
|
Random Glucose Level (mg/dL) |
184 ± 80.77, (100.5 - 520) |
Thermal and visual images were fused using image fusion algorithms such as PCA, Laplace pyramid, DCT, DWT, and HSV. The performance of each fusion method was evaluated using the Structural Similarity Index (SSIM) as shown in Table 2. The HSV fusion approach was selected for our dataset based on the SSIM score.
Table 2. Performance result of each fusion method
|
Fusion Method |
SSIM |
|
PCA |
0.7227 |
|
Laplace pyramid |
0.8197 |
|
DCT |
0.8728 |
|
HSV |
0.9018 |
|
DWT |
0.7879 |
Figure 6. Training and validation loss of Mask r-CNN model and predicted ulcer
Figure 7. Training and validation loss of Mask r-CNN model and predicted plantar foot
The fused image dataset was developed based on the HSV fusion method. The ulcer region and the foot region from the developed dataset were annotated and delineated by a medical expert. The annotated dataset was further divided into training and validation (85:15) datasets to train the Mask R-CNN model for each class. To evaluate the performance of the Mask R-CNN model for our dataset, the training loss, validation loss, and predicted validation accuracy for ulcer wound and plantar foot were calculated as shown in Figure 6(a, b, c) and Figure 7(a, b, c) respectively.
As illustrated in Figure 6 (c) and Figure 7 (c), the proposed model predicted and masked the desired ROI. The area and coordinates of each segmented mask of ROI were calculated. And finally, the ulcer-to-foot area ratio is computed (Eq. (6)). The pixel coordinates were used to evaluate the temperature distribution over the ulcer region and the foot region by calculating the mean average temperature enclosed in these coordinates (Eq. (7)).
Ulcer to foot area Ratio (U: F ratio) $=\frac{\text { Ulcer Area }}{\text { Foot Area }}$ (6)
Mean temparture of ROI $\mu_t^R=\frac{1}{N} \sum_{i=1}^N T(i)$ (7)
where, T(i) = temperature value of each pixel in the region R and N = Total count of pixel.
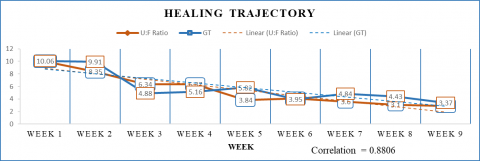
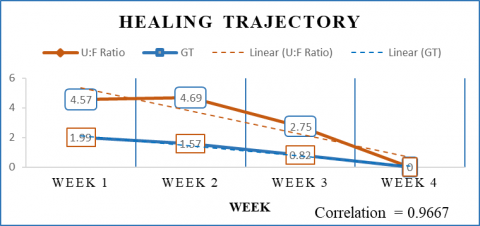
An ulcer-to-foot (U: F) ratio was calculated to monitor the healing status of an ulcer wound. It was validated by correlating the ratio with the ground truth provided by the medical expert. The gound truth (GT) is generated by a single investigator who is an expert in wound management using a semi-automated "Woundly" [36] wound measurement system (woundlyclinical.com) that is calibrated by a phantom before and after each wound measurement. To establish the linear relationship between the U: F ratio and GT, the correlation was calculated and the tradeline was observed for eight case studies.
Along with the status of the healing trajectory of the ulcer, we also studied the contralateral and ipsilateral asymmetry of the foot to help clinicians get more insight about the wound severity and the performance of the developed novel dataset. The mean temperature of each ROI was computed for contralateral and ipsilateral asymmetric changes in temperature values. Table 3 shows the temperature changes during follow-ups in different regions of the plantar foot and the statistical analysis of the dataset.
Table 3. Asymmetric analysis of thermal dataset
|
Analysis |
Data Description |
Statistical Significance |
|
ATD (Ulcer Affected Foot – Non-Affected foot) (Figure 8(a)) |
1.92±1.66 (0.12-6.5) |
z = 2.875 p-value =0.002016949 (p < 0.05) |
|
ATD (Ulcer temp. - Contralateral region temp.) (Figure 8(b)) |
2.63±1.99 (0.0-5.9) |
z = 4.1051 p-value =0.000040412 (p < 0.05) |
|
ATD (Ulcer temp. – Ipsilateral foot temperature) (Figure 8 (c)) |
1.66±1.07 (0.2-4.3) |
z = 2.8244 p-value =0.004736 (p < 0.05) |
To identify the similarity measures and statistical significance of temperature distribution in diabetic plantar foot for our dataset, the mean temperature of affected plantar foot (30.02±2.48℃), non-affected plantar foot (28.39±2.82℃), ulcer wound region (31.27± 2.63℃) and its contralateral region were calculated. Furthermore, these temperature values were used to perform asymmetry analysis on the dataset by calculating the absolute temperature difference (ATD) between ROI’s as shown in Table 3.
Many studies have reported that the temperature difference between an abnormal foot region and its corresponding contralateral foot region is 2.2℃ or higher [37, 38]. As shown in Table 3 and in Figure 8, the ATD of the ulcer compared to its contralateral foot region and ipsilateral foot region follows the pattern reported in the literature.
Furthermore, a statistical method (z-test) is used to assess the significance of the preceding asymmetry analysis for our dataset by considering the null hypothesis (i.e., ATD between two contralateral foot regions is zero for a normal foot). As shown in Table 3, the respective z-score values of ATD yielded the required significant p-value (i.e., p<0.05). Hence, it is possible to conclude that there is a significant mean difference between the asymmetry of the ulcer and its corresponding regions.
3.1 DFU healing progress (trajectory) monitoring for the sub-group
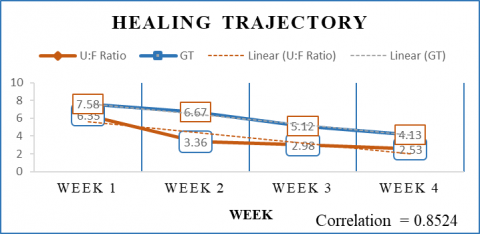
Images and clinical data of eight patients, who followed weekly, were analysed to understand the healing trajectory of the ulcer as shown in Table 4 and in the supplementary Figures S1-S9 in appendix. A representative image of the healing trajectory of one of the patients was shown in Figure 9. The results for the remaining patients are shown in the supplementary figures. The correlation between the ground truth and the obtained results average 0.925, highlighting the significance of the proposed method.
(a) (b) (c)
Figure 8. Comparative plots of regions of plantar foot temperature distribution
Table 4. Baseline patient’s data and weekly progress records
|
Parameters |
Case 1 |
Case 2 |
Case 3 |
Case 4 |
Case 5 |
Case 6 |
Case 7 |
Case 8 |
|
Basic Details |
||||||||
|
Gender |
M |
F |
M |
M |
M |
F |
M |
F |
|
Age |
57 |
50 |
54 |
62 |
54 |
63 |
59 |
41 |
|
BMI(Kg/m2) |
24.1 |
27.7 |
26.6 |
19.8 |
33.3 |
24.6 |
23.2 |
31.7 |
|
Type of Diabetes |
2 |
2 |
2 |
2 |
2 |
2 |
2 |
2 |
|
Neuropathy |
Yes |
Yes |
Yes |
Yes |
Yes |
Yes |
Yes |
Yes |
|
Nephropathy |
No |
Yes |
No |
No |
No |
No |
No |
No |
|
Smoker |
No |
Yes |
No |
No |
No |
No |
No |
No |
|
Alcoholic |
No |
No |
No |
Yes |
No |
No |
No |
No |
|
Duration of Diabetes (Years) |
20 |
12 |
10 |
13 |
13 |
15 |
17 |
18 |
|
Ulcer duration (Month) |
2 |
2 |
1 |
3 |
2 |
1.5 |
1 |
1 |
|
Ulcer Affected Foot |
Right |
both |
Right |
both |
Right |
Right |
Left |
Right |
|
HbA1c |
8.1 |
12.7 |
9.2 |
6.8 |
6.9 |
11.5 |
8.8 |
8.9 |
|
VPT score |
50 |
48 |
36 |
50 |
50 |
50 |
24 |
50 |
|
ABI (Left) |
1.05 |
1.18 |
1.1 |
0.74 |
0.99 |
1.17 |
1.16 |
1.06 |
|
ABI (Right) |
1 |
1.22 |
1.2 |
0.96 |
1.15 |
1.13 |
1.13 |
1.1 |
|
Creatinine |
1.1 |
1.27 |
0.79 |
1.2 |
0.9 |
0.89 |
1.29 |
0.9 |
|
Blood Urea |
29 |
32 |
21 |
26 |
24.3 |
42.8 |
27 |
29.5 |
|
Ulcer Location |
Forefoot |
Midfoot |
Forefoot |
Forefoot |
Forefoot |
Forefoot |
Hindfoot |
Midfoot |
|
Weekly Recoded Details |
||||||||
|
Weeks |
9 |
9 |
8 |
6 |
5 |
4 |
4 |
4 |
|
Room Temperature |
22.12 ±1.22 |
21.08 ±2.13 |
23.12 ±1.63 |
19.15 ±2.98 |
21.31 ±1.08 |
20.62 ±1.45 |
20.42 ±1.47 |
21.75 ±1.78 |
|
Avg. Blood Sugar |
143.05 ±34.14 |
139.7 5±15.96 |
118.52 ±12.16 |
118.75 ±3.11 |
134.28 ±25.62 |
188.87 ±38.11 |
189.78 ±31.62 |
145.12 +14.25 |
|
ATD (Ulcer-Contralateral) |
1.85 ±0.57 |
0.57 ±0.27 |
1.92 ±0.51 |
1.12 ±0.64 |
1.89 ±0.53 |
2.16 ±0.13 |
1.81 ±0.43 |
2.27 ±0.45 |
|
Correlation Coefficient (U: F to GT) |
88.06% |
Right 95.84% Left 96.02% |
90.30% |
Right 87.08% Left 64.67% |
96.28% |
85.24% |
96.85% |
96.67% |
|
Therapy |
TLC |
TLC |
TLC |
TLC |
TLC |
TLC |
TLC |
TLC |
Figure 9. Case 1 Weekly ulcer healing progress
Interventions for DFU require periodic assessment for their efficacy, as it is critical to understand whether the applied therapy is beneficial or requires modification, especially in wounds that are visibly not responding to the offered treatment. The wound healing trajectory is one way to assess the efficacy of treatment. We proposed an imaging-based technique that involves the fusion of thermal and visual images to determine the healing trajectory of a DFU. The present study found a good correlation between fused thermal images and ground truth obtained from automated camera based wound estimation for the assessment of the healing trajectory of a diabetic foot ulcer.
Image fusion, which is extensively used in medical imaging, sensor feed analysis, and satellite imaging, tries to generate new images with an enriched feature map that are more suited to human visual perception. We explored different fusion methods for our dataset, such as DCT Fusion [25], DWT Fusion [39], Laplacian Pyramid Fusion [40], PCA Fusion [37], and HSV Fusion [38, 41]. However, frequency-based techniques extract redundant features, and there is a slight decrease in the colour contrast of the fused image. For PCA fusion, the eigenvectors provide the thermal candidate more weightage since the principal components are more distinct, resulting in the fused image losing desirable features of the visual image. On the other hand, the HSV fusion precisely extracts the desired features, and these features blend with the colour map obtained from the thermal image. In Table 2, the performance of each fusion method was evaluated using the Structural Similarity Index (SSIM), and based on the SSIM score, the HSV fusion approach was selected for our dataset. An instance segmentation method, Mask R-CNN (Mask Region-based Convolutional Neural Network), was used to perform the DFU segmentation, which significantly improved the segmentation result. Basically, Mask R-CNN and CNN are both deep learning models used for image analysis and processing, but their architecture and functionality differ significantly. CNN is a form of deep neural network used for image classification, object detection, and segmentation. It consists of convolutional, pooling, and fully connected layers. Whereas, the Mask R-CNN is an extension of the Faster R-CNN model that involves the addition of a mask prediction branch to the region proposal network. It is used for object detection, segmentation, and instance segmentation tasks. It includes a backbone network, a network for region proposal, and two parallel branches for object detection and mask prediction. The main reason of choosing Mask R-CNN for this study was to segment the foot ulcer properly from the entire foot. It is a good choice for segmentation because it uses a region-based approach to object detection and segmentation, which allows it to accurately identify and segment objects of interest within an image. Unlike traditional CNNs, which require the entire image to be fed through the network, it first generates region proposals and then selectively processes only the regions that are likely to contain objects. The performance of the segmentation technique was validated by the loss function (Figure 6). Several other studies have proposed to segment the DFU from the foot and to know the healing trajectory of the DFU. Cui et al. [16] introduced method of automatic segmentation using CNN model. In this study, author generated a probability map with the help of CNN and the U-Net model on color images. Alzubaidi et al. [42] propose a novel CNN based model, i.e., DFU-QUTNet, to segment the DFU. The focus of the novel CNN model was to increase the architecture’s width rather than the depth of the network to reduce the computational cost and increase efficiency. On the other hand, Brem et al. [43] describes how the healing of foot ulcer is affected by taking into the consideration of pressure point. So far, most of the studies have used color-based image segmentation to segment the DFU without considering the inflammation factor as one of the prime features. In the present study, we used the fusion of colour and thermal features to segment the DFU so that the ulcer boundary could better delineate to assess the healing trajectory of the ulcer.
The strengths of the study include the use of a novel thermogram dataset for DFU, whose significance was corroborated using statistical methods. The database is expected to provide a valuable source to promote research about the potential of infrared thermography for the early diagnosis of diabetic foot problems. The image fusion (thermal + visual) technique enhanced the ulcer’s feature space, which ultimately aids in accurately segmenting the foot ulcer. To the best of our knowledge, this is the first time the advanced, deep learning-based (Mask R-CNN) method has been used on a fused image for precise segmentation of foot wounds. The study was validated based on case studies of diabetic foot patients. It was found that the fusion of thermal and visual images enables the clinician to assess the severity of DFU not only from the external appearance but also from the characterization of peri-wound inflammation, which will help in monitoring the response to treatment. However, the technique’s robustness needs to be tested on a larger number of subjects.
The authors acknowledge CSIR- Central Scientific Instruments Organisation, Chandigarh (India) and Postgraduate Institute of Medical Education and Research (PGIMER) Chandigarh (India) for their support and encouragement in carrying out this research work.
*GT – Ground truth
*U:F Ratio- Ulcer to foot ration
Figure S1. Case 2 Right foot ulcer healing progress
Figure S2. Case 2 Left foot ulcer healing progress
Figure S3. Case 3 ulcer healing progress
Figure S4. Case 4 Left foot progress
Figure S5. Case 4 Left foot progress
Figure S6. Case 5 ulcer healing progress
Figure S7. Case 6 ulcer healing progress
Figure S8. Case 7 ulcer healing progress
Figure S9. Case 8 ulcer healing progress
[1] American Diabetes Association. (2014). Diagnosis and classification of diabetes mellitus. Diabetes Care, 37(Supplement_1): S81-S90. https://doi.org/10.2337/dc14-S081
[2] Reiber, G.E., Vileikyte, L., Boyko, E.D., Del Aguila, M., Smith, D.G., Lavery, L.A., Boulton, A.J. (1999). Causal pathways for incident lower-extremity ulcers in patients with diabetes from two settings. Diabetes Care, 22(1): 157-162. https://doi.org/10.2337/diacare.22.1.157
[3] Cavanagh, P.R., Lipsky, B.A., Bradbury, A.W., Botek, G. (2005). Treatment for diabetic foot ulcers. The Lancet, 366(9498): 1725-1735. https://doi.org/10.1016/S0140-6736(05)67699-4
[4] Gupta, S.K., Rastogi, A., Kaur, M., Malhotra, S., Lakshmi, P.V.M. (2022). Foot self-care behaviour among people with type 2 diabetes mellitus living in rural underserved Area of North India: A Community-Based Cross-Sectional Study. The International Journal of Lower Extremity Wounds. https://doi.org/10.1177/15347346221110074
[5] Chan, K.S., Lo, Z.J. (2020). Wound assessment, imaging and monitoring systems in diabetic foot ulcers: A systematic review. International Wound Journal, 17(6): 1909-1923. https://doi.org/10.1111/iwj.13481
[6] Hani, A.F.M., Arshad, L., Malik, A.S., Jamil, A., Bin, F.Y.B. (2011). Detection and classification of granulation tissue in chronic ulcers. In Visual Informatics: Sustaining Research and Innovations. IVIC 2011. Lecture Notes in Computer Science, vol 7066. Springer, Berlin, Heidelberg. https://doi.org/10.1007/978-3-642-25191-7_14
[7] Jawahar, M., Anbarasi, L.J., Jasmine, S.G., Narendra, M. (2020). Diabetic foot ulcer segmentation using color space models. In 2020 5th International Conference on Communication and Electronics Systems (ICCES), Coimbatore, India, pp. 742-747. https://doi.org/10.1109/ICCES48766.2020.9138024
[8] Wang, L., Pedersen, P.C., Agu, E., Strong, D.M., Tulu, B. (2016). Area determination of diabetic foot ulcer images using a cascaded two-stage SVM-based classification. IEEE Transactions on Biomedical Engineering, 64(9): 2098-2109. https://doi.org/10.1109/TBME.2016.2632522
[9] O’Mahony, N., Campbell, S., Carvalho, A., Harapanahalli, S., Hernandez, G.V., Krpalkova, L., Riordan, D., Walsh, J. (2020). Deep learning vs. traditional computer vision. In: Arai, K., Kapoor, S. (eds) Advances in Computer Vision. CVC 2019. Advances in Intelligent Systems and Computing, vol 943. Springer, Cham. https://doi.org/10.1007/978-3-030-17795-9_10
[10] Song, B., Sacan, A. (2012). Automated wound identification system based on image segmentation and artificial neural networks. In 2012 IEEE International Conference on Bioinformatics and Biomedicine, Philadelphia, PA, USA, pp. 1-4. https://doi.org/10.1109/BIBM.2012.6392633
[11] Wang, C., Anisuzzaman, D.M., Williamson, V., Dhar, M.K., Rostami, B., Niezgoda, J., Gopalakrishnan, S., Yu, Z. (2020). Fully automatic wound segmentation with deep convolutional neural networks. Scientific Reports, 10(1): 21897. https://doi.org/10.1038/s41598-020-78799-w
[12] Bharara, M., Schoess, J., Armstrong, D.G. (2012). Coming events cast their shadows before: Detecting inflammation in the acute diabetic foot and the foot in remission. Diabetes/Metabolism Research and Reviews, 28: 15-20. https://doi.org/10.1002/dmrr.2231
[13] Armstrong, D.G., Lavery, L.A. (1997). Monitoring healing of acute Charcot's arthropathy with infrared dermal thermometry. Journal of Rehabilitation Research and Development, 34(3): 317.
[14] Oe, M., Yotsu, R.R., Sanada, H., Nagase, T., Tamaki, T. (2012). Thermographic findings in a case of type 2 diabetes with foot ulcer and osteomyelitis. Journal of Wound Care, 21(6): 274-278. https://doi.org/10.12968/jowc.2012.21.6.274
[15] Armstrong, D.G., Lavery, L.A. (1996). Monitoring neuropathic ulcer healing with infrared dermal thermometry. The Journal of Foot and Ankle Surgery, 35(4): 335-338. https://doi.org/10.1016/S1067-2516(96)80083-4
[16] Cui, C., Thurnhofer-Hemsi, K., Soroushmehr, R., Mishra, A., Gryak, J., Domínguez, E., Najarian, K., López-Rubio, E. (2019). Diabetic wound segmentation using convolutional neural networks. In 2019 41st Annual International Conference of the IEEE Engineering in Medicine and Biology Society (EMBC), Berlin, Germany, pp. 1002-1005. https://doi.org/10.1109/EMBC.2019.8856665
[17] Fraiwan, L., AlKhodari, M., Ninan, J., Mustafa, B., Saleh, A., Ghazal, M. (2017). Diabetic foot ulcer mobile detection system using smart phone thermal camera: A feasibility study. Biomedical Engineering Online, 16(1): 1-19. https://doi.org/10.1186/s12938-017-0408-x
[18] Goyal, M., Reeves, N.D., Davison, A.K., Rajbhandari, S., Spragg, J., Yap, M.H. (2018). Dfunet: Convolutional neural networks for diabetic foot ulcer classification. IEEE Transactions on Emerging Topics in Computational Intelligence, 4(5): 728-739. https://doi.org/10.1109/TETCI.2018.2866254
[19] Armstrong, D.G., Lavery, L.A., Liswood, P.J., Todd, W.F., Tredwell, J.A. (1997). Infrared dermal thermometry for the high-risk diabetic foot. Physical Therapy, 77(2): 169-175. https://doi.org/10.1093/ptj/77.2.169
[20] Schubert, V., Fagrell, B. (1991). Evaluation of the dynamic cutaneous post-ischaemic hyperaemia and thermal response in elderly subjects and in an area at risk for pressure sores. Clinical physiology, 11(2): 169-182. https://doi.org/10.1111/j.1475-097X.1991.tb00110.x
[21] Li, S., Kang, X., Fang, L., Hu, J., Yin, H. (2017). Pixel-level image fusion: A survey of the state of the art. Information Fusion, 33: 100-112. https://doi.org/10.1016/j.inffus.2016.05.004
[22] Dai, J., He, K., Sun, J. (2016). Instance-aware semantic segmentation via multi-task network cascades. In Proceedings of the IEEE Conference on Computer Vision and Pattern Recognition, pp. 3150-3158. https://doi.org/10.48550/arXiv.1512.04412
[23] He, K., Gkioxari, G., Dollár, P., Girshick, R. (2017). Mask R-CNN. In Proceedings of the IEEE International Conference on Computer Vision, pp. 2961-2969. https://doi.org/10.48550/arXiv.1703.06870
[24] Vardasca, R., Ring, E.F.J., Plassmann, P., Jones, C.D. (2012). Thermal symmetry of the upper and lower extremities in healthy subjects. Thermology International, 22(2): 53-60.
[25] Jin, X., Jiang, Q., Yao, S., Zhou, D., Nie, R., Hai, J., He, K. (2017). A survey of infrared and visual image fusion methods. Infrared Physics & Technology, 85: 478-501. https://doi.org/10.1016/j.infrared.2017.07.010
[26] Ma, J., Ma, Y., Li, C. (2019). Infrared and visible image fusion methods and applications: A survey. Information Fusion, 45: 153-178. https://doi.org/10.1016/j.inffus.2018.02.004
[27] Xin, J., Zhou, D., Yao, S., Nie, R., Yu, C., Ding, T. (2016). Color image fusion based on simplified pulse coupled neural network and HSV color space. In Eighth International Conference on Digital Image Processing (ICDIP 2016), 10033: 395-399. https://doi.org/10.1117/12.2244474
[28] Zhao, Y., Zhao, Q., Hao, A. (2014). Multimodal medical image fusion using improved multi-channel PCNN. Bio-Medical Materials and Engineering, 24(1): 221-228. https://doi.org/10.3233/BME-130802
[29] Bhavana, V., Krishnappa, H.K. (2015). Multi-modality medical image fusion using discrete wavelet transform. Procedia Computer Science, 70: 625-631. https://doi.org/10.1016/j.procs.2015.10.057
[30] Jin, X., Chen, G., Hou, J., Jiang, Q., Zhou, D., Yao, S. (2018). Multimodal sensor medical image fusion based on nonsubsampled Shearlet transform and S-PCNNs in HSV space. Signal Processing, 153: 379-395. https://doi.org/10.1016/j.sigpro.2018.08.002
[31] Anantharaman, R., Velazquez, M., Lee, Y. (2018). Utilizing mask R-CNN for detection and segmentation of oral diseases. In 2018 IEEE International Conference on Bioinformatics and Biomedicine (BIBM), Madrid, Spain, pp. 2197-2204. https://doi.org/10.1109/BIBM.2018.8621112
[32] Muñoz, P.L., Rodríguez, R., Montalvo, N. (2020). Automatic segmentation of diabetic foot ulcer from mask region-based convolutional neural networks. Journal of Biomedical Research and Clinical Investigation, 2(1.1006). https://doi.org/10.31546/2633-8653.1006
[33] Johnson, J.W. (2018). Adapting mask-RCNN for automatic nucleus segmentation. arXiv preprint arXiv:1805.00500. https://doi.org/10.1007/978-3-030-17798-0
[34] Ren, S., He, K., Girshick, R., Sun, J. (2015). Faster R-CNN: Towards real-time object detection with region proposal networks. IEEE Transactions on Pattern Analysis and Machine Intelligence, 39(6): 1137-1149. https://doi.org/10.1109/TPAMI.2016.2577031
[35] Girshick, R. (2015). Fast R-CNN. In Proceedings of the IEEE International Conference on Computer Vision, pp. 1440-1448. https://doi.org/10.48550/arXiv.1504.08083
[36] Rastogi, A., Mukhopadhyay, S., Sahoo, J.P., Ghosh, A., Jha, S., Bal, A. (2022). Intensive glycemic control for diabetic foot ulcer healing: A multicentric, randomized, parallel arm, single-blind, controlled study protocol (INGLOBE study). The International Journal of Lower Extremity Wounds, 21(4): 443-449. https://doi.org/10.1177/1534734620952245
[37] Li, H., Liu, L., Huang, W., Yue, C. (2016). An improved fusion algorithm for infrared and visible images based on multi-scale transform. Infrared Physics & Technology, 74: 28-37. https://doi.org/10.1016/j.infrared.2015.11.002
[38] Restaino, R., Vivone, G., Dalla Mura, M., Chanussot, J. (2016). Fusion of multispectral and panchromatic images based on morphological operators. IEEE Transactions on Image Processing, 25(6): 2882-2895. https://doi.org/10.1109/TIP.2016.2556944
[39] Han, L., Shi, L., Yang, Y., Song, D. (2014). Thermal physical property-based fusion of geostationary meteorological satellite visible and infrared channel images. Sensors, 14(6): 10187-10202. https://doi.org/10.3390/s140610187
[40] Liu, Z., Tsukada, K., Hanasaki, K., Ho, Y.K., Dai, Y.P. (2001). Image fusion by using steerable pyramid. Pattern Recognition Letters, 22(9): 929-939. https://doi.org/10.1016/S0167-8655(01)00047-2
[41] Ding, L., Li, H. (2017). A new improved HSV image fusion method. In LIDAR Imaging Detection and Target Recognition, 10605: 426-438. https://doi.org/10.1117/12.2291610
[42] Alzubaidi, L., Fadhel, M.A., Oleiwi, S.R., Al-Shamma, O., Zhang, J. (2020). DFU_QUTNet: Diabetic foot ulcer classification using novel deep convolutional neural network. Multimedia Tools and Applications, 79(21-22): 15655-15677. https://doi.org/10.1007/s11042-019-07820-w
[43] Brem, H., Balledux, J., Bloom, T., Kerstein, M.D., Hollier, L. (2000). Healing of diabetic foot ulcers and pressure ulcers with human skin equivalent: A new paradigm in wound healing. Archives of Surgery, 135(6): 627-634. https://doi.org/10.1001/archsurg.135.6.627