Naga Venkata RajaReddy Goluguri![]() | Suganya Devi K*
| Suganya Devi K*![]() | Sandhya Devi Gogula
| Sandhya Devi Gogula![]() | Gurpreet Singh Chhabra
| Gurpreet Singh Chhabra![]()
© 2023 IIETA. This article is published by IIETA and is licensed under the CC BY 4.0 license (http://creativecommons.org/licenses/by/4.0/).
OPEN ACCESS
Diseases affecting the Oryza Sativa (rice) plant result in substantial agricultural losses, leading to a decline in crop productivity by up to 25% and posing a significant threat to global food security. Hence, the rapid and accurate diagnosis of such diseases is paramount to ensure effective treatment and to enhance overall plant health. This has led to an increased interest among plant pathologists in developing reliable methods for identifying diseases in Oryza Sativa crops. In this study, an innovative disease classification model for the Oryza Sativa plant is proposed, leveraging the Optimal Adaptive Boosting Cascade Classifier (OABCC) and the efficient-artificial fish swarm optimization (EAFSO). A weighted image fusion technique is utilized in the pre-processing stage for image denoising, combining the outcomes of homomorphic filtering (HAF), Laplace filtering (LAF), and the Kuwahara Filter (KF). The diseased portions of the Oryza Sativa plant leaf are localized using the OABCC, while Soft Non-Maximum Suppression (SN-MS) is deployed to select the optimal detection box for each item. The LeNet model, bolstered with an atrous-convolution layer, is integrated into the OABCC for improved disease classification. Further enhancement in model accuracy is achieved through the application of the EAFSO optimization strategy. When applied to the OABCC-ATRLeNet model for rice disease classification, the EAFSO optimization strategy outperforms other strategies such as WSSO, CSO, AFSO, and PSO. This research underscores the potential of deep learning approaches for robust and accurate classification of plant diseases, contributing significantly to the efforts in securing global food resources.
LeNet, atrous convolution, artificial fish swarm optimization, Oryza Sativa plant diseases
Oryza Sativa, commonly known as rice, serves as a primary source of nutrition for approximately half of the global population [1]. However, the increasing human population continuously exacerbates the demand for consumable food [2]. Compounding this challenge are rice plant diseases, which are emerging as a significant deterrent to agricultural productivity. These diseases, coupled with other factors such as climate change and water scarcity, are discouraging individuals from engaging in rice farming. Notably, the diseases affect the quality of agricultural production, thereby impacting economic growth.
The International Rice Research Institute (IRRI) classifies rice diseases into four categories: seeding disease, foliar-fungal, leaf and culm, and grain diseases [3]. Each category further subdivides based upon the impact on the plant’s life cycle. Early detection and classification of these diseases remain critical for mitigating crop yield loss.
Traditional methods of rice disease diagnosis relied heavily on specialists such as agricultural botanists, resulting in significant overhead costs [4]. However, recent advancements in object identification technology have enabled efficient detection and classification of diseases and pests over short and long timeframes, reducing dependency on specialists. Particularly, deep neural networks have revolutionized image classification in the realm of machine learning [5, 6].
Despite these advancements, external factors such as sunlight and background interference can degrade the quality of original images of the Oryza Sativa plant, leading to low-contrast, blurry images that hamper disease feature identification. Without effective image pre-processing, the model's ability to extract disease features is severely compromised, resulting in poor classification rates [7].
Certain Oryza Sativa plant diseases, such as Leaf Blast and Leaf Smut, exhibit strong similarities, posing additional challenges to the model's discriminative ability [8]. Therefore, enhancing the image dataset is vital for improving feature extraction.
The quality of the output post pre-processing significantly influences the effectiveness of Oryza Sativa plant disease identification [9]. Given the variations in disease distribution, appearance, and texture, along with the tendency of images to darken from the center outward, disease localization classifiers utilizing adaptive boosting have proven effective.
However, the mathematical complexity of such adaptive boosting classifiers increases when applied to large datasets. Selecting the optimal technique can mitigate this complexity. Another issue arises from the overlapping bounding boxes, which may lead to inaccurate classification or lower accuracy scores. This overlapping issue can be resolved using a computer vision approach that selects one entity from multiple overlapping entities.
Optimizers are necessary for tuning neural networks in image classification to achieve high accuracy; they help in choosing the most suitable parameters. While established optimizers exist, many researchers are exploring Meta heuristic algorithms as a natural progression for neural network tuning [10].
Despite extensive research on the first three factors, there is a dearth of investigation on Adaptive boosting classifier and atrous convolution with a pre-trained convolutional neural network model. This research proposes the development of a disease classification model for rice plants, centered on the OABCC-ATRLeNet and the EAFSO optimization method.
The following novel contributions are made in this study:
The remainder of the paper is organised as follows: Related work is explained in section 2, the procedure for the proposed model is described in section 3, the findings are presented in section 4, and the overall study is concluded in section 5.
Sridevi et al. [11] introduced a deep learning-based metaheuristic methodology for paddy leaf disease detection and identification that significantly enhances accuracy, generality, and training performance. For this investigation, they used field images of many kinds of paddy leaf diseases. Using the cuckoo search technique, they fine-tuned the suggested deep convolutional neural network parameters. Their suggested model was evaluated against SVM, RF, and ANN. The findings reveal that the suggested strategy worked flawlessly.
In a study published by Ma et al. [12], they categorised the cucumber plant diseases anthracnose, downy mildew, powdery mildew, and target leaf spots. In the research, they trained and assessed a DCNN model using pictures of healthy and damaged cucumber plants. They put the model to the test against a random forest and a support vector machine. The research's results show that the recommended model performs better than the other models in terms of accuracy. Both balanced and unbalanced datasets were employed in the investigation. The recommended model has been produced as a result of the balanced dataset's higher performance.
Arinichev et al. [13] Presented a research paper applying convolutional neural networks to identify and categorize rice fungal infections. They used a publicly available dataset and also obtained some images from an online source for their research. They removed Rice Hispa illnesses from the overall dataset since they are not common in Russia, and they trained and validated the model using 4278 images from three classes. They tested four models in this study: SqueezeNeq-1.0, DenseNet- 121, GoogleNet, and ResNet-18, and found that DenseNet-121 achieved 95% accuracy, which was the best among the other models.
Türkoğlu and Hanbay [14] have assessed the performance outcomes by means of diverse methods of nine dominant designs of Deep Neural Networks for plant disease detection. The used pre-trained deep replicas are taken into consideration in the offered work for feature mining and for added fine-tuning. The attained structures by means of deep feature extraction are then categorized by SVM, and KNN approaches. The trials are performed by means of data containing the actual disease and pest pictures from Turkey.
Lu et al. [15] have suggested a new disease recognition method in rice centred on DCNN methods. In this study, CNNs are able to accurately identify 10 common rice diseases by comparing images of diseased and healthy rice diseases images collected from a rice research institute. The suggested DCNN model attains a precision of 95.48%. This precision is much greater than the normal ML models.
Zhou et al. [16] have suggested a technique for identifying fast rice disease centred on FCM-KM and Faster R-CNN synthesis to address numerous difficulties with the rice disease images like dust, blurry image brink, huge background intrusion and less recognition correctness. Primarily, the technique utilises a two-dimensional straining mask together with a 2DFM-AMMF filter for sound decline and utilises a Faster 2D-Otsu procedure to decrease the intrusion of multi-faceted circumstantial with the recognition of objective edge in the picture. Pooled with the R-CNN procedure for the recognition of rice diseases has performed well when compared with the other existing models.
Sladojevic et al. [17] have discovered a novel method of utilising deep learning technique with the purpose of robotically cataloguing and perceiving plant diseases from leaf pictures. The established prototype was able to perceive leaf existence and differentiate between good leaves and 13 diverse diseases, which can be visually identified. The comprehensive process was defined correspondingly, from gathering the pictures utilised for training and authentication to image pre-processing and amplification and lastly the process of training the Deep CNN and fine-tuning. Diverse assessments were made so as to verify the performance of the proposed model.
Liang et al. [18] have suggested a new rice blast identification technique based on CNN. A dataset of positive and negative testers is recognized in the CNN prototype. Besides, they made proportional experimentations for qualitative and quantitative examination in their assessment of the efficiency of the suggested technique. Test results demonstrate that the CNN model outperforms conventional ML techniques.
Xiao et al. [19] have suggested a rice blast identification technique to resolve the difficulties of low precision, inadequacy and subjectivity of fake identification of rice blast. Initially, picture of reaped graze was treated, with 6 color structures, 10 morphological aspects, and 5 texture aspects. Furthermore, stepwise reversion examination was utilised to assess the association amid the distinguishing patterns.
Several image processing methodologies and machine-learning classifiers involved in the identification of Oryza Sativa plant disease have been reviewed [20]. It was inferred from the study that all the study presented was largely limited to Rice blasts or Brown spots.
The existing literature review shows that various classifiers may provide diverse classification results. As a result, several research has been done to study the usefulness and efficiency of various classifiers. Also with the widespread usage of image pre-processing methods, there has also been a surge in interest in comparing various deep learning models. While employing various deep learning models, one must keep at least four crucial criteria in mind that might have a significant impact on classification accuracy and efficiency. Pre-processing and Segmentation of images [21], sample selection for training the system, feature extraction, and hyper parameter adjustment are some particular examples [22].
This research work proposes a rice plant disease prediction model based on OABCC- ATRLeNet -EAFSO. In pre-processing, image denoising is performed by means of HAFLAF-KF algorithm. For detecting and classifying the images, OABCC- ATRLeNet is applied. The EAFSO algorithm is introduced to identify the optimal weights for ATRLeNet. The optimally configured ATRLeNet determines the health of the Oryza Sativa leaf (Healthy(RH))/Bacterial leaf blight (RBLB) /Leaf Blast (RLB) /Brown Spot (RBS)). The performance of ATRLeNet -EAFSO is be compared with other existing architectures. Similarly, the performance of ATRLeNet -EAFSO is compared with ATRLeNet-WSSO, ATRLeNet-CSO, ATRLeNet -AFSO and ATRLeNet -PSO. The process flow of the detection model for rice plant disease is shown in Figure 1.
Figure 1. Proposed ATR-LeNet-EAFSO model
3.1 Pre-processing with HAFLAF-KF algorithm
Low illumination issues like backlight will invariably arise throughout the image capture process due to the influence of external elements like sunlight and climate, and the images are susceptible to motion blur and variable brightness, which renders it challenging to identify disease symptoms. In order to address these problem where the disease features are not obvious because of the influence of various exposures like external light during the process of taking Oryza Sativa plant leaf disease images, some studies indicate the use of Laplace filtering to improve the edge details in the image and achieve better the visual clarity [23]. The ability of homomorphic filtering to improve images with low contrast or that are impacted by uneven illumination, such as images of tissues in medical imaging or images captured in low light environments, is what distinguishes it. Homomorphic filtering can show features that would otherwise be difficult to see by changing the brightness and contrast of the image [24]. Such issues can be efficiently solved by the HAFLAF method. In the HAFLAF algorithm, homomorphic filtering(HAF) and the Laplacian filtering(LAF) are combined, and after homomorphic filtering, the resultant high-frequency features are subjected to Laplacian filtering.
3.1.1 Fusion of homomorphic filtering and Laplacian filtering
A popular technique for improving low-light images is HAF. Its main measures are to decrease the amount of low-frequency brightness to equal the brightness and enhance the amount of high-frequency lighting to highlight the details in the low-brightness image. The LAF is very much a classic two-dimensional linear filter that sharpens images by enhancing the image's features using the Laplacian operator. According to the Retinex hypothesis, any image may be thought of as the product of the components of brightness and reflection, denoted by b and re, respectively [25]. Eq. (1) is the mathematical formula. In Eq. (1), the brightness component (b) stands in for the visible light of the image, while the reflection component (r) stands for the object's inherent reflection property. The goal in image enhancement is to extract the most reflection component $r$ while removing the brightness component $b$ from image $i$.
$i(a, b)=b(a, b) \cdot r(a, b)$ (1)
The luminous intensity of the image given by Eq. (1) is adopted by the HAFLAF algorithm. First, Eq. (1) may be obtained by taking the logarithmic on each side and converting the multiplier into some kind of additions shown in Eq. (2). Eq. (2) is then subjected to a Fourier transform to produce Eq. (3) in the frequency domain. $B(x, y)$ is the region of each that corresponds to the low frequency of the brightness component, and $R(x, y)$ is the region which belongs to the high frequency of the reflection portion. The high-frequency constituent mostly conveys the edge information of the image.
$\ln i(a, b)=\ln b(a, b)+\ln r(a, b)$ (2)
$I(x, y)=B(x, y)+R(x, y)$ (3)
The high-frequency components are also filtered by the Laplacian operator to increase the clarity of such edges, curves, and features in the images of the Oryza Sativa plant. The high-frequency component of the pixel has the image grid coordinates (a,b), and the Laplacian operator is denoted by $\nabla^2 r(a, b)$. A derivation of the Laplacian function is:
$\begin{gathered}\nabla^2 r(a, b)=\frac{\partial^2 r}{\partial a^2}+\frac{\partial^2 r}{\partial b^2}= r(a-1, b)+r(a, b+1)+r(a+1, b)+r(a, b-1)-4 r(a, b)\end{gathered}$ (4)
According to Eq. (10), the Laplacian operator would filter the final value by adding its grey values of the left, right, top, and bottom image pixels as well as four times the total of the grey values of the centre pixel in the image. A fixed 3*3 scale frame serves as the Laplacian filter's template, as can be seen in Figure 2.
The LAF value of every pixel can be found by iterating through every pixel in the image that corresponds to the high-frequency region within the Laplacian filter template. This is significant to highlight the Laplace filtering result of the high-frequency region which is denoted by $\mathrm{G}(u, v)$, hence the expression is:
$G(u, v)=\mathrm{R}(u, v)-\mathrm{F}\left[\nabla^2 r(a, b)\right]$ (5)
Figure 2. Template for the Laplacian filter
The HAF function $\mathrm{H}(u, v)$ filters the high- and lowfrequency features after Laplace filtering. The expression from the conventional Butterworth filter function is $\mathrm{H}(u, v)$ which can be seen in Eq. (6). The multiples that represent the augmentation of high-frequency features and the suppression of low-frequency features are represented by the notation $r_h$ and $r_l$, accordingly. $\mathrm{s}$ is denoted as the sharpening coefficient, $D_0$ is denoted as the radius of the cut-off frequency, and $D(u, v)$ is denoted for the distance $(u, v)$ towards the centre of a filter.
$H(u, v)=\frac{r_h-r_l}{1+\left[s \cdot \frac{D_0}{D(u, v)}\right]^{2n}}+r_l$ (6)
The traditional Butterworth filter formula takes into account considerations about high-frequency features as well as low-frequency features. In this study, two improved exponential HAF functions that are able to process the high-frequency and low-frequency attributes have been selected. This was done so that the study could better address the occurrence of non-uniform illumination and poor brightness, as well as enhance the specifics of the shadowy region of the image. The following is an explanation of the improved functions and procedures of the HAF filter:
$H_h(u, v)=\left(r_h-r_l\right) \cdot eϰp \left(-s \cdot \frac{D_0}{D(u, v)}\right)^n+r_l$ (7)
$H_l(u, v)=1-\left[\left(r_h-r_l\right) \cdot eϰp \left(-s \cdot \frac{D_0}{D(u, v)}\right)^n+r_l\right]$ (8)
$H_f(u, v)=H_l(u, v) \mathrm{B}(u, v)+H_h(u, v) \mathrm{G}(u, v)$ (9)
After the high-frequency features and low-frequency features have now been screened by the homomorphic filter functions $H_h$ and $H_l$, Eq. (11) can be generated by simultaneously performing the inverse Fourier transformation on each side of Eq. (10). $z(u, v)$ can be denoted as the processed image by applying the HAFLAF algorithm, which can be seen in Eq. (17).
$h_f(u, v)=h_b(u, v)+h_g(u, v)$ (10)
$z(u, v)=e^{h_f(u, v)}=e^{h_b(u, v)} e^{h_g(u, v)}$ (11)
3.1.2 Kuwahara Filter
A method of spatial filtering known as Kuwahara Filter(KF) employs non-linear image smoothing in order to cut down on the amount of adaptive noise present in the input image. $\mathrm{KF}$ is appropriate for improving color image features. Reducing the contrast ratio of the image may increase the details of low-light conditions, although it is prone to illumination variation. In other words, $\mathrm{KF}$ is a noise reduction filtering method that is appropriate for use in situations that require the preservation of edges. Consider an image $I_m(s, t)$ with a square window with size $2 \mathrm{x}+1$ positioned in the centre of the image at a neighbourhood $(s, t)$. It is possible to split this square into four smaller square(SQ) sections, each of which will be SQ1, SQ2, SQ3, and SQ4.
$S Q_1(s, t)=[s, a+x] X[t, t+x]$ (12)
$S Q_2(s, t)=[s-x, s] X[t, t+x]$ (13)
$S Q_3(s, t)=[s-x, s] X[t-x, t]$ (14)
$S Q_4(s, t)=[s, s+x] X[t-x, t]$ (15)
This implies that, after subdividing the symmetric square neighbourhood around each pixel of an image into four square sub-regions, the result of just the centre pixel is substituted by the mean across the most uniform sub-region, i.e., the sub-region with that with the least standard deviation. As a result, the mean value of the most uniform region will be chosen as the centre pixel. A boundary to have a higher standard deviation depends heavily on where a pixel is in respect to an edge. If a pixel is close to the edge, it will take the value of the area with the least amount of texture and the smoothest surface. The filter uses the mean to produce the blurring effect, but since it considers the homogeneity of the areas, it guarantees that the edges will be preserved. $P_D$ is the detail image generated by subtracting Kuwahara output from the respective original image P. This processing method simplifies the calculation and detection process, but it will cause large errors in the calculation results. To balance this, 0.1 was chosen as the tolerance value because a smaller tolerance value results in a denoised image that is more similar to the original image, with fewer artefacts or distortions.
$P_D=P-P_{\text {Kuwahara }}$ (16)
The focused region has been blurred by applying the Kuwahara Filter while the unfocused area has been left alone, and the details in the focused region have been recorded in the detail images. Now, weights are determined by assessing the strength of the features in these detailed images.
3.1.3 Weighted image fusion of HAFLAF algorithm and Kuwahara Filter
Image fusion aims to merge the outcomes of processing the same image using several algorithms in a way that highlights the features in the image to the greatest possible degree. A straightforward and widely used technique for fusing images is weighted average fusion. The core idea is to first compute an average value of the matching pixels over several pictures, presuming that its weighting coefficient would be optimal, and to induce fusion thereafter. The proposed weighted image fusion method of the HAFLAF algorithm and KF algorithm is shown in Figure 3. An image that is generated by the HAFLAF algorithm can be gained by using Formula (11), designated as $A(x, y)$, as well as the image that is generated by the Kuwahara Filter technique may be acquired by using Eq. (16), marked as $B(x, y)$. The fused image is represented by the symbol $C(x, y)$, where $x$, and $y$ stand for the coordinate values of individual pixels within in the image. Below following is an example of the weighted image fusion technique:
$C(x, y)=\mu A(x, y)+(1-\mu) B(x, y)$ (17)
In each of these, $\mu$ is the weight coefficient, and its values range from 0 to 1. The value of $\mu$ may be altered to meet the requirements. It has been determined via studies on several images that the ideal weight coefficient is between 0.3 and 0.6. The values of 0.3-0.6 is considered based on experiments that have shown that these values provide good results for Oryza Sativa plant leaf disease images. It is important to consider the characteristics of the input images. For example, if one input image has more relevant information than the others, a higher weight coefficient value may be assigned to that image. On the other hand, if the input images have similar levels of relevance, then a lower weight coefficient value may be assigned to each image to achieve a more balanced result.
Following enhancement, the produced image may concurrently benefit from the strengths of the Kuwahara Filter method and the HAFLAF algorithm, overcoming their respective flaws and having a superior image quality. Figures 4, 5 and 6 show the results that are achieved by adopting the image pre-processing approach that has been suggested.
Figure 3. Weighted fusion of HAFLAF algorithm with KW filter
Figure 4. Rice leaf blast (a) Original (b) HAFLAF output c) KF-output d) Weighted fusion output
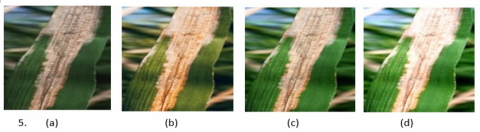
Figure 5. Rice bacterial leaf blight (a) Original (b) HAFLAF output c) KF-output d) Weighted fusion output
Figure 6. Rice brown spot (a) Original (b) HAFLAF output c) KF-output d) Weighted fusion output
3.2 Feature extraction
The feature extraction phase is an important process of computer vision which aims to minimize the more irrelevant feature vectors into less relevant feature vectors. By using an optimal adaptable boosting cascade classifier (OABCC), we can locate the Oryza Sativa disease in an image by identifying its bounding boxes. For object identification, we present a cascade classifier technique. It is indeed a supervised learning method for training a cascade function using examples of positive disease images and negative disease images. The next step is to locate the disease portion on the images. In the proposed work, we feed the pre-processed images into cascade classifiers to build a robust classifier. Each level of the cascade classifier consists of a series of effective classifiers. Every component of this robust cascade classifier is trained using the Ada-boost method. The adaBoost classifier is a sequential learning technique that uses a greedy one-step algorithm as its foundation. It is reasonable to anticipate that using a post-global optimization operation would further improve cascaded AdaBoost classifier performance. We use the Limited-memory Broyden-Fletcher-Goldfarb-Shanno algorithm (L-BFGS), a memory-constrained optimization technique, to optimize the performance of the OABCC. As an output of the OABCC method, an image would be generated in which the affected area has been located using a bounding box.
Depending on the size of the bounding box determined by the OABCC model, a variety of detection boxes of varying sizes are created. The sought-after items are most likely located inside the detection regions. Additionally, the Intersection over Union (IOU) proportion of any box is being identified and the spotted box may be larger than the confidence threshold when there are numerous overlapping objects in the image to be detected. It is certain that miss recognition will occur in this type of situation, leading to a poor classification performance for overlapping items and, ultimately, it would end up with a lower average accuracy. So when the IOU ratio is higher than that of the confidence threshold, retention as well as suppressing strategies are put into effect. This does not remove the detection box but rather reduces its detection score. Using a threshold that is both high and realistically achievable enhances the detection effectiveness on overlapped items and generally boosts accuracy. To choose the optimal detection box for each item, Soft Non-Maximum Suppression (SN-MS) is utilised instead of the standard Non-Maximum Suppression (N-MS). The confidence threshold that is selected can have a substantial effect on the outcomes of an object detection system. Too high a threshold can result in missed detections, while too low a threshold can result in false hits and reduced accuracy. It is frequently essential to conduct an analysis that examines the trade-off between accuracy and recall in order to determine the appropriate confidence threshold. Plotting the precision-recall curve for the object detection system over a variety of threshold values is one method for finding the optimum confidence threshold. By examining the precision-recall curve, we can identify the threshold that maximizes the F1 score, which is the harmonic mean of precision and recall. The F1 score is often used as a single metric to evaluate the overall performance of an object detection system. the confidence threshold is usually set between 0.1 and 0.9 [26], however a higher threshold may be preferred to reduce the number of false positives and increase precision. Hence for this study 0.7 was chosen as confidence threshold.
3.3 Oryza Sativa image classification
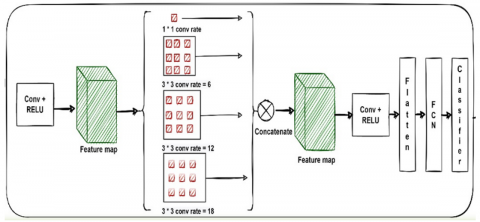
An efficient adaptive boosting cascade classifier is used to train a CNN model, which is then used to make predictions about the likelihood of a given diseased leaf being of a certain type inside the taxonomy of Oryza Sativa leaf diseases. Figure 7 depicts the ATRLeNet architecture employed in this method. It is based on the LeNet design [24]. The conventional LeNet5 model is modified by introducing the atrous convolution layer in between. Using the same technology as the standard LeNet5 model, the ATRLeNet model instead uses an atrous convolution kernel. Considering the same number of parameters, the receptive field size has grown while the training time has decreased. The classic LeNet5 improves network performance by adding more convolution-pooling layers. Even with a larger computation, issues like gradient disappearance and gradient explosion persist. This research builds the ATRLeNet model seen in Figure 7 by substituting the atrous-convolution layer for the normal convolution layer, keeping the same pooling and fully connected layer, and using the softmax function for output matching. When the network requires a wide receptive field, atrous convolution is often used. An atrous convolution is a viable option when both the number and size of convolution kernels have reached a computational ceiling. Atrous convolution, under the same circumstances of computation, may give a bigger receptive field for the network without increasing the number of parameters. Therefore, when the accuracy of atrous convolution is high enough, it outperforms the conventional LeNet5 in the analysis of complicated images and requires much less time to train.
The ATRLeNet architecture that is employed in this technique consists of two convolution-ReLU- Max-pooling layer sets followed by an atrous convolution layer. All the features generated are concatenated and forwarded to the next convolution-ReLU- Max-pooling layer followed by a drop-out, flatten, fully connected layer, drop-out, and soft-max classifier. The input layer chooses a 256x256 pixel image and utilises a multi-channel for depth perception. The initial set of layers consists of two convolutional layers. In both convolution layers, 40 filters of size 5*5 will be trained, and then the ReLU activation function and max-pooling of size 2*2 will be used. The drop-out function comes next, once the convolutional layers have learned 20 filters of size 3*3. 500 densely nodes make up the flattened layer, and they're activated using a ReLU function. The depth of the output class is determined by the depth of its last fully connected layer. Finally, the soft-max classifier is utilised to provide predictions about the probability of each Oryza Sativa leaf disease class. Using the "multi-class cross-entropy" function, as shown in Equation, the model loss can be calculated. To fine-tune the proposed framework, we used efficient artificial fish swarm optimization (EAFSO) [22] instead of the standard Adam optimizer to choose the best weight parameters.
Model Loss $=-\frac{1}{M} \sum_{a=1}^M \sum_{b=1}^N \hat{p}_{a b} \log p_{a b}$ (22)
Figure 7. Proposed ATRLeNet model
The patterns of the dataset may have a significant impact on the performance metrics of classifiers. Two common datasets serve as the foundation for this study. The dataset 1 Rice Leaf Diseases Dataset is accessible through Kaggle's URL [27]. This collection contains 120 JPEG images, all of which show diseased Oryza Sativa plant leaves. There are 120 images in all, with 40 placed in all of the three broad disease categories (BLF, BS, and LS). Next, Huy Min Do's [28] Kaggle dataset has 2839 images of Oryza Sativa plant disease. This entire study’s major emphasis was on three distinct disease categories: RBLB, RLB, and RBS. The dataset is increased to 5942 images after flipping and rotating the data. The procedures of cross-validation, followed by the estimate of performance metrics, are indeed responsible for the effectiveness of the evaluation. The accuracy of neural network classifiers is highly impacted by factors such as the type of training and validation data sets as well as distinguishing features. The classification performance of the Classification algorithm is affected by factors such as the distribution of the data, the value of k, and distance measurements. The classification performance of SVM classifiers is susceptible to being affected by the multi-class classification approach. Nevertheless, we were able to guarantee an objective outcome by using a cross-validation strategy in our study. The classification of diseases affecting Oryza Sativa needed an analysis of the optimum classification system. Disease classification is performed within the optimal parameters selected by the EAFSO Algorithm using the newly proposed ATRLeNet model. To analyse and validate the performance of the proposed ATRLeNet model, we used four alternative models: Artificial Neural Network (ANN), Support Vector Machine (SVM), K-Nearest Neighbours (KNN), and LeNet. To evaluate the effectiveness of the suggested model, we use a three-step process: first, we explore the model using unprocessed datasets. The second phase involves analysing the performance with the use of pre-processed datasets. Finally, we used a number of different meta-heuristic optimization techniques to validate that our proposed model is effective.
4.1 Evaluating the effectiveness of Oryza Sativa disease classification on an unprocessed dataset
The following section depicts the qualitative and quantitative analysis of the proposed EAFSO-optimized ATRLeNet model. The overall performance of the methods on both benchmark datasets is compared in Table 1 and Table 2. By using the feature extraction approach, and by optimising the model with the EAFSO methodology, we evaluate the performance of the model. When applied to dataset 1, optimised classification significantly increased overall accuracy (85.53%), precision (82.23%), F1-measure (78.46%), sensitivity (81.29%) and specificity (85.57%). Additionally, when applied to dataset 2 optimised classification significantly increased overall accuracy (88.61%), precision (85.39%), F1-measure (81.62%), sensitivity (84.45%) and specificity (88.73%).
4.2 Performance analysis of Oryza Sativa disease classification
The following section depicts the qualitative and quantitative analysis of the proposed EAFSO-optimized ATRLeNet model. The overall performance of the methods on both benchmark datasets is compared in Table 3 and Table 4. By using image pre-processing, and feature extraction approach, and by optimising the model with the EAFSO methodology, we evaluate the performance of the model, which is also shown in Figure 8 and Figure 9. When applied to pre-processed dataset 1, optimised classification significantly increased overall accuracy (95.12%), precision (92.43%), F1-measure (88.58%), sensitivity (91.88%) and specificity (95.79%). Additionally, when applied to pre-processed dataset 2, optimised classification significantly increased overall accuracy (98.82%), precision (95.68%), F1-measure (95.27%), sensitivity (95.71%) and specificity (99.21%).
Table 1. Performance evaluation of ATRLeNet- EAFSO model on unprocessed Dataset 1
|
Model |
Accuracy |
Precision |
F1-Measure |
Sensitivity |
Specificity |
|
ANN |
61.35% |
52.33% |
53.04% |
53.04% |
74.07% |
|
KNN |
66.26% |
55.52% |
56.47% |
55.31% |
71.24% |
|
SVM |
73.28% |
65.47% |
66.92% |
66.91% |
77.73% |
|
LeNet |
74.86% |
69.32% |
68.64% |
68.56% |
77.49% |
|
ATR-LeNet- EAFSO |
85.53% |
82.23% |
78.46% |
81.29% |
85.57% |
Table 2. Performance evaluation of ATRLeNet- EAFSO model on unprocessed Dataset 2
|
Model |
Accuracy |
Precision |
F1-Measure |
Sensitivity |
Specificity |
|
ANN |
64.43% |
55.49% |
56.20% |
56.2% |
77.23% |
|
KNN |
69.34% |
58.68% |
59.63% |
58.47% |
74.4% |
|
SVM |
76.36% |
68.63% |
70.08% |
70.07% |
80.89% |
|
LeNet |
77.94% |
72.48% |
71.8% |
71.72% |
80.65% |
|
ATR-LeNet- EAFSO |
88.61% |
85.39% |
81.62% |
84.45% |
88.73% |
Table 3. Performance evaluation of ATRLeNet- EAFSO model on pre-processed Dataset 1
|
Model |
Accuracy |
Precision |
F1-Measure |
Sensitivity |
Specificity |
|
ANN |
76.71% |
70.33% |
71.02% |
71.67% |
84.52% |
|
KNN |
78.15% |
69.01% |
68.58% |
69.35% |
82.85% |
|
SVM |
82.47% |
76.13% |
75.18% |
74.83% |
86.82% |
|
LeNet |
88.15% |
83.43% |
82.87% |
82.91% |
91.17% |
|
ATR-LeNet- EAFSO |
95.12% |
92.43% |
88.58% |
91.88% |
95.79% |
Table 4. Performance evaluation of ATRLeNet- EAFSO model on pre-processed Dataset 2
|
Model |
Accuracy |
Precision |
F1-Measure |
Sensitivity |
Specificity |
|
ANN |
84.05% |
81.37% |
81.01% |
80.76% |
85.63% |
|
KNN |
85.67% |
80.54% |
79.43% |
79.54% |
89.26% |
|
SVM |
91.71% |
88.35% |
88.07% |
88.19% |
94.17% |
|
LeNet |
93.45% |
90.41% |
90.07% |
90.24% |
95.38% |
|
ATR-LeNet- EAFSO |
98.82% |
95.68% |
95.27% |
95.71% |
99.21% |
Figure 8. Performance evaluation of the proposed model with ANN, KNN, SVM, LeNet on Dataset 1
Figure 9. Performance evaluation of the proposed model with ANN, KNN, SVM, LeNet on Dataset 2
4.3 Comparison of classification accuracy and model loss with other optimization techniques
In order to make sure that an ATRLeNet is learning the features of the input image dataset, it is crucial to keep an eye on the model's convergence as it is being trained. This can be accomplished, for example, by examining the convergence graph, which displays the pattern of the loss function and precision over the training epochs. In our research, we used five different optimization methods to examine the convergence graph of our ATRLeNet model to better understand how it was picking up the features that were present in the input image dataset. According to the convergence graph, the loss function initially dropped slowly before steadily approaching a steady state. The model's precision also rose quickly in the early epochs before plateauing at about 98.82%. Our observation that the training loss and accuracy and the validation loss and accuracy followed a comparable pattern demonstrated that our model was not overfitting to the training data.
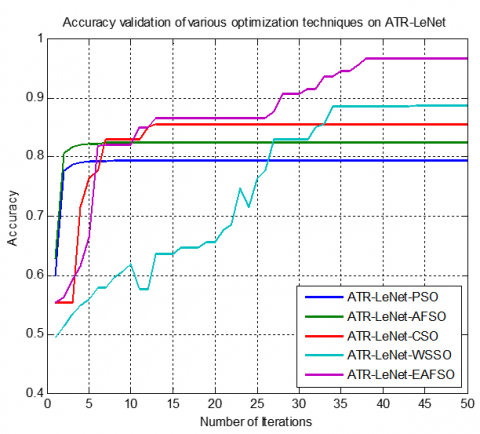
From Figure 10, we can observe that ATRLeNet-EAFSO outperforms the other four optimization techniques in terms of accuracy. ATRLeNet-EAFSO has attained a 98.82% accuracy level. ATRLeNet-WSSO has attained 88.62% accuracy, ATRLeNet-EAFSO-CSO has attained 86.09% accuracy, ATRLeNet-EAFSO-AFSO has attained an accuracy of 83.72% and EAFSO-PSO has attained accuracy of 78.72%. We came to the conclusion that our ATRleNet-EAFSO model was successfully learning the features of the input images and was not overfitting to the training data based on our study of the convergence graph.
Figure 10. Accuracy validation graph of various optimizers on ATRLeNet model
Using HAFLAF-KF and OABCC-ATRLeNet-EAFSO, this work proposes a model for disease classification in the leaves of Oryza Sativa plants. At the conception stage, we used the HAFLAF-KF algorithm to enhance the quality of the Oryza Sativa plant leaf images. In the first stage of the model, the OABCC model is used to locate the disease region on the leaf. This study presented a novel pre-processing and a classification model for Oryza Sativa plant diseases that use the EAFSO algorithm to fine-tune the parameters of the proposed ATRLeNet to improve accuracy, especially for diseases with similar but distinct causes. The ATR-LeNet model extracts features using various-sized convolution cores, then concatenates the features and conducts experimental research on the set of data. We may infer that the classification accuracy is close to 98.82% based on the data from 5942 images utilised in the study. Experiment results validate a model for classifying diseases affecting the Oryza Sativa plant that uses a fusion of the HAFLAF-KF and OABCC-LeNet-EAFSO. The research found that effective image pre-processing may increase model accuracy in the classification of diseases affecting the Oryza Sativa plant. When compared to the proposed model using alternative bio-inspired optimization algorithms, the proposed EAFSO-optimised ATRLeNet model converges faster, saving computational time. The generalizability of the model may be improved by more work on augmenting the image data of Oryza Sativa plant diseases.
[1] Gramene. A resource for comparitive grass genomics. https://archive.gramene.org/species/oryza/rice_intro.html, accessed on 27 May 2023.
[2] Food and Agriculture Organization (FAO): A specialized agency of the United Nations to achieve food security. http://www.fao.org/faostat/en/#home, accessed on 27 May 2023.
[3] Rice Knowledge Bank. Learn about best practices in rice farming. http://www.knowledgebank.irri.org/training/fact-sheets/pest-management/insects/item/rice-hispa, accessed on 27 May 2023.
[4] Shi, Y., Huang, W., Ye, H., Ruan, C., Xing, N., Geng, Y., Dong, Y., Peng, D. (2018). Partial least square discriminant analysis based on normalized two-stage vegetation indices for mapping damage from rice diseases using Planet Scope datasets. Sensors, 18(6): 1901. https://doi.org/10.3390/s18061901
[5] Wang, Y.H., Su, W.H. (2022). Convolutional neural networks in computer vision for grain crop phenotyping: A review. Agrronomy, 12(11): 2659. https://doi.org/10.3390/agronomy12112659
[6] Hang, J., Zhang, D., Chen, P., Zhang, J., Wang, B. (2019). Classification of plant leaf diseases based on improved convolutional neural network. Sensors, 19(19): 4161. https://doi.org/10.3390/s19194161
[7] Saleem, M.H., Potgieter, J., Arif, K.M. (2019). Plant disease detection and classification by deep learning. Plants, 8(11): 468. https://doi.org/10.3390/plants8110468
[8] Huang, Y., Li, R., Wei, X., Wang, Z., Ge, T., Qiao, X. (2022). Evaluating data augmentation effects on the recognition of sugarcane leaf spot. Agriculture, 12(12): 1997. https://doi.org/10.3390/agriculture12121997
[9] Natesan, B., Singaravelan, A., Hsu, J.L., Lin, Y.H., Lei, B., Liu, C.M. (2022). Channel–spatial segmentation network for classifying leaf diseases. Agriculture, 12(11): 1886. https://doi.org/10.3390/agriculture12111886
[10] Kar, A.K. (2016). Bio inspired computing–a review of algorithms and scope of applications. Expert Systems with Applications, 59: 20-32. https://doi.org/10.1016/j.eswa.2016.04.018
[11] Sridevi, S., Kiran Kumar, K. (2022). Optimised hybrid classification approach for rice leaf disease prediction with proposed texture features. Journal of Control and Decision, 1-14. https://doi.org/10.1080/23307706.2022.2141359
[12] Ma, J., Du, K., Zheng, F., Zhang, L., Gong, Z., Sun, Z. (2018). A recognition method for cucumber diseases using leaf symptom images based on deep convolutional neural network. Computers and Electronics in Agriculture, 154: 18-24. https://doi.org/10.1016/j.compag.2018.08.048
[13] Arinichev, I.V., Polyanskikh, S.V., Arinicheva, I.V., Sergeeva, I.O. (2021). Applications of convolutional neural networks for the detection and classification of fungal rice diseases. In IOP Conference Series: Earth and Environmental Science, 699(1): 012020. https://doi.org/10.1088/1755-1315/699/1/012020
[14] Türkoğlu, M., Hanbay, D. (2019). Plant disease and pest detection using deep learning-based features. Turkish Journal of Electrical Engineering and Computer Sciences, 27(3): 1636-1651. http://dx.doi.org/10.3906/elk-1809-181
[15] Lu, Y., Yi, S., Zeng, N., Liu, Y., Zhang, Y. (2017). Identification of rice diseases using deep convolutional neural networks. Neurocomputing, 267: 378-384. https://doi.org/10.1016/j.neucom.2017.06.023
[16] Zhou, G., Zhang, W., Chen, A., He, M., Ma, X. (2019). Rapid detection of rice disease based on FCM-KM and faster R-CNN fusion. IEEE Access, 7: 143190-143206. https://doi.org/10.1109/ACCESS.2019.2943454
[17] Sladojevic, S., Arsenovic, M., Anderla, A., Culibrk, D. (2016). Deep neural networks based recognition of plant diseases by leaf image classification. Computational Intelligence and Neuroscience, 2016: 3289801. https://doi.org/10.1155/2016/3289801
[18] Liang, W.J., Zhang, H., Zhang, G.F., Cao, H.X. (2019). Rice blast disease recognition using a deep convolutional neural network. Scientific Reports, 9(1): 2869. https://doi.org/10.1038/s41598-019-38966-0
[19] Xiao, M., Ma, Y., Feng, Z., Deng, Z., Hou, S., Shu, L., Lu, Z. (2018). Rice blast recognition based on principal component analysis and neural network. Computers and Electronics in Agriculture, 154: 482-490. https://doi.org/10.1016/j.compag.2018.08.028
[20] Goluguri, N.V.R.R., Suganya Devi, K., Vadaparthi, N. (2021). Image classifiers and image deep learning classifiers evolved in detection of Oryza sativa diseases: Survey. Artificial Intelligence Review, 54: 359-396. https://doi.org/10.1007/s10462-020-09849-y
[21] Zhang, Z., Pasolli, E., Crawford, M.M., Tilton, J.C. (2015). An active learning framework for hyperspectral image classification using hierarchical segmentation. IEEE Journal of Selected Topics in Applied Earth Observations and Remote Sensing, 9(2): 640-654. https://doi.org/10.1109/JSTARS.2015.2493887
[22] Goluguri, N.V.R.R., Devi, K.S., Srinivasan, P. (2021). Rice-net: An efficient artificial fish swarm optimization applied deep convolutional neural network model for identifying the Oryza sativa diseases. Neural Computing and Applications, 33(11): 5869-5884. https://doi.org/10.1007/s00521-020-05364-x
[23] Liu, X., Hu, Y., Zhou, G., Cai, W., He, M., Zhan, J., Hu, Y., Li, L. (2022). DS-MENet for the classification of citrus disease. Frontiers in Plant Science, 13: 884464. https://doi.org/10.3389/fpls.2022.884464
[24] Lin, Z., Mu, S., Shi, A., Pang, C., Sun, X. (2018). A novel method of maize leaf disease image identification based on a multichannel convolutional neural network. Transactions of the ASABE, 61(5): 1461-1474. https://doi.org/10.13031/trans.12440
[25] Land, E.H., McCann, J.J. (1971). Lightness and retinex theory. Journal of the Optical Society of America, 61(1): 1-11. https://doi.org/10.1364/JOSA.61.000001
[26] LeCun, Y., Bottou, L., Bengio, Y., Haffner, P. (1998). Gradient-based learning applied to document recognition. Proceedings of the IEEE, 86(11): 2278-2324. https://doi.org/10.1109/5.726791
[27] UCI Irvine Machine Learning Repository. Rice Leaf Diseases. https://archive.ics.uci.edu/ml/datasets/Rice%2BLeaf%2BDiseases, accessed on 27 May 2023.
[28] Kaggle. Rice diseases image dataset. https://www.kaggle.com/minhhuy2810/rice-diseases-image-dataset, accessed on 27 May 2023.