Aditya Dubey*![]() | Rahul Ahirwar
| Rahul Ahirwar![]() | Akhtar Rasool
| Akhtar Rasool![]() | Ankit Kumar
| Ankit Kumar![]() | Sachin Mehra
| Sachin Mehra![]()
© 2023 IIETA. This article is published by IIETA and is licensed under the CC BY 4.0 license (http://creativecommons.org/licenses/by/4.0/).
OPEN ACCESS
The recent emergence of COVID-19 has posed substantial challenges to global health sectors. Given the significant impact of the virus on lung tissues, chest radiography has become a crucial tool in the early screening, detection, and continual monitoring of suspected cases. Among several technologies, X-ray imaging stands as a readily available and promising modality for the diagnosis and prognosis of COVID-19. This study presents a methodology for distinguishing between COVID-19 and non-COVID-19 chest X-ray images, leveraging deep feature extraction and pre-trained Convolutional Neural Networks (CNN). Deep features are extracted using the pre-trained deep CNN models and subsequently fed into a Long Short-Term Memory (LSTM) model for end-to-end training. The observational data set comprised 200 X-ray images from non-COVID individuals and 180 from those diagnosed with COVID-19. Image classification was carried out using a variety of models including Visual Geometric Group 16 (VGG16), Visual Geometric Group 19 (VGG19), InceptionV3, Xception, ResNet50, MobileNet, and DenseNet121, yielding average accuracies of 92.7%, 94.46%, 78.1%, 90.6%, 80.7%, 65%, and 93.4% respectively. However, the inclusion of LSTM networks significantly improved the performance of these models in differentiating between COVID-19 and non-COVID-19 cases. This paper conducts a comparative analysis of various CNN models supplemented with an LSTM network, utilizing chest X-ray images. The outcomes of this study suggest that the proposed methodology could potentially aid clinicians in enhancing their diagnostic accuracy concerning COVID-19.
VGG16, LSTM, feature extraction, low-grade gliomas
The COVID-19 pandemic, originating in Wuhan, China, has rapidly spread worldwide, posing a significant health threat. This disease, known to cause a plethora of symptoms ranging from nerve damage, sleep disorders, and depression to physical discomforts such as fever, dry cough, and fatigue, can deteriorate into severe conditions characterized by respiratory distress, immune system weakness, and nervous system damage [1]. The virus, believed to have originated from a live animal market in Wuhan, exhibits an incubation period between 5 to 14 days, making early detection essential to prevent its progression into severe stages.
In some instances, patients may remain asymptomatic during the initial phase of the disease, with rapid deterioration occurring post this phase due to the destruction of the body's immunity. As per the Centers for Disease Control and Prevention (CDC) recommendations, any individual exposed to the COVID-19 virus should be quarantined for at least 14 days to minimize transmission, particularly when testing procedures are not readily available.
Efficient testing techniques, emergency medication, and treatments are critical in the fight against the swift spread of COVID-19. Diagnostic methods for COVID-19 identification primarily involve radiographic image scanning and symptom monitoring. However, distinguishing between COVID-19 infected images and those of other viral pneumonia can be challenging owing to their similar appearances in standard X-ray images, potentially leading to misdiagnoses [2].
The Real Time Polymerase Chain Reaction (RT-PCR) diagnosis is often used to detect COVID-19 infection, but it requires specific supplies and equipment that may not be widely available, and the process can take between 8 to 12 hours [3]. Furthermore, RT-PCR results can vary significantly depending on the stage of the disease, leading to a high False Negative Rate (FNR), which may incorrectly categorize COVID-19 positive individuals as negative. This necessitates the incorporation of additional medical procedures, such as radiographic imaging, along with RT-PCR testing [4].
Compared to PCR testing, X-ray and CT scan procedures are more reliable and widely available. Among these, X-ray equipment is preferred due to its availability, even in remote locations, lower cost, and the ability to perform imaging reasonably quickly [5].
Deep feature extraction, which leverages features extracted from a pre-trained Convolutional Neural Network (CNN), is used as the foundation [6, 7]. These deep features, retrieved from the fully connected layer, are then input into the classifier's training models. Subsequent classification is carried out using the Long Short-Term Memory (LSTM) model, which capitalizes on the deep features each CNN network has generated [8, 9].
In the proposed methodology, chest X-ray images initially undergo convolution through multiple layer architectures. Following this, the CNN and LSTM model are used to accurately classify COVID-19 cases. This research aims to evaluate the efficacy and applicability of transfer learning in identifying COVID-19 through X-ray medical image analysis. The results demonstrate that a combination of CNNs for feature extraction, transfer learning for processing, and appropriate machine learning techniques for classification serves as an effective method to distinguish between normal and COVID-19 positive cases in X-ray images [10]. Figure 1 represents the X-ray images for COVID positive and negative patients.
Figure 1. Chest X-ray of COVID-19 and non-COVID-19 patients
In DenseNet architecture, each layer in the network is connected to every subsequent layer by DenseNet. Usually, CNNs have issues when they delve further. This is because the distance between the layers of input and output operations (also the gradient in the opposite direction) grows so much that information may be lost before it reaches the other side. The link named "L" between CNN's layer consists of a L (L+1)/2 connections of layer [11]. Characteristics that are a component of the final features developed with the help of any layer over the network may be used and distributed by any tier. In ImageNet and DenseNet, the control reached a maximum error rate of more than 6.1%, although it requires fewer arguments and minimum expense to evaluate other contemporary "CNN" designs like ResNet50. DenseNet was used by Rehman et al., who achieved binary and multi-classification accuracy of 98.75 and 93.46 percent, respectively [12]. Minaee et al. [13] used DenseNet with a lesser accuracy of 75.1% to attain the same sensory factor as the structures mentioned above. But the feature or class maps of every layer are combined with the layer before, which is a drawback of this study, as a result it duplicates the data.
ResNet can be an efficient technique. ResNet adds a component of residual learning. Architecture for a CNN. A common stratum of the remaining unit has an escape connection. The input signal of the layer might disconnect the override connection using the input signal of the layer and the outgoing network layer. There are 34, 50, and 101 layers in other ResNet variations. The most well-liked architecture of CNN may be trained well using ResNet, thanks to its gradient flow. In an uneven dataset, ResNet18 and ResNet-50 were employed by Sethy et al. [14]. For architectures, they obtained a responsiveness score of 98%. ResNet50 indicated an accuracy of up to 89.1% of COVID-19 in cxr. Previous study used three ResNet variants in the SVM category, which include ResNet18, that supports an accuracy of 91.1%. ResNet-50 supports an accuracy of 95.2%. Also, ResNet101 offered 89% accuracy [15]. Precision and ResNet101's accuracy rate was 89.2% [16]. ResNet has shown to be effective in a variety of applications, but one significant problem is that a deeper network often needs days or even weeks for complete training, making it almost unworkable in practical applications [17]. With 340 million images and 16,000 distinct goals, Chollet's Xception outperformed Inception-V3 on numerous image-splitting tasks [13]. In connection with GoogleNet, the core understanding of Xception includes researching various cross-channel statistics and patterns and characteristics in space. It is claimed that a particular layer substitutes IM with a deep-wise distinct convolution at Xception. Inception V3 has an accuracy of 78.2% at the Image Net. In contrast, the splitting convolution layer has few restrictions over the ordinary conversion layer, minimal computation costs, and a total of 79% of accuracy [18].
Deep learning methods have established themselves as industry leaders in recent years by showcasing their potential, efficacy, and adaptability. Computer vision is only one area where they have excelled. One of the imaging procedures that doctors utilize the most. To categorize lung image patches into seven classes, Anthimopoulos et al. [19] introduce a deep CNN while considering six distinct patterns of interstitial lung illnesses and healthy tissue. Deep network infrastructure designed for TB detection is investigated by Pasa et al. [20] Other publications in this field have used transfer learning approaches to execute an efficient learning curve on a small dataset by passing features taken from other bigger datasets in the domain when there is a demand to identify lung cancer using X-rays of chest medical images. Ausawalaithong et al. [21] describe a method based on the technique DenseNet121 and transfer learning. The process is divided into two stages, the first of which is to transfer the model from the normal COVID patient domain to the domain of chest X-ray, enabling the categorization of X-rays of the chest with modules. Then, to classify chest X-ray pictures with the help of malignant modules, the next step of this learning is applied to the specialty of cancer of the lungs. The complete procedure offers a model that is better tailored to the evaluation of lung cancer. So, the authors Chouhan et al. [22] describe a cutting-edge ensemble method based on the same techniques, i.e., transfer learning with the help of 5 different-different Neural network topologies.
VGG architecture is also one of the famous techniques in which the structures for VGGNet with either 16 or 19 trainable parameters, i.e., layers, can be made simpler. Despite having three times as many parameters as AlexNet. Moutounet Cartan looked at a flat multilayer perceptron and five different CNN topologies. Poor (both training and testing sets with approx 53%) sensitivity for pneumonia without COVID-19 indicates that the "CNN" has trouble telling COVID-19 from the disease pneumonia [23]. And the given Sample of X-rays was lesser after considering the number of COVID cases identified in COVID-19. The research was still incomplete since there was less representation for the "Other Pneumonia" class. Additionally, data contained chest X-rays picked up from over 1000+ hospitals, which can compromise sensitivity and accuracy. Furthermore, deep neural network forecasts of PA X-rays cannot stand alone. In the work of Rahaman et al. [24], they also discovered that VGG19 outperformed 14 other deep CNN architectures in test accuracy, coming in at 89.3% with the help of available datasets. Additionally, most pictures present in datasets were considered stationary X-ray equipment. The capture apparatus and the acquisition method influence the chest X-ray picture quality concerning spatial resolution and the occurrence of artifacts or noise. Training VGG-16 is sluggish. In digital radiography, noise is a crucial element that lowers the model's efficiency. As opposed to huge fields like AlexNet, VGG employs relatively tiny receptive fields. Hence, it employs 3×3 with a 1 stride. Because there are now total of 3 ReLU units rather of just one, the decision function is highly discriminative.
AlexNet is one of the most popular techniques used for classification with the help of a transfer learning technique where pre-trained weights are available to use the model directly. LeNet-like in appearance, AlexNet has three layered convolutional layers. In multiclassification and Binary Classification of COVID-19 situations, AlexNet was used by Razzak et al. to address the issue of overfitting [12]. The technique of chest X-ray analysis is the standard imaging procedure performed in medicinal practices. Its potential has been employed mainly for diagnosing and evaluating cardiology and pulmonary disorders. There is an inception package or module on GoogleNet (IM). The bottleneck layer is IM. To begin with, it permits thorough training and reduces the existing quantity of parameters. Next, the output might get lower than the input in terms of the number of feature maps. Consequently, IM minimizes the size of the file. Next, IM is capable of capturing complex specimens at various distances, depths, and postures. Other GoogleNet variations with a small amount of difference in initials have been developed and perform significantly better. In comparison to newer models like VGGNet, GoogLENet, and ResNet, AlexNet is NOT deep enough. There are other GoogleNet variations that perform better and contain somewhat different inception components. The correctness of decisions concerning the sample increased to 98% when Razzak et al. substituted GoogleNet for the technique AlexNet in the COVID-19 health category [12].
Deep feature extraction uses features extracted from a pre-trained CNN as its foundation. The deep features are retrieved from the fully connected layer and sent to the classifier's training models. The LSTM model makes advantage of the deep features each CNN network has produced. The classification process is then carried out, and the effectiveness of each classification model is evaluated. There are several techniques in the market for image classification through convolutional operations. Some techniques are VGG16, VGG19, InceptionV3, Xception, ResNet50, MobileNet, and DenseNet, which acquire an average accuracy of 92.7%, 94.46%, 78.1%, 90.6%, 80.7%, 65%, 93.4% respectively. But when these architectures are Appended with LSTM Network, they perform much better than before. Yet, LSTM only needed nearly half as many parameters as DNN. Its benefit stems from the fact that they can examine lengthy input sequences without growing the network size, while being the slowest to train. So, this paper comprises of comparative study and analysis of various CNN techniques followed by the LSTM network by considering chest X-rays to distinguish between Corona positive patients and negative patients.
The research established a successful chest X-ray-based COVID diagnostic method, which entails two steps: building the model using CNN models and training the LSTM model. The chest X-ray medical images are first processed by various operations that supports convolutional architectures, each of which has multiple layers and weights that have already been trained on ImageNet. This architecture is widely used for the recognition of images as well as texts. It accurately divides 1,000 images into 1,000 different categories. In the second step, the LSTM weights were trained using COVID-19 X-ray medical images to train them with the order of dependency for problems with order predictions. The dataset is split into a training phase and a testing dataset followed by suitable dimensionality and trained eights of the LSTM model with training and validation. It received epoch-specific training. Before and after each consecutive epoch, the training correctness and losses were assessed, and in the final stage, the accuracy tended to 99.99%, and the loss tended to 0.01%. A higher level of predictability for the COVID-19 disease was achieved after the model was tested on available chest X-ray pictures during the training phase.
In the Anaconda Environment, the Spyder platform implements the models included in this paper. The first step is importing the packages. Afterward, a technique called command line argument parser was used. Using a parser was the first step, after which the constant training parameters were declared, followed by creating an output directory. The values were first transformed and parameterized into a NumPy array. Before being iterated across the picture paths in a loop. The following stage involves separating training data from test data for training purposes after utilizing the level binarize. The CNN models were loaded after that, and the base model was frozen before model compilation. Besides preparing the model, the confusion matrix is computed while performing the predictions. The loss and accuracy graphs were plotted, and following that, the model was serialized and stored to disc. The LSTM model is then given the dataset, which predicts the intended output in the next phase, and it also involves specifying and loading the dataset's route.
3.1 VGG16
Virtual Geometric Group, or VGG, is a CNN for classification. It has either 16 layers—the so-called VGG16—or 19 layers—the VGG19. With respect to VGG16, the model architecture consists of 13 convolutional and other fully connected layers, with the convolutional layers using 3×3 kernels and the pooling layers using 2×2 parameters. The convolutional and pooling layers of the VGG16 are separated into blocks 1 through 5, each of which has several convolutional layers and one pooling layer. The pooling layer reduces the picture size after the two convolutional layers in block 1 in block one each employ 16 kernels for feature extraction. The next blocks' design is identical, except that blocks 1 and 2 use two convolutional layers, whereas blocks 3–5 use three convolutional layers with various kernel numbers in each layer to deepen the network and increase accuracy. In the end, three completely interconnected layers combine and output characteristics into two classes. The research that came before it identified several VGG16 issues with feature extraction from medical picture datasets. VGG16 was initially used in the ILSVRC to classify 1 million pictures into 1000 categories. As a result, it significantly underfits when applied to small datasets with few training features. On thoracic X-ray pictures, it has always been challenging to determine if pneumonia is present; image characteristics are too homogenous, making it difficult for models to capture pertinent features. As a result, training deep network layers frequently results in recognition failures. So, to overcome this problem, VGG19 was introduced.
3.2 ResNET50
Another model based on CNN is ResNet50, which has 48 convolutional layers. One Average Pooling layer and one Max Pooling layer make up the remaining two layers. CNN was able to work with numerous layers because of ResNet architecture. A ResNet is a Residual Network variation with 50 deep layers, known as ResNet-50. They consist of several average pooling convolutional units, the ResNet-50 design. Softmax is used for the final layer of categorization.
The 50-layer ResNet design is made up of the elements described below:
3.3 Inception V3
The Inception V3, a core model first presented as Google Net in 2014, is an improved version of the Inception V1. It is a great technique for deep transfer learning that detects images using the Inception-v3 architecture and produces greater values of accuracy, sensitivity, and specificity for categorizing images. It uses pre-trained weights displayed from the more than a million-image ImageNet database. The pre-trained network can classify images into 1000 categories, each type denoting a distinct object. Architecture for Inception V3 with 11 Inception modules that constituted an image-wise categorization and five layers for convolution, one average pooling layer, two max-pooling layers, and one completely related (FC) layer. Forward and backward propagating is the fundamental principle behind training in Inception V3 and other neural network architecture. It includes a 5×5 convolutional layer, which was computationally expensive, as was previously mentioned. To lower the processing cost, two 3×3 convolutional layers were used instead of a 5×5 convolutional layer. Even though there are minor convolutions within the bigger ones. Based on well-honed transfer learning techniques, the Inception V3 network delivers an effective way to analyze and predict diseases.
3.4 Xception
To reduce the operational costs, 2 3×3 convolutional layers were applied in place of 5×5 convolution layers. Even though smaller convolutions can be found within the larger ones. The Inception V3 network offers an efficient method for analyzing and forecasting diseases because it is built on well-honed transfer learning algorithms. A hypothesis based on the Inception module is known as "Xception", It produces a correlation of cross-channels and spatial correlations inside CNN feature maps that can be fully dissociated. The generic Inception module from Inception v3 uses cross-channel correlations by splitting the input data into four groups, applying averaged pooling and convolution sizes of 1×1, and then mapping correlations using convolution sizes of 3×3. The notion is allegedly developed into the Xception module in Inception. When data is input, a single 1×1 convolution size is used to generate independent 3×3 convolution sizes without average pooling. These sizes are applied in non - overlapped regions of the output channels before being fed forward for concatenation. The Xception module operates correlations of cross-channels and spatial relations with fully decoupled maps and is more durable than the Inception module. The depth-wise separable convolution layers are the important layers of Xception. These can lower the calculation and model variables arranged in the color channel's depth and spatial dimensions. This is accomplished by generating a convolution that divides the conventional convolution process more thoroughly into depth-wise convolution and point-wise convolution one-to-one kernel that runs the depth-wise separable convolution.
3.5 MobileNet
CNN design is used to generate the pre-trained MobileNet. Thus, MobileNet consists of many convolutional layers, many types of pooling layers, and one fully connected layer. So, the distinct qualities and properties of the dataset images will be processed and extracted by the "mobile net layers." TensorFlow is used to build customized layers over the MobileNet that has already been trained to improve the neurons and weights of the network's understanding and ability to perform the required job (classification) accurately; more custom layers are added. The "mobile net layers" and newly constructed custom layers will make the final network during the ending phase. The pre-trained MobileNet layers are in the "mobile net layers" folder. And the overfitting of the model is dealt with via the dropout layer. Using the train and test pictures guarantees that the model functions correctly. When training to address overfitting, 0.33% of the total neurons will be randomly removed. The output layer of the whole model is the Dense layer. And this layer Contains only two neurons since the dataset includes two specified output classes. The dataset has two pre-defined classes. Thus, a function with the name sigmoid is employed as an activation function after that. The sigmoid activation function is utilized for binary classification, whereas the softmax activation function is used for multi-label classification.
3.6 DenseNet 121
Different image classification algorithms in medical informatics have been presented for distinct diverse demands due to the rapid growth of artificial intelligence. To detect patients with COVID-19, a novel comparison method will be taken into account regarding the densely connected convolutional networks (DenseNet), which are created with an association of densely linked neurons. The fundamental justification for using DenseNet-121 is that it reduces the vanishing gradient issue, enhances feature reuse, and uses fewer parameters, all of which are beneficial for deep learning model training. Furthermore, based on medical imaging, DenseNet-121 has demonstrated efficacy in diagnosing illness. The idea behind DenseNet is to optimize the architectural flow by connecting every layer to every other layer beneath it. This strategy aids CNN in making decisions based on all levels instead of only the top layer. Compared to conventional image processing techniques, DenseNet is more advanced and capable of capturing visual data on a bigger scale. CNN provides precise medical image classification choices to enable features based on DenseNet.
3.7 LSTM
The RNN Model's drawbacks were addressed with the development of the potent LSTM Model. The enormous states in the memory were too much for the RNN model to handle, and one of the main issues with RNNs was the disappearing gradient. Thus, LSTM avoids all of these situations. The LSTM model receives two inputs at each timestep: a current output from the previous step (shown by h in the picture above) and x, a fresh collection of characteristics related to the current timestep t. H is a zero-vector, and there are N-d procedures for area feature encoding. N is the number of labels we have, and the output at the timestep t is an N-dimensional vector. Since we don't have a list of inputs, the x input at timestep t+1 is only the prediction result from timestep t. When it chooses to, the LSTM terminates. The labels are completed with a unique "END" label. Prediction by the LSTM ends when it produces the "END" code. The LSTM model has a third-order tensor. If there are M ROIs, T timesteps, and N labels, the whole output will be a M x T x N tensor. The result is the most significant probability for each label, which is then mapped to the N-dimensional label space. By definition, this is a max-pooling procedure. It is essential to consider if this model is deployable. Due to the LSTM step, the inference time after significant pre-training is possibly more prolonged than most networks. The combined CNN and LSTM model's well-structured architecture is shown in Figure 2.
The LSTM features feedback connections as opposed to typical feedforward Neural Networks. Such type of Recurrent Neural Network (RNN) can analyse complete data sequences in addition to single data points (like photos). Because of this feature, LSTM networks are excellent for handling and forecasting data. Due to its ability to understand long-term connections between the data time steps, LSTMs are frequently used to learn, analyse, and categorise sequential data. Sentiment analysis, speech recognition, language converter, and video analysis are examples of common LSTM applications.
Figure 2. Combined architecture of CNN and LSTM
4.1 Dataset description
The datasets used in this study came from only one source, i.e., Kaggle Repository. Inside this, the study used the dataset containing chest X-ray medical images in the same repository. The COVID-19 X-ray Images are the key statistical sources for clinicians are these image datasets. In this section, a summary of various datasets is provided. Also, machine learning statistics and mathematical computations are required to examine the CNN feature set. The acquired dataset from the repositories contains 180 X-ray images of COVID-19, and 200 images of non-COVID patients were used to produce this dataset. The size of dataset is reasonable as it does not create any overfitting or underfitting problem. Numerous research took into account even smaller datasets and did well. Such records are hardly available for research studies since COVID-19 is a new illness. Other unhealthy illnesses, including bacterial or viral infections and chronic respiratory problems, may be included in these non-COVID (common) ailments. It could be made up of the combined impact of two or more. Standard instances should ideally not mention a healthy lower respiratory system [25].
4.2 Classification report
The correctness and accuracy of predictions extracted by the classification algorithm are evaluated with the help of a report commonly known as the classification report of a particular Model. How many of the predictions came true, and how many didn't? A categorization report's metrics are more precisely predicted utilizing False Positive (FP), True Negative (TN), True Positive (TP), and False Negative (FN). In addition to identifying natural systems, attaining the economy of memory, and facilitating manipulation, classification's key objectives include describing the composition and connections of groups of related objects. In this section, the results of several methodologies are displayed. Results are initially gathered by different categorization characteristics previously trained CNNs approaches have retrieved. It includes several more terminologies, such as Accuracy, Recall, Precision, F1-Score, and support. The Classification Report of Proposed techniques such as VGG-16, ResNet50, InceptionV3, Xception, MobileNet, and DenseNet121 are depicted in Figures 3-8, respectively.
Figure 3. Classification report of VGG16
Figure 4. Classification report of ResNet50
Figure 5. Classification report of InceptionV3
Figure 6. Classification report of Xception
Figure 7. Classification report of MobileNet
Figure 8. Classification report of DenseNet121
4.3 Evaluation
Figure 9. Confusion matrix of VGG16
Figure 10. Confusion matrix of ResNet50
A confusion matrix is a table used to assess a classification system's effectiveness. The efficacy of a classification algorithm is represented and summarized by a confusion matrix. They compared the predictions provided by the networks with the help of truth labels specified in the dataset allowing researchers to evaluate the success of the suggested strategies. The predicted category, the results that the model was tested on, is represented by columns in the confusion matrix. In contrast, the real category, the COVID-19-positive individual, is represented by rows. A variety of performance measures often used in the literature to evaluate superior computing strategies were then taken into consideration, utilizing as a benchmark the False Positives (FP), True Positives (TP), False Negatives (FN), and True Negatives (TN) generated from this comparison. As a result, each approach's F1-score, Precision, Accuracy, and Recall were calculated separately. The Confusion Matrix of techniques: VGG16, ResNet50, InceptionV3, Xception, MobileNet, and DenseNet121 are Shown in Figures 9-14, respectively.
Figure 11. Confusion matrix of InceptionV3
Figure 12. Confusion matrix of Xception
Figure 13. Confusion matrix of MobileNet
Figure 14. Confusion matrix of DenseNet121
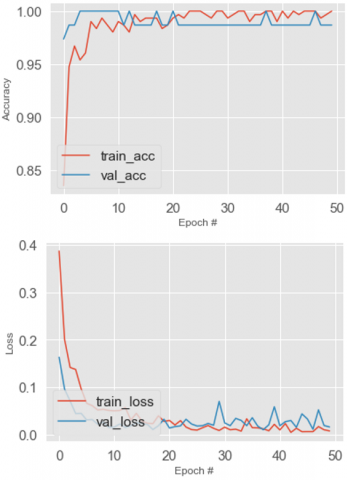
4.4 Accuracy and loss
Figure 15. Train accuracy, valid accuracy, train loss and valid loss of VGG16
To determine the usefulness of the approach and if it functions properly without data loss, accuracy and loss are evaluated. Three hundred eighty chest X-ray medical images through individuals with 200 healthy chests and 180 from COVID-19 instances are included in this study, so a total of 380 images were used to train the models. And the Same Dataset is applied in all the approaches considered in this study. As a result, the COVID-19 and General Binary outcomes were aimed to be balanced, with these constituents remaining in the procedure of testing, cross-validation, and training the equivalent datasets at random intervals. Chest X-ray medical pictures can be classified as positive or negative on COVID-19 using the CNN model. Then after the testing phase, valid loss, valid accuracy, train loss, and train accuracy were evaluated for each model. The Accuracy and Loss for the techniques: VGG16, ResNet50, InceptionV3, Xception, MobileNet, and DenseNet121 are shown in Figures 15-20, respectively.
Figure 16. Train accuracy, valid accuracy, train loss and valid loss of ResNet50
Figure 17. Train accuracy, valid accuracy, train loss and valid loss of InceptionV3
Figure 18. Train accuracy, valid accuracy, train loss and valid loss of Xception
Figure 19. Train accuracy, valid accuracy, train loss and valid loss of MobileNet
Figure 20. Train accuracy, valid accuracy, train loss and valid loss of DenseNet121
In this study, CNN and LSTM models are suggested to categorize COVID-19 patients accurately. The primary goal of the subsequent article is to evaluate the consistency and suitability of transfer learning to identify COVID-19 using an X-ray of the chest. The findings of this study show that an effective way to distinguish between normal and positive COVID-19 instances in X-ray pictures is to gather features using CNNs, process them using the transfer learning idea, and then classify them using appropriate machine learning techniques. The suggested models, such as VGG-16, ResNet50, InceptionV3, Xception, MobileNet, and DenseNet121, achieve a respectable mean accuracy of 96%, 95%, 97%, 99%, 99%, and 97%, respectively, with minimum losses. The LSTM learning efficiency is quicker and offers high-accuracy predictions for the used algorithm compared to old feed-forward network learning methods. Compared to ELM, the conventional tuning-based process requires fewer hidden neurons. Numerous other investigations on LSTM with fixed network designs have been conducted. With the aid of a trained model, it may be simple to categorize COVID-19 and regular non-COVID patients. Following the training process, new X-ray medical image data may be categorized using testing or verification procedures. Additionally, ensembles may be created by combining individual model predictions. The proposed approach has yet to undergo a clinical assessment. As a result, it would not substitute for a medical diagnosis because a comprehensive study requiring a large dataset is needed. The proposed work adds to a reliable, automated, time-efficient, and cost-effective technique of utilizing medical images to aid in treating COVID-19 under specific circumstances. The dataset must be expanded to include COVID-19 patient medical X-rays as they become accessible. Alternatively, it would be better to test the method using an uneven distribution of data.
[1] Yazdanpanah, F., Hamblin, M.R., Rezaei, N. (2020). The immune system and COVID-19: Friend or foe? Life Sciences, 256: 117900. https://doi.org/10.1016/j.lfs.2020.117900
[2] Ahirwar, R., Rasool, A., Chouhan, A., Dubey, A., Mehra S., Kumar, A. (2022). Covid-19 detection based on transfer learning & LSTM Network using X-ray Images. IEEE World Conference on Applied Intelligence and Computing (AIC), Sonbhadra, India, pp. 300-306. https://doi.org/10.1109/AIC55036.2022.9848852
[3] Singh, T., Saurabh, P., Bisen, D., Kane, L., Pathak, M., Sinha, G. R. (2022), Ftl-CoV19: A transfer learning approach to detect COVID-19. Computational Intelligence and Neuroscience, 1687-5265, https://doi.org/10.1155/2022/1953992.
[4] Shukla, M., Rasool, A., Jain, A., Sahu, V., Verma, P., Dubey, A. (2022). In COVID-19 detection using raw chest X-ray images. IEEE World Conference on Applied Intelligence and Computing (AIC), Sonbhadra, India, pp. 320-325.
[5] Nayak, S.R., Nayak, D.R., Sinha, U., Arora, V., Pachori, R.B. (2021). Application of deep learning techniques for detection of COVID-19 cases using chest X-ray images: A comprehensive study. Biomedical Signal Processing and Control, 64: 102365. https://doi.org/10.1016/j.bspc.2020.102365
[6] Çinar, A., Yildirim, M. (2020). Detection of tumors on brain MRI images using the hybrid convolutional neural network architecture. Medical Hypotheses, 139: 109684. https://doi.org/10.1016/j.mehy.2020.109684
[7] Mzoughi, H., Njeh, I., Wali, A., Slima, M.B., BenHamida, A., Mhiri, C., Mahfoudhe, K.B. (2020). Deep multi-scale 3D convolutional neural network (CNN) for MRI gliomas brain tumor classification. Journal of Digital Imaging, 33: 903-915. https://doi.org/10.1007/s10278-020-00347-9
[8] Bhanothu, Y., Kamalakannan, A., Rajamanickam, G. (2020). Detection and classification of brain tumor in MRI images using deep convolutional network. In 2020 6th International Conference on Advanced Computing and Communication Systems (ICACCS), pp. 248-252. https://doi.org/10.1109/ICACCS48705.2020.9074375
[9] Kumar, R.L., Kakarla, J., Isunuri, B.V., Singh, M. (2021). Multi-class brain tumor classification using residual network and global average pooling. Multimedia Tools and Applications, 80: 13429-13438. https://doi.org/10.1007/s11042-020-10335-4
[10] Ahmadianfar, I., Bozorg-Haddad, O., Chu, X. (2020). Gradient-based optimizer: A new metaheuristic optimization algorithm. Information Sciences, 540: 131-159. https://doi.org/10.1016/j.ins.2020.06.037
[11] Dubey, A., Rasool, A. (2019). Data mining based handling missing data. In 2019 Third International conference on I-SMAC (IoT in Social, Mobile, Analytics and Cloud) (I-SMAC), pp. 483-489. https://doi.org/10.1109/I-SMAC47947.2019.9032631
[12] Rehman, A., Naz, S., Khan, A., Zaib, A., Razzak, I. (2022). Improving coronavirus (COVID-19) diagnosis using deep transfer learning. In Proceedings of International Conference on Information Technology and Applications: ICITA 2021, pp. 23-37. https://doi.org/10.1007/978-981-16-7618-5_3
[13] Minaee, S., Kafieh, R., Sonka, M., Yazdani, S., Soufi, G.J. (2020). Deep-COVID: Predicting COVID-19 from chest X-ray images using deep transfer learning. Medical Image Analysis, 65: 101794. https://doi.org/10.1016/j.media.2020.101794
[14] Sethy, P.K., Behera, S.K., Ratha, P.K., Biswas. (2021). Detection of Coronavirus Disease (COVID-19) based on deep features and support vector machine. International Journal of Mathematical, Engineering and Management Sciences, 5(4): 643-651. https://doi.org/10.33889/IJMEMS.2020.5.4.052
[15] Chollet, F. (2017). Xception: Deep learning with depthwise separable convolutions. In Proceedings of the IEEE Conference on Computer Vision and Pattern Recognition, pp. 1251-1258.
[16] Zhang, L., Yang, M., Feng, X. (2011). Sparse representation or collaborative representation: Which helps face recognition? In 2011 International Conference on Computer Vision, pp. 471-478. https://doi.org/10.1109/ICCV.2011.6126277
[17] Wright, J., Yang, A.Y., Ganesh, A., Sastry, S.S., Ma, Y. (2008). Robust face recognition via sparse representation. IEEE Transactions on Pattern Analysis and Machine Intelligence, 31(2): 210-227. https://doi.org/10.1109/TPAMI.2008.79
[18] Wright, J., Ma, Y., Mairal, J., Sapiro, G., Huang, T.S., Yan, S. (2010). Sparse representation for computer vision and pattern recognition. Proceedings of the IEEE, 98(6): 1031-1044. https://doi.org/10.1109/JPROC.2010.2044470
[19] Anthimopoulos, M., Christodoulidis, S., Ebner, L., Christe, A., Mougiakakou, S. (2016). Lung pattern classification for interstitial lung diseases using a deep convolutional neural network. IEEE Transactions on Medical Imaging, 35(5): 1207-1216. https://doi.org/10.1109/TMI.2016.2535865
[20] Pasa, F., Golkov, V., Pfeiffer, F., Cremers, D., Pfeiffer, D. (2019). Efficient deep network architectures for fast chest X-ray tuberculosis screening and visualization. Scientific Reports, 9(1): 6268.
[21] Ausawalaithong, W., Thirach, A., Marukatat, S., Wilaiprasitporn, T. (2018). Automatic lung cancer prediction from chest X-ray images using the deep learning approach. In 2018 11th Biomedical Engineering International Conference (BMEiCON), pp. 1-5. https://doi.org/10.1109/BMEiCON.2018.8609997
[22] Chouhan, V., Singh, S.K., Khamparia, A., Gupta, D., Tiwari, P., Moreira, C., Damaševičius, R., Albuquerque, V.H.C.D. (2020). A novel transfer learning based approach for pneumonia detection in chest X-ray images. Applied Sciences, 10(2): 559. https://doi.org/10.3390/app10020559
[23] Moutounet-Cartan, P.G. (2020). Deep convolutional neural networks to diagnose covid-19 and other pneumonia diseases from posteroanterior chest X-rays. arXiv preprint arXiv:2005.00845. https://arxiv.org/abs/2005.00845
[24] Rahaman, M.M., Li, C., Yao, Y., Kulwa, F., Rahman, M. A., Wang, Q., Qi, S.L., Kong, F.J., Zhu, X.M., Zhao, X. (2020). Identification of COVID-19 samples from chest X-ray images using deep learning: A comparison of transfer learning approaches. Journal of X-ray Science and Technology, 28(5): 821-839. https://doi.org/10.3233/XST-200715
[25] Kaggle Repository. Dataset- Radiography Data. https://www.kaggle.com/tawsifurrahman/COVID19radiographydatabase, accessed on Jan. 17, 2023.