Hamza Osman Ilhan*![]() | Ahmet Elbir
| Ahmet Elbir![]() | Gorkem Serbes
| Gorkem Serbes![]() | Nizamettin Aydin
| Nizamettin Aydin![]()
© 2023 IIETA. This article is published by IIETA and is licensed under the CC BY 4.0 license (http://creativecommons.org/licenses/by/4.0/).
OPEN ACCESS
This study is rooted in the direct correlation between the performance of multivariate techniques and the selection of parameters. The complexity and time-consuming nature of parameter selection, due to the need for exhaustive testing of all available parameters for optimal results, is acknowledged. To mitigate this issue, a novel software tool, integrating nine nature-inspired optimization methods (Differential Evolution, Artificial Bee Colony, Particle Swarm, Cat Swarm, Dragonfly, Black Hole, Bacterial Foraging, Genetic Algorithms, and Simulated Annealing), is proposed. These methods are employed in histogram stretching, a parameter-dependent contrast enhancement technique, with multiplication, addition, and root extraction operations as the target parameters for optimization. In addition to this, histogram equalization, a parameter-independent contrast enhancement technique, is included for the purpose of comparative performance analysis. The software tool, publicly available, provides four performance metrics namely, Mean Square Error, Peak Signal-to-noise Ratio, Structural Similarity Index, and processing times. A rigorous evaluation using the widely recognized Tampere Image dataset indicates that Differential Evolution emerged as the most efficient technique, scoring highest for Structural Similarity Index (0.948) and second best for Mean Square Error (278.05) and Peak Signal to Noise Ratio (26.962). Furthermore, Particle Swarm Optimization demonstrated the fastest time complexity, requiring merely 0.6 sec per image for parameter definition. Notably, it was observed that while histogram equalization tends to degrade original images, the adaptive nature of optimized histogram stretching remains preserved, thereby leaving the image quality unaffected. Such findings highlight the efficacy of the proposed software tool in the optimization and evaluation of contrast enhancement techniques.
image enhancement, Genetic Algorithm (GA), Differential Evolution (DE), Simulated Annealing (SA), Dragonfly Algorithm (DA), Blackhole Algorithm (BH), histogram stretching, histogram equalization
Optimization, a fundamental principle in numerous engineering applications, can be succinctly characterized as the selection of paramount parameters from a multitude of alternatives aimed at achieving optimal performance against specified criteria [1]. This process demands a systematic exploration of each parameter, given that optimal selection in one problem space may not translate to efficacy in another. Therefore, it is of critical importance to encapsulate all potential parameters within an equation to derive an optimal solution. Brute-force search, a manual selection method, is often resource-intensive and time-consuming, making optimization techniques essential in formulating an equation over potential parameter values to ensure a more precise selection.
These optimization techniques find widespread applications in various real-world engineering scenarios, including airspace surveillance systems [2], image processing in embedded systems [3], and automatic parking systems [4]. These methods not only result in superior outcomes but also curtail the complexity, processing time, and memory requirements of operating systems. This is particularly pertinent for real-time systems where rapid response and accurate analysis are indispensable [5].
One such demanding field that necessitates rigorous optimization procedures is image processing, given the high dimensionality of inputs and reliance on parameter-specific algorithms. In this context, optimization becomes an integral part of image processing problems such as edge detection, object segmentation via clustering, classification, object tracking, and image enhancement (IE). This study aims to investigate the performance of nine nature-inspired optimization techniques in the context of IE. To facilitate this, a software tool has been developed to optimize parameters for the given problem.
IE, serving as a crucial pre-processing technique, ensures the delivery of high-quality images for more insightful feature extraction. As outlined by Sawant and Deore [6], IE techniques can be broadly categorized into spatial and frequency domain analyses. Techniques such as histogram stretching (HS) and equalization, negative image, exponential or logarithmic transformation are instances of spatial domain enhancements [7], while frequency-based enhancement techniques primarily depend on various tuned filters [8].
Considering the multiplicity of parameters that most IE techniques rely on, the configuration process becomes both complex and time-consuming. The inherent complexity of images renders many techniques inefficient due to system resource constraints. Herein lies the significance of optimization methods coupled with IE techniques; they deliver superior image enhancements with reduced resources and in less time. However, the efficacy of these enhancements is heavily predicated on the optimization technique employed, necessitating the testing of various techniques within the problem space.
This study encompasses nine nature-inspired optimization methods, namely Particle Swarm Optimization (PSO), Artificial Bee Colony (ABC), Genetic Algorithm (GA), Differential Evolution (DE), Simulated Annealing (SA), Bacteria Foraging Algorithm (BFA), Cat Swarm Optimization (CSO), Dragonfly Algorithm (DA) and Black Hole Optimization (BH). The objective is to offer an investigative platform for these methods in image processing problems. The performance of these nine nature-inspired optimization techniques in the contrast enhancement problem was thoroughly examined. Additionally, a novel software tool was developed to apply these techniques in enhancing various distorted images.
The structure of this paper is as follows: Section 2 provides a comprehensive literature review of the nine nature-inspired optimization methods employed. Section 3 details the tested dataset and elaborates on the contrast enhancement techniques alongside their corresponding optimization techniques. Section 4 presents the experimental results, discussing the images that performed best and worst. Finally, Section 5 encapsulates the conclusions and proposes future research directions.
PSO, inspired by the flocking behavior of birds and schools of fish, was first proposed by Kennedy and Eberhart [9]. Their method has seen several applications in image processing, including work by Malik et al. who implemented PSO and GA on image histograms to enhance the images [10]. Gorai and Ghosh reviewed the usage of PSO and GA in several problem spaces and conducted a comparison study [11].
ABC algorithm is a swarm-based optimization algorithm inspired by honeybees' intelligent foraging behavior [12]. Subramaniam and Radhakrishnan [13] successfully implemented the ABC algorithm for classifying brain cancer images using Neural Networks. Singh compared the ABC algorithm with GA, PSO, and DE in a minimum spanning tree problem and found its performance to be superior or similar, with fewer control parameters [14].
DE, proposed by Storn and Price, optimizes continuous functions [15]. It has been applied in various contexts including IIR-filter optimization [16] and contrast enhancement [17]. Sarangi et al. used DE in a gray-level IE problem and compared it with linear contrast stretching, histogram equalization, and PSO-based IE, with DE yielding the best performance [18].
SA, based on the Metropolis-Hastings Monte Carlo algorithm, optimizes a cost function [19] by inspiring the logic behind the process of annealing in metallurgy. Hoseini and Shayesteh proposed a hybrid algorithm combining GA, Ant Colony Optimization, and SA for increasing the contrast of images, reporting the best performance by this combination [20].
BFA is inspired by bacteria's behavior in perceiving and obtaining nutrients [21]. Hanmandlu et al. employed BFA in an IE problem, proposing an approach to enhance color images using fuzzy logic optimized with BFA [22]. They reported that BFA yielded better performance metrics than GA.
CSO, inspired by the behaviors of tracing and seeking mode of the cats, was first presented by Chu et al. [23]. Çam et al. [24] reported that CSO is faster than PSO in IE but lags in terms of Structural Similarity Index (SSIM).
GA, one of the most well-known optimization algorithms, has seen broad application in image processing and enhancement. Saitoh [25] used GA to enhance gray level images by evaluating the intensity of spatial edges. Hashemi et al. [26] proposed a novel GA-based contrast enhancement method and compared the results with histogram equalization technique.
DA, proposed by Mirjalili [27], is inspired by the behaviors of dragonflies. Some aspects of DA and PSO were combined to propose a Memory based Hybrid Dragonfly Algorithm to solve numerical optimization problems [28].
BH algorithm, based on the black hole phenomena in physics, was introduced by Hatamlou for solving clustering problems [29]. Yaghoobi et al. [30] used BH in a gray-level IE context and compared it with GA, PSO, and histogram equalization techniques.
An in-depth comparison of the different optimization algorithms used in this study is central to the development of the contrast enhancement tool. The literature findings reveal that each algorithm has its unique strengths and limitations, which impacts the outcomes, parameters, and complexities of its implementation. For example, PSO's key strength lies in its ease of implementation and robustness, but it struggles with premature convergence and is sensitive to parameter selection. ABC, in contrast, outperforms other population-based algorithms with fewer control parameters but may not be as effective in high-dimensional problem spaces. GA is versatile and robust, offering high-quality solutions, but it is computationally intensive and may struggle with premature convergence. DE is an effective tool for processing continuous functions and boasts strong global search capability. However, it requires a large population size and may have slow convergence rates. SA provides an excellent global search capability and is not easily trapped in local optimization. On the other hand; it has a slow convergence rate and the cooling schedule is difficult to determine. BFA offers a unique adaptive behavior that can be advantageous, but it may become trapped in local optima and its convergence speed varies with the problem's complexity. CSO is characterized by high exploration capability and simple concept, but its convergence speed is comparatively slow, and it may struggle with dimensional problems. Although the DA offers unique adaptive capabilities and global optimization, it also has slow convergence speed, and its performance varies with the problem's complexity. Lastly, BH provides a robust search capability and simplicity, but it can suffer from premature convergence. These trade-offs underline the importance of selecting the appropriate algorithm for specific tasks, and these factors were carefully considered when developing the contrast enhancement tool. Each of these techniques demonstrates the diversity of approaches to optimization and their applications in image processing. Additionally, they provide a rich context for the current study, which investigates the performance of these nine nature-inspired optimization techniques in the contrast enhancement problem.
This paper primarily focuses on developing an application to explore the integration of optimization theory within the multi-parametric contrast-based IE framework. In this regard, the HS technique was selected for contrast enhancement, and the optimization techniques were applied to determine the tuning parameters. In addition to a parameter-dependent technique, a non-parametric contrast enhancement technique, Automatic Histogram Equalization, was included in the study for comparative analysis of the results.
3.1 Employed dataset
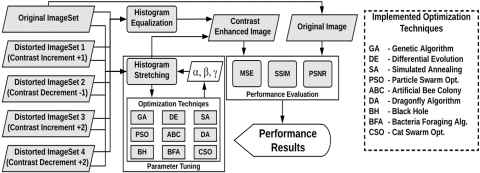
This study utilized images already distorted from the Tampere Image Dataset (TID2008) [31] for tests, comparing the results with those obtained using the standard non-parametric histogram equalization technique. The TID2008 dataset, curated by Ponomarenko et al., encompasses 25 reference images subjected to 17 different distortion effects across four levels. This compilation amounts to a total of 1700 images, each with a resolution of 512×384 pixels. Given that HS, and equalization predominantly affect pixel values, the focus was on adjusting contrast levels. Therefore, only images with contrast-based distortions and their respective levels were selected. The dataset incorporated 100 distorted and 25 original images to evaluate the performance of various techniques. An example of an image subjected to different levels of contrast-based distortion is presented in Figure 1. HS with parameters optimized by different techniques was also tested on original images. This testing aimed to validate the proposed software concerning its impact on distortion. The performance was quantitatively assessed based on several metrics.
Figure 1. a) Original Image, b) Contrast Increment +1, c) Contrast decrements -1, d) Contrast increment +2, e) Contrast decrements -2
3.2 Standard histogram equalization
Histogram equalization represents one of the IE techniques used for adjusting contrast levels. This method involves the automatic alteration of the histogram curve using the pixel-based color space present in the image [32]. The process begins with the computation of the probability mass function (PMF) for all pixels within the image. Subsequently, the cumulative distribution function (CDF) is calculated utilizing the PMF and multiplied by various levels to determine new pixel intensities. The respective formula is presented in Eq. (1), where L symbolizes the multiplication level for the computed CDF and pn denotes the bit number of possible color or intensity values. The terms fi.j and gi.j represent the coordinates of pixels corresponding to the ith row and the jth column, and the generated new image pixel, respectively.
$g_{i . j}=f l o o r\left((L-1) \sum_{n=0}^{f_{i . j}} p_n\right)$ (1)
3.3 Histogram stretching
HS is a simple and effective technique for improving the contrast in an image. It works by spreading out the most frequent intensity values or colors in an image, thus enhancing the contrast. The key parameters of HS are the minimum and maximum intensity values of the image. By stretching the range of intensity values, the contrast of the image can be increased. In the HS technique different mathematical operations can be utilized to enhance the contrast levels [33]. We selected multiplication, addition, and root extraction mathematical operations to be used in HS technique.
The parameters within these operations serve as vital components for obtaining an efficient enhancement algorithm. It is crucial to understand that these parameters are image-specific, meaning a singular parameter cannot be universally applied to all images. Therefore, an adaptive process for parameter adjustment is necessary for each distinct image. In response to this requirement, a software tool incorporating nine nature-inspired optimization techniques for optimizing defined HS parameters is presented within this study. The results procured by this software are thoroughly discussed.
Figure 2. Utilized nature-inspired optimization techniques
The techniques employed within this study are itemized in Figure 2. Each optimization process necessitates a convergence point to terminate the iteration and define the optimal parameters. For this study, Eq. (2) is used to establish these convergence points.
$S_t=\left(\operatorname{argmax}\left(I_t\right)-\operatorname{argmin}\left(I_t\right)+1\right) \times n_t$ (2)
where, I represents the intensity values of image t, and n refers to the number of colors in the histogram chart of image t. The invariability of S within a certain range serves as the convergence criterion for the employed optimization techniques. If the S value remains stable during the last k iterations of the optimization process, then the HS with optimization techniques will be terminated. k can be selected as an arbitrary constant. The stopping criterion is given in Eq. (3).
$\begin{aligned} S_t-20 & <S_t<S_t+20 \\ S_t & =\frac{1}{k} \sum_{q=1}^k S_t^q\end{aligned}$ (3)
Table 1. The key properties of each optimization technique, including the type of problems it is best suited for, its complexity, the number of parameters it requires, its advantages, and its limitations
|
Algorithm |
Suited Problems |
Complexity |
Parameters |
Advantages |
Limitations |
|
PSO |
Continuous, non-linear |
Medium |
Swarm size, inertia weight, cognitive & social parameters |
Simple, fast convergence |
Sensitive to initial conditions, may converge prematurely |
|
ABC |
Continuous, non-linear |
Medium |
Colony size, limit for scout |
Few control parameters, simple |
Slow convergence in complex problems |
|
GA |
Discrete, continuous, combinatorial |
High |
Population size, crossover & mutation rates |
Global search capability |
Computationally expensive, requires parameter tuning |
|
DE |
Continuous, non-linear |
High |
Population size, difference & crossover factors |
Robust against local minima |
Sensitive to parameter settings, slow convergence in high-dimensional problems |
|
SA |
Discrete, continuous, combinatorial |
High |
Initial & final temperatures, cooling schedule |
Avoids local minima |
Requires temperature scheduling, computationally intensive |
|
BFA |
Continuous, non-linear |
Medium |
Population size, elimination & dispersal events |
Thorough search capability |
Slow convergence, high computational cost in complex, high-dimensional problems |
|
CSO |
Continuous, non-linear |
Medium |
Number of cats, mixture ratio for seeking and tracing mode |
Adaptive, mimics cat's behavior |
Sensitive to the number of cats and proportion in each mode |
|
DA |
Continuous, non-linear |
High |
Population size, separation weight, alignment weight, cohesion weight |
Efficient exploration & exploitation |
Parameter tuning is crucial, can get stuck in local optima |
|
BH |
Continuous, non-linear |
High |
Event horizon |
Robust global search capability |
Can ignore better local solutions, sensitive to the event horizon setting |
We defined 100 iterations as the convergence limit with 20 reference zones for all optimization techniques. Eq. (4) indicates the implemented HS formula including multiplication, addition, and root extraction operations.
$g_{i . j}=\sqrt[\gamma]{\alpha \times I_{i . j}+\beta}$ (4)
where, Ii.j is the intensity values of image at ith and jth location. α, β and γ serve as the tuning parameters of the stretching as scaling, shifting, and degrading of the image contrast, respectively. Optimization methods will be applied via the proposed software for the selection process of α, β and γ parameters. gi.j indicates the new pixels obtained through HS. The nature-inspired optimization techniques utilized in the proposed software will be briefly elucidated in the following subsections. Additionally, Table 1 summarizes the key properties of each optimization technique, including the type of problems it is best suited for, its complexity, the number of parameters it requires, its advantages, and its limitations. This will provide a clear overview and facilitate a straightforward comparison of the different optimization techniques.
3.3.1 Particle swarm optimization (PSO)
In the PSO algorithm, a "swarm" is composed of combinations of particles, where each element represents a "particle". The particles initiate the exploration for the optimal solution by taking random values in the solution space. Each particle is composed of two vector components: (a) the position vector 'x', and (b) the velocity vector 'v'. The position vector contains the positional information of the particle, while the velocity vector maintains the information about the change in position and direction of the particles. The essence of PSO lies in transitioning each particle's current position in the swarm to the best personal position ('pbest') identified previously, and the best global position ('gbest') discovered so far. All particles aim to orient themselves towards these two best positions using their velocity vectors. The updating process of velocity and position is calculated using Eq. (5).
$\begin{gathered}x_i^k=(\alpha \beta \gamma) \\ v_i^{k+1}=W . v_i^k+c_1 . \operatorname{rand}_1^k .\left(\text { pbest }_i^k-x_i^k\right)+c_2 . \text { rand }_2^k .\left(\text { gbest }^k-x_i^k\right) \\ x_i^{k+1}=x_i^k+v_i^{k+1}\end{gathered}$ (5)
where, c1 and c2 are the constants for learning parameters leading the particles to its pbest and gbest position. In this study, 2 is selected for $c_1$ and $c_2$. $\operatorname{rand}_1^k$ and $\operatorname{rand}_2^k$ are randomly selected numbers between 0 and 1 in uniform distribution at iteration k. W represents the weight of inertia to be used in definition of balance between local and global searching. vik and xki indicates the velocity and position of ith particle in swarm at iteration k. x refers to the vector including α, β and γ parameters which needs to be optimized in the HS equation Eq. (4) [9-11, 34]. PSO optimizes the HS parameters by mimicking the social behavior of bird flocking. Each particle represents a potential solution and adjusts its position in the search space based on its own best experience and the best experience of the entire swarm. While PSO can quickly converge to an optimal solution, it is sensitive to initial conditions and can suffer from premature convergence.
3.3.2 Artificial bee colony (ABC)
The ABC algorithm comprises two primary components: bees and a food source. Mirroring natural behavior, bees in this algorithm seek out rich food sources in proximity to their hive. Essentially, the ABC algorithm leverages this phenomenon. The algorithm includes three groups of bees: worker bees assigned to specific food sources, onlooker bees observing the dance of worker bees within the hive to select a food source, and scout bees randomly searching for food sources. The ABC algorithm is initialized with Eq. (6) for the HS problem [12-14, 35].
$x_i=l_i+\operatorname{rand}(0.1) .\left(u_i-l_i\right)$ (6)
where, u and l indicate the upper and lower boundaries of the dimension i. rand is a parameter similar to that in the PSO algorithm, representing a randomly selected number between 0 and 1 with a uniform distribution. x stands for the ithsolution in the swarm. After first iteration, each worker bee (xi) generates a candidate solution (vi) by using Eq. (7).
$v_i=x_i+\Phi i \times\left(x_i-x_j\right)$ (7)
xj is the randomly selected worker bee, under the condition that i and j must not be the same. φi is another randomly selected number within [-1, +1] to weight the current worker bee to the optimal solution. If the candidate solution which is represented as vi is better than its parent xi, then update current bee to the candidate by φi. The best values of vi used as α, β and γ parameters in the HS formula as given in Eq. (8). In terms of HS, each food source represents a possible solution, and the nectar amount corresponds to the quality (fitness) of that solution. While ABC has fewer control parameters and is simple to implement, it can be slow to converge in complex problems.
$v_i=[\alpha \beta \gamma]$ (8)
3.3.3 Genetic Algorithm (GA)
GA adopts the principle of evolution, favoring the survival of the fittest individuals in a population and removing the weaker ones. In GA, each individual within the population is represented as a chromosome. The total quantity of chromosomes indicates the size of the population. Each chromosome carries specific values, reflecting their fitness according to the employed GA fitness function. Initially, these chromosome values are selected at random. Subsequently, these values either increase or decrease in accordance with the utilized fitness function. Values that increase gain importance for the next iteration as they come into play during the crossover process. The crossover mechanism allows for superior individuals to intermingle and generate better offspring within the population. Following this, chromosomes undergo mutation at a predetermined rate to avoid becoming stuck in local minima or maxima in the problem space. The algorithm repeats these steps until a predefined stopping condition is reached. The final chromosome, discovered at the conclusion of all iterations, yields the optimal solution to the problem. In this setup, chromosomes comprise three values: α, β, and γ. The optimal values are applied to the HS of an image in accordance with a specific formula Eq. (4). The fitness value is defined as per Eq. (2), following the roulette wheel selection method [25, 26]. In this framework, the HS parameters are treated as genes in a chromosome, and a population of these chromosomes evolves over generations through crossover, mutation, and selection operations. Despite offering global search capabilities, GA can be computationally demanding and necessitate careful parameter tuning.
3.3.4 Differential evolution (DE)
DE algorithm is a simple but powerful algorithm that works population-based like GA. During the iterations in the algorithm, better results are searched for the solution of the problem with the help of operators- selection, mutation, and recombination. In contrast to binary GA, DE uses variables with real values so it can be implemented on continuous problems. Additionally, every operator is not sequentially applied to the entire population. In terms of mutation operator, the difference between GA and DE can be explained as the result of small perturbations to the genes of an individual and the result of arithmetic combinations of individuals, respectively. Especially, the mutation operator is adjusted progressively and updated evolutionary to achieve the best value. In other words, it is not specified as predefined function [15-18, 36]. In HS, DE can identify the optimal set of stretching parameters by balancing exploration and exploitation. However, DE can be sensitive to parameter settings and may suffer from slow convergence speed in high dimensional problems.
3.3.5 Simulated Annealing (SA)
SA is designed to find the maximum or minimum values of functions with a large number of variables. This algorithm and its derivatives have been inspired by the similarity between searching for solutions to an optimization problem and the process of annealing in metallurgy. Annealing describes the process of heating a metal to a certain degree and then gradually cooling it. The annealing process starts with a high temperature value. At this temperature, a random solution is selected from the solution space and the neighbors of this solution are examined by the number of defined iterations. If any of the neighboring solutions produces a better fitness value, then the process is continued with this neighboring solution. In case of failure in neighboring solutions, value is assigned randomly in order to avoid from the local maximum and minimum. When the temperature decreases, the probability of random selection of solutions will also decrease. This probability is calculated according to the Eq. (9).
$\begin{aligned} T & =T \times a \\ \mathrm{~N} & =\mathrm{N} \times \mathrm{k}\end{aligned}$ (9)
The temperature and the number of iterations are reduced according to Eq. (9) where a and k are the predetermined constants in the range (0, 1). T is the temperature and N is the number of iterations. When the temperature reaches its minimum value, the algorithm terminates and determines the optimal α, β and γ parameters [19, 20]. In HS, SA can explore the solution space thoroughly. But it requires careful temperature scheduling and can be computationally intensive.
3.3.6 Bacterial foraging optimization (BFO)
Bacterial Foraging Optimization (BFO) offers a model for the food search behavior of bacteria and simulates certain movements such as "tumbling" or "swimming". BFO's operation can be examined in four processes: Chemotaxis, Swarming, Reproduction, and Elimination. In Chemotaxis, two movements are defined: tumbling and swimming. Swimming refers to moving in the same direction for a certain number of steps, while tumbling represents the random movements of bacteria in search of food sources. In Swarming, bacteria move collectively, forming concentric groups towards the food sources. During reproduction, unfit bacteria are eliminated and those that are sufficiently fit reproduce by splitting. In the elimination step, several bacteria can be eradicated or relocated due to sudden environmental changes. These steps are mathematically implemented in the BFO optimization technique, which was employed in the proposed software to determine the optimal α, β, and γ values. For HS, BFO is capable of thoroughly searching the solution space. However, it should be noted that BFO can suffer from slow convergence speed and high computational costs [21, 22, 37].
3.3.7 Cat swarm optimization (CSO)
CSO is inspired by the behavior of cats, particularly their food-seeking behavior. CSO incorporates two main steps: Seeking and Tracing. In seeking mode, parameters represent the state of a cat visually scanning its environment to decide on its next destination. In tracing mode, parameters depict a cat as it tracks a target and moves closer to it [23, 24, 38, 39]. In the context of HS, it can adaptively select the appropriate mode to locate the optimal stretching parameters. However, its performance may be sensitive to the proportion of cats in each mode and the number of cats, which are parameters that need to be carefully tuned.
3.3.8 Dragonfly Algorithm (DA)
The DA draws its main inspiration from the static and dynamic swarm behavior of dragonflies in nature. The two primary stages of optimization-exploration and exploitation-are modelled after the social interactions of dragonflies during navigation, food search, and evading enemies in static and dynamic scenarios. During the exploration phase, dragonflies form sub-swarms within static swarms, and each of these sub-swarms explores different areas. In the exploitation phase, these sub-swarms communicate with each other and converge to move in one direction within the larger static swarm. From a programming perspective, the position information of dragonflies begins with a certain number of randomly generated particles. The satisfaction rates for all of these particles are subsequently calculated. Distances to food and enemies are calculated based on these satisfaction rates. The parameters are updated according to the dragonflies’ movements, positions, fitness values, and distances to food and enemies using Eq. (10) [27, 28, 40].
$\begin{gathered}S_i=\sum_{j=1}^N X-X_j \\ A_i=\frac{\sum_{j=1}^N V_j}{N} \\ \mathrm{C}_{\mathrm{i}}=\frac{\sum_{j=1}^N X_j}{\mathrm{~N}}-X \\ F_i=X^{+}-X \\ E_i=X^{-}+X\end{gathered}$ (10)
where, S refers to distribution of dragonflies and equals to the sum of the distances between the dragonfly and its neighbors. A indicates the harmony of dragonflies and is equal to the average speed of flocks. C is the distance of each dragonfly to the average positions of flocks and expresses the dragonfly conjunction. F states the distance between the dragonfly and the food source. E refers to the enemy’s distraction and equals to the sum of the position of the dragonfly and the enemy. Lastly, W indicates immobility. These parameters are updated at each step, and the position vectors of the dragonflies, which refers to α, β and γ in our study, are updated by using Eq. (11). For HS, DA provides an efficient exploration and exploitation mechanism. However, parameter tuning is crucial in DA and it can get stuck in local optima.
$\begin{gathered}\Delta \mathrm{X}_i^{\mathrm{t}+1}=\left(\mathrm{sS}_i+\mathrm{aA}_i+\mathrm{cC}_i+\mathrm{fF}_i+\mathrm{eE}_i\right)+\mathrm{w} \Delta \mathrm{X}_i^{\mathrm{t}} \\ X_i^{t+1}=X_i^t+\Delta X_i^{t+1}\end{gathered}$ (11)
3.3.9 Black hole algorithm (BH)
In the BH, the best candidate is chosen as the “black hole” among all candidates in each iteration by using a fitness function. All other candidates are assigned as regular “stars”. Then stars are drifted to the black hole based on their current location and attraction force. If a star gets too close to the black hole, it is swallowed by the black hole and disappears. In this case, a new star is randomly generated, placed in the search field, and a new search is started. The implemented fitness and update functions are given in Eq. (12) and Eq. (13), respectively. Similar to other optimization techniques, updated state parameter (Xi(t)) indicates the optimized parameters α, β and γ in this study [29, 30]. BH excels in global optimization problems but might struggle with local optimization, as it primarily focuses on the global best solution. The performance of BH can be greatly influenced by its only parameter, the event horizon.
$f_{B H}=\sum_{i=1}^{\text {pop_size }} \operatorname{eval}(p(t))$ (12)
$X_i(t)=X_i(t)+\operatorname{rand} \times\left(X_{B H}-X_i(t)\right)$ (13)
3.4 Performance evaluation
Enhanced versions of the distorted images were compared with reference images using various optimization techniques for HS, as well as standard histogram equalization techniques. Performance evaluation was carried out using certain image quality metrics such as Mean Square Error (MSE), Peak Signal to Noise Ratio (PSNR), and Structural Similarity Index (SSIM) [41]. MSE was computed as described in Eq. (14).
$M S E=\frac{1}{N \times M} \sum_{i=0}^{N-1} \sum_{j=0}^{M-1}[X(i . j)-Y(i . j)]^2$ (14)
where, N and M represent the total number of pixels in images as width and height size, respectively. X (i.j) and Y (i.j) represents the pixel values at ith row and jth column of original and contrast enhanced of the distorted images. The PSNR metric, derived from the MSE, can be calculated using Eq. (15).
$P S N R=20 \log _{10}\left(\frac{255}{\sqrt{M S E}}\right)$ (15)
A higher PSNR value indicates greater symmetry in images according to the PSNR metric. In the case of identical images, PSNR is infinite or undefined due to the MSE value being "0". SSIM is another image quality measurement that primarily quantifies image quality degradation. SSIM constructs perception-based models that regard image degradation as perceived change in structural information. The formula for SSIM is given in Eq. (16).
$\operatorname{SSIM}(x . y)=\frac{\left(2 \mu_x \mu_y+c_1\right) \times\left(2 \sigma_{x y}+c_2\right)}{\left(\mu_x^2+\mu_y^2+c_1\right) \times\left(\sigma_x^2+\sigma_y^2+c_2\right)}$ (16)
where, µx, µy, σx, σy and σxy are the local means, standard deviations, and cross-covariance for images x and y, respectively.
Figure 3. The flowchart of the experiments
3.5 The proposed optimization software for contrast enhancement and the applied experiments
The research goal of the proposed manuscript is to optimize HS parameters for improved contrast enhancement in images. To achieve this, a comparative study of nine optimization algorithms was examined. Each algorithm has a unique approach to exploring the solution space, and their performances in this application are largely dependent on their properties and complexities. Each algorithm was initialized with a set of parameters, and it iteratively updates these parameters to find an optimal solution that maximizes the contrast of the image. The PSO, ABC, GA, DE, SA, BFA, CSO, DA, and BH algorithms are employed in the study. In the manuscript, first the theoretical background of each algorithm was briefly explained, and then relevant information was given about how each algorithm optimizes the HS parameters. In the following sections, a comparative analysis of the algorithms based on several factors such as complexity, parameters, and performance on different distortion types will be carried out.
In the presented manuscript, experiments were conducted both for the original image set and for four sets of distorted images. The flowchart of the experiments is given in Figure 3. Differently optimized HS and standard histogram equalization techniques were separately applied to the images to evaluate their effectiveness in enhancing contrast-based distortions. The TID2008 dataset [31] was utilized. A total of 100 distorted images were generated by modifying four levels of distortion for each reference image. Initially, enhancement techniques were applied to the distorted images to quantitatively measure performance scores. Subsequently, the methods were also implemented on the raw reference images to assess the distortion effects of the methods on the original images. It is anticipated that the enhancement methods should both restore the distorted images to their reference state and preserve the original images as closely as possible. Furthermore, the optimization techniques were evaluated in terms of processing times. Each image enhancement and distortion effect analysis were repeated 40 times on a specific image to ensure more reliable results. The average outcomes of the 40 tests per image were divided into four distortion levels and recorded in tables separately.
The proposed software was written in the NET platform (C#) to visualize the effects of IE process and to obtain the quantitative results more easily. The proposed software does not have any specific hardware requirements. An intuitive and accessible user interface was designed for the software, even for users with limited technical expertise. The interface features a drop-down menu that allows users to easily select the optimization algorithm they wish to use for HS. The input parameters for each algorithm can also be easily chosen by the users. The written interface displays the original image, the enhanced image, and the optimized parameters for easy comparison and analysis. During the development of the tool, a few software engineering related challenges were faced. One of the major challenges was integrating the different optimization algorithms into the tool in a way that allowed them to work seamlessly with the HS process. This challenge was overcome by carefully designing the software architecture to ensure compatibility between the different components. Another challenge was testing the tool to ensure it provided accurate and reliable results. An extensive was conducted by testing using a variety of images and parameters to validate the tool's performance.
4.1 Quantitative analysis
Table 2 presents the results of the non-optimized standard histogram equalization technique alongside the optimized versions of the HS approach. Average scores for SSIM, PSNR, and MSE were tabulated corresponding to each level of contrast distortion. A lower MSE value signifies strong image similarity, while PSNR and SSIM should be at their maximum values. In cases where the images compared are identical, SSIM is equal to 1. The highest obtained scores were marked in bold in the tables, while the worst results were highlighted with italic typefaces. According to Table 2, the DE optimized HS technique resulted in the lowest MSE and highest PSNR and SSIM scores for the images classified under distortion levels 1, 2, and 3. However, considering the average scores for all distorted images, the BH optimized HS method emerged as the best-performing contrast enhancement technique. This method resulted in the lowest MSE and the highest PSNR and SSIM, according to the mean scores of all 100 enhanced images (each image was enhanced 40 times using each technique). For distortion levels 1, 2, and 3, BH also provided image enhancements similar to DE. However, a significant performance difference between BH and DE was observed when enhancing images with distortion level 4.
The SSIM is a more informative and crucial metric in the quality assessment of an image when compared to PSNR or MSE. In several cases, PSNR scores might be high even when the images appear different visually. In these cases, the SSIM metric objectively emphasizes the differences between images. The best techniques according to MSE and PSNR metrics also resulted in the highest SSIM scores due to providing a very high enhancement ratio among all other techniques. However, the least effective techniques, evaluated in terms of MSE and PSNR scores, produced varying SSIM scores because of the more detailed analysis incorporating local means, standard deviations, and cross-covariance of images, instead of only utilizing the mean square errors.
According to SSIM scores, DA still remains the least effective optimization technique used in the HS formula for images with distortion levels 1 and 2. ABC and CSO were reported as the least effective techniques for distortion levels 3 and 4, respectively. When considering the mean SSIM scores of enhanced 100 distorted images without level classification, DE is determined as the least useful technique for the HS approach among all other techniques.
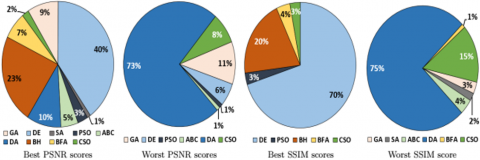
In addition to the average scores for 100 distorted images listed in Table 2, the distribution of the techniques that resulted in the best and worst PSNR and SSIM scores across 100 images is also presented in Figure 4. As per both PSNR and SSIM metrics, DE provided superior enhancement than other optimization techniques for 40% and 70% of the 100 distorted images, respectively. The BH algorithm emerges as the second most effective optimization technique, showing the best results for 23% and 20% of the 100 distorted images, in terms of PSNR and SSIM, respectively. On the other hand, the DA showed the poorest performance, resulting in the lowest PSNR and SSIM scores for 73% and 75% of all distorted images. Interestingly, the PSNR metric shows a misleading effect here, as according to it, DA also resulted in the best scores for 10% of all distorted images, while DA did not rank among the best techniques as per SSIM scores. GA is another instance where PSNR metric showed contrasting results for best and worst enhancements for the distorted images. From these observations, it is clear that the SSIM metric is much more reliable for evaluating optimization techniques. In terms of poor performance, CSO emerged as the second worst technique, resulting in the poorest SSIM scores for 15% of the images among the 100 distorted images.
Comparing the optimized HS techniques to non-parametric histogram equalization, the results show that histogram equalization is significantly inferior to optimized HS methods as shown in Table 2. Unlike optimized HS techniques, the performance scores of histogram equalization are similar across different distortion levels because it's a parameter-independent method and applies the same equation to all images.
Table 2. MSE, PSNR and SSIM based performance results
|
|
Dist. Level |
GA1 |
DE2 |
SA3 |
PSO4 |
ABC5 |
DA6 |
BH7 |
BFA8 |
CSO9 |
HE10 |
||||
|
MSE |
1 |
104.63 |
75.03 |
145.71 |
114.96 |
259.95 |
408.45 |
78.05 |
262.61 |
224.81 |
1082.9 |
||||
|
2 |
82.95 |
64.12 |
147.91 |
114.82 |
218.16 |
410.99 |
85.79 |
241.01 |
215.37 |
1254.2 |
|||||
|
3 |
318.94 |
292.61 |
358.56 |
326.49 |
479.51 |
643.88 |
294.08 |
483.23 |
426.27 |
1161.5 |
|||||
|
4 |
841.15 |
680.45 |
897.49 |
803.36 |
757.88 |
791.08 |
601.33 |
696.24 |
1489.5 |
1492.2 |
|||||
|
Mean |
336.92 |
278.05 |
387.41 |
339.91 |
428.87 |
563.61 |
264.81 |
420.77 |
588.98 |
1247.7 |
|||||
|
PSNR |
1 |
28.485 |
29.644 |
27.319 |
28.069 |
25.091 |
23.654 |
29.482 |
25.118 |
25.757 |
18.31 |
||||
|
2 |
33.228 |
33.751 |
31.436 |
31.929 |
28.519 |
25.773 |
33.243 |
28.467 |
28.940 |
17.91 |
|||||
|
3 |
23.372 |
23.702 |
22.899 |
23.256 |
21.760 |
20.720 |
23.675 |
21.759 |
22.308 |
17.85 |
|||||
|
4 |
20.736 |
20.751 |
21.340 |
21.056 |
22.289 |
22.450 |
22.680 |
21.932 |
20.386 |
17.02 |
|||||
|
Mean |
26.368 |
26.962 |
25.748 |
26.077 |
24.415 |
23.149 |
27.270 |
24.319 |
24.435 |
17.772 |
|||||
|
SSIM |
1 |
0.957 |
0.967 |
0.954 |
0.960 |
0.940 |
0.922 |
0.965 |
0.939 |
0.942 |
0.808 |
||||
|
2 |
0.989 |
0.992 |
0.980 |
0.986 |
0.974 |
0.958 |
0.990 |
0.973 |
0.973 |
0.802 |
|||||
|
3 |
0.895 |
0.904 |
0.895 |
0.900 |
0.881 |
0.866 |
0.903 |
0.882 |
0.886 |
0.778 |
|||||
|
4 |
0.913 |
0.930 |
0.907 |
0.914 |
0.916 |
0.908 |
0.936 |
0.920 |
0.886 |
0.757 |
|||||
|
Mean |
0.938 |
0.948 |
0.934 |
0.940 |
0.928 |
0.913 |
0.948 |
0.928 |
0.922 |
0.775 |
|||||
|
1 Genetic Alg. |
2 Differential Evo. |
3 Sim. Annealing |
4 Particle Swarm Opt. |
5 Art. Bee Colony |
|||||||||||
|
6 Dragonfly Alg. |
7 Black Hole |
8 Bact. Fore. Alg. |
9 Cat Swarm Opt. |
10 Histogram Eq. |
|||||||||||
Figure 4. The distribution of the techniques, which resulted in best and worst PSNR and SSIM scores over 100 images
Each image enhancement process was repeated 40 times for each image to ensure a more reliable performance comparison. In addition to the enhancement scores, the average standard deviations of the MSE metrics corresponding to distortion levels were recorded in Table 3. Variations in PSNR and SSIM are challenging to analyze due to the use of logarithmic functions in the calculations, causing minimal variation in these metrics. Therefore, only the deviations in the MSE metrics are presented in Table 3. Standard deviations signify consistency. In other words, a lower variation in 40 repetitive tests per image indicates the robustness of the technique. DE, PSO, SA and BH resulted in less variation for distortion levels 1, 2, 3, and 4, respectively. In the average analysis of 100 IE processes, the BH algorithm proves to be the most consistent technique with the minimum variations. Conversely, the DA and CSO were observed to be the most inconsistent techniques, in addition to their unsuccessful enhancement scores.
4.2 Qualitative analysis
An example image from each distortion level is presented in Figure 5, illustrating the first and second best, as well as the worst, enhancement results. BH and DE were chosen as the top two techniques, so the outputs from these techniques are displayed. The HE, BFA, and CSO techniques registered the worst scores for the corresponding images, and therefore the enhanced image outputs of these techniques are also shown in Figure 5 for a visual comparison. The HE technique visually exacerbates the existing distortions in the images, far beyond the original distortion effect, while the optimized techniques deliver a more effective enhancement.
BH and DE techniques consistently demonstrated the best enhancement results across different distortion levels. BH, for instance, operates on the principle of 'survival of the fittest,' which allows it to search a vast solution space and converge on an optimal one efficiently. This is reflected in the enhanced images, where there is a noticeable improvement in contrast and visibility of fine details. The DE algorithm's strength lies in its ability to balance exploration and exploitation, maintaining diversity in the solution pool. Visually, images enhanced by DE show marked improvements in brightness levels and contrast, enhancing the clarity of the image without introducing new artifacts.
HE, BFA, and CSO techniques resulted in the worst enhancement results. The failure of HE in this context could be due to its one-size-fits-all approach, which doesn't take the unique properties of each image into account. This leads to an over-stretching of the histogram, which, while increasing contrast, also results in loss of detail and introduction of artifacts. Similarly, BFA and CSO seem to struggle with finding an optimal balance between enhancing contrast and preserving detail.
Table 3. The average standard deviations of MSE results corresponding to distortion levels
|
|
Dist. Level |
GA1 |
DE2 |
SA3 |
PSO4 |
ABC5 |
DA6 |
BH7 |
BFA8 |
CSO9 |
||||
|
MSE |
1 |
30.15 |
24.85 |
27.76 |
24.98 |
35.06 |
86.49 |
25.46 |
39.75 |
34.66 |
||||
|
2 |
95.22 |
100.29 |
104.77 |
79.92 |
103.73 |
160.33 |
95.60 |
127.48 |
116.22 |
|||||
|
3 |
87.80 |
85.09 |
81.98 |
84.32 |
92.91 |
109.24 |
85.34 |
100.46 |
91.54 |
|||||
|
4 |
404.01 |
283.21 |
376.25 |
400.17 |
351.10 |
297.60 |
249.24 |
283.68 |
898.39 |
|||||
|
Mean |
372.13 |
294.64 |
366.34 |
350.18 |
286.20 |
267.71 |
230.65 |
247.75 |
696.38 |
|||||
|
1 Genetic Alg. |
2 Differential Evo. |
3 Sim. Annealing |
4 Particle Swarm Opt. |
5 Art. Bee Colony |
||||||||||
|
6 Dragonfly Alg. |
7 Black Hole |
8 Bact. Fore. Alg. |
9 Cat Swarm Opt. |
|
||||||||||
Figure 5. The enhanced images obtained from the first and second-best optimization techniques utilized in histogram stretching and the worst enhancing performance resulted by a non-parametric histogram equalization technique
Table 4. Processing times for optimizing α, β and γ parameters
|
|
Dist. Level |
GA2 |
DE2 |
SA3 |
PSO4 |
ABC5 |
DA6 |
BH7 |
BFA8 |
CSO9 |
||||
|
Times (sec.) |
1 |
13.62 |
8.10 |
1.53 |
0.61 |
0.78 |
4.82 |
2.44 |
0.81 |
1.27 |
||||
|
2 |
11.26 |
6.57 |
1.53 |
0.64 |
0.78 |
4.97 |
2.26 |
0.81 |
1.27 |
|||||
|
3 |
13.36 |
8.23 |
1.53 |
0.61 |
0.78 |
4.86 |
2.47 |
0.81 |
1.26 |
|||||
|
4 |
9.14 |
7.45 |
1.51 |
0.62 |
0.77 |
5.22 |
2.07 |
0.81 |
1.23 |
|||||
|
Mean (Sec.) |
11.84 |
7.59 |
1.53 |
0.62 |
0.78 |
4.97 |
2.31 |
0.81 |
1.26 |
|||||
|
Total (Min.) |
19.7 |
12.6 |
2.5 |
1 |
1.3 |
8.3 |
3.8 |
1.3 |
2.1 |
|||||
|
1 Genetic Alg. |
2 Differential Evo. |
3 Sim. Annealing |
4 Particle Swarm Opt. |
5 Art. Bee Colony |
||||||||||
|
6 Dragonfly Alg. |
7 Black Hole |
8 Bact. Fore. Alg. |
9 Cat Swarm Opt. |
|
||||||||||
4.3 Processing time comparison
In addition to evaluating the methods, the processing times of the optimization techniques were measured and recorded in Table 4. Processing time provides insight into the time complexity and the system resources required by each algorithm. According to the results, PSO has the least time complexity, while GA is the most time and resource intensive technique among all the optimization methods. GA completed the enhancement process for 100 images in 19 minutes. On the other hand, PSO enhanced all the images in just 1 minute (approximately 0.6 seconds for each image). The BH technique, considered the best optimization method in terms of performance and consistency, completed the enhancement of 100 distorted images in 4 minutes. DE, ranked second in terms of performance, is more complex compared to BH. DE optimized the HS method in a longer time than BH did, being almost three times slower.
4.4 Distortion effects
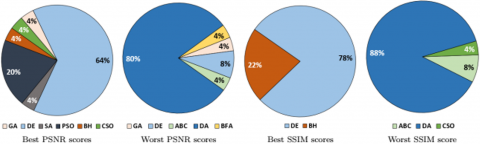
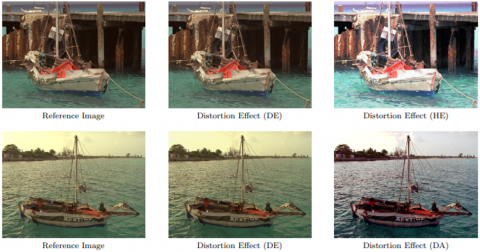
In this study, the distortion effects of the enhancement techniques on the reference images were also tested. Ideally, the original images and the enhanced images should be similar. Therefore, the SSIM and PSNR should be 1 and maximum, respectively while MSE should be zero. Results are presented in Table 5. According to the results, the non-parametric standard histogram equalization technique deformed the original images more than all other optimized HS techniques. Minimum distortion was observed for DE with 0.996 PSNR score. The MSE of DE also emphasized that the distortion effect is minimal amongst all other techniques. The second minimal distortion effect was determined for BH having very close scores to DE with 0.994 PSNR and 44 MSE. The most distortion effect after HE is defined for DA optimization technique. In a manner similar to Figure 4, the distribution of techniques in terms of best and worst SSIM and PSNR score for distortion effect of 25 original reference images is presented in Figure 6. According to this illustration, DE and BH optimization techniques preserves the 25 original images, while DA, ABC and CSO optimization techniques have great distortion affects amongst all other techniques. An example output of two techniques (HE and DA) that cause the most distortion over the original image is shown in Figure 7. Addition to these techniques, DE optimized HS, which has minimum distortion effects, is also illustrated in Figure 7. The standard histogram equalization method visually distorted all the original images where the others had minimal effect in this respect.
Table 5. Average MSE, PSNR and SSIM results of the 25 enhanced original images by optimized histogram stretching techniques (Distortion Effect)
|
|
GA1 |
DE2 |
SA3 |
PSO4 |
ABC5 |
DA6 |
BH7 |
BFA8 |
CSO9 |
HE10 |
||||
|
MSE
PSNR
SSIM |
69.517 |
37.333 |
101.939 |
77.825 |
182.547 |
349.556 |
44.122 |
226.08 |
161.818 |
2661 |
||||
|
32.43 |
33.282 |
30.936 |
32.198 |
28.821 |
25.882 |
32.966 |
27.816 |
29.071 |
8.22 |
|||||
|
0.989 |
0.996 |
0.982 |
0.989 |
0.971 |
0.953 |
0.994 |
0.966 |
0.973 |
0.51 |
|||||
|
1 Genetic Alg. |
2 Differential Evo. |
3 Sim. Annealing |
4 Particle Swarm Opt. |
5 Art. Bee Colony |
||||||||||
|
6 Dragonfly Alg. |
7 Black Hole |
8 Bact. Fore. Alg. |
9 Cat Swarm Opt. |
10 Histogram Eq. |
||||||||||
Figure 6. The distribution of techniques in terms of best and worst SSIM and PSNR score for distortion effect of 25 original reference images
Figure 7. Minimum and maximum distortion effects on two example original images
In this study, the contribution of artificial intelligent based optimization techniques was examined within the context of image enhancement. HS was selected as the parameter dependent IE technique. Totally, nine nature-inspired optimization techniques are implemented to tuning the parameters of HS. In other words, the optimization idea was employed to identify an optimal parameter in the HS technique. Additionally, another IE technique, histogram equalization, was also evaluated by testing on the same data set. Although histogram equalization is a parameter-independent technique that does not require optimization, the parameters in the HS method directly affect the performance. Tests are performed on 125 images having 4 different distortions and original versions.
From the findings, it is observed that DE emerged as the most efficient technique, scoring highest for SSIM (0.948) and second best for MSE (278.05) and PSNR (26.962). DE has also created the least amount of distortion in original images. This strong performance can be attributed to the core principles of DE, which relies on a population-based approach, utilizing vector differences for perturbation, and crossover for recombination. These characteristics provide DE with a powerful global search ability and excellent exploitation capability, making it well-suited for tasks like HS where optimal parameter values need to be found within a large and diverse solution space.
BH demonstrated very similar performance to DE, which indicates certain similarities in their optimization strategies despite the fundamental differences in their algorithms. BH is a meta-heuristic algorithm inspired by the black hole phenomenon, where the strongest black hole absorbs other black holes and matter around it. In terms of optimization, the algorithm considers the best solution as the black hole which pulls other solutions (called stars) towards it, thus updating the position of the stars and finding optimal solutions. In the context of HS, this means that the BH algorithm would adjust the stretching parameters iteratively, pulling them towards configurations that previously resulted in high-quality image enhancement metrics. It is this consistent 'gravitational pull' towards better solutions that could explain the strong performance of the BH algorithm. Moreover, this also highlights the adaptability of the BH algorithm. While it is a meta-heuristic method designed for global optimization problems, our study illustrates its effective application in a specific image processing task. This adaptability stems from its ability to balance exploration and exploitation throughout the search process, making it particularly suited to our HS optimization problem.
In terms of time complexity, PSO proved to be the fastest, taking just 0.6 sec. per image for parameter definition. The speed of PSO can be linked to its simple and efficient nature, where particles move in the search space with velocities that are dynamically adjusted according to their own and their companions' historical behaviors. This allows PSO to quickly converge to an optimal or near-optimal solution, making it particularly efficient when time is a critical factor.
Regarding the histogram equalization, results indicate that the optimization techniques require more processing time, but the enhancement result in terms of PSNR, MSE and SSIM is increased when compared to regular histogram equalization. GA is observed as the most time-consuming algorithm amongst all approaches. The worst enhancements were obtained with DA and CSO. Also, CSO has very high distortion effects on original images similar to standard HE. However, all implemented and tested optimization techniques surpass the HE technique in terms of performance metrics.
In terms of the qualitative results, example images from each distortion level were presented in Figure 5 with the first and second best, and the worst enhancement results. The BH and DE algorithms produced the first and second-best results, respectively. The parameters optimized by these algorithms led to effective stretching of the histogram, improving the contrast and enhancing the visibility of details in the images. These results illustrate the capacity of these algorithms to find effective solutions in complex search spaces, contributing to their superior visual performance. On the other hand, the HE, BFA, and CSO techniques resulted in the worst visual scores for the corresponding images. The histogram modifications made by these techniques often led to over-enhancement or under-enhancement in certain parts of the image, causing visual distortions and poorer qualitative results. These results may be attributed to the challenges in optimally balancing the parameters for these techniques to achieve an effective enhancement. The optimization parameters used by these algorithms could have led to a disproportionate distribution of pixel values, thus visually degrading the images. For instance, HE technique often resulted in images appearing more distorted than their original versions. This was likely due to the nature of HE which aims to flatten the histogram completely, leading to an unnatural appearance when over-applied. As such, while it managed to improve contrast, it also increased noise and artifact appearance, particularly in images that were already somewhat distorted. By examining the images and their histograms in tandem, it could be seen that successful enhancement often involved a delicate balance: the distribution of pixel intensities needed to be widened, but not to such an extent that it introduced artificial contrasts or amplified noise.
In comparison with existing literature, our research affirms several previous findings while presenting new insights. Specifically, our results align with those of the study [42] who also found that DE demonstrated superior performance in HS for image enhancement tasks. Our research extends their findings by incorporating additional optimization algorithms, particularly the BA, which emerged as a close contender for the most efficient technique. However, our findings contradict those of the study [43], who reported Particle Swarm Optimization as the most effective optimization technique. This discrepancy could be attributed to the different characteristics and complexities of the images used in both studies, underlying the necessity of a more context-specific application of optimization techniques.
Our work is not without its limitations. Firstly, while we utilized a diverse range of images for testing, all were drawn from the same dataset, limiting the generalizability of our findings. Future research could incorporate a more varied array of images sourced from different datasets to verify the robustness of these optimization algorithms.
In future, the research trajectory of the proposed study will branch out in two significant ways. Firstly, additional algorithms are planned to be incorporated into the proposed software to expand the exploration of nature-inspired optimization techniques. These will include, but are not limited to, Firefly, Whale Optimization, and Bat Algorithm. By doing that a more comprehensive testing platform, which will be beneficial for future studies in IE field, would be obtained. Secondly, it is planned to diversify the research problem space to encompass not only HS but also other parameter-dependent challenges such as image denoising and augmentation. It is expected that this expansion of the focus will offer a more holistic view of the application of optimization algorithms in various domains of image processing. Additionally, the proposed software provides a valuable resource for other researchers, who will be able to use this tool to facilitate their own explorations in various fields. This represents not only the next step for those researches but also a potential stepping stone for the broader research community.
In conclusion, the proposed study's key contributions lie in its detailed comparative analysis of nine optimization algorithms in a novel context - HS for IE. We offer a thorough quantitative analysis of each algorithm's performance, alongside a qualitative analysis of the image outputs. This provides both numerical evidence and visual confirmation of each algorithm's effectiveness. Our findings suggest that DE and the BH algorithms exhibit superior performance, with DE offering the highest SSIM and the second-best MSE and PSNR results. On the other hand, PSO proved fastest in terms of time complexity. This serves to fill the knowledge gap we identified, providing clear, evidence-based recommendations on which optimization algorithms perform best for HS.
|
PSO |
Particle Swarm Optimization |
|
ABC |
Artificial Bee Colony |
|
GA |
Genetic Algorithm |
|
DE |
Differential Evolution |
|
SA |
Simulated Annealing |
|
DA |
Dragonfly Algorithm |
|
BH |
Black Hole |
|
BFO |
Bacterial Foraging Optimization |
|
CSO |
Cat Swarm Optimization |
|
HE |
Histogram Equalization |
|
CE |
Contrast Enhancement |
|
PSNR |
Peak Signal Noise Ratio |
|
MSE |
Mean Square Error |
|
SSIM IE |
Structural Similarity Index Image Enhancement |
|
Greek symbols |
|
|
$\alpha$ |
Scaling Parameter |
|
$\beta$ |
Shifting Parameter |
|
$\gamma$ |
Degrading Parameter |
The interface of the proposed software has been attached as appendix of this study. In the proposed software, the distorted source image is shown in the "Distorted Image Section" on the left side of the screen after it is loaded. If a reference (original) image does exist, the user can also upload this image into the software in order to obtain the IE performance as a result of reference image and enhanced image comparison. Otherwise, the software provides the performance metrics by using the differences between the distorted image and its enhanced version. The reference image can also be shown on the software screen in order to obtain a visual comparison. The average, median and standard deviation values calculated from the loaded image pixels (for the distorted and/or original images) are displayed in the corresponding fields under the corresponding images as shown in figure. When a specific optimization algorithm is selected from the drop-down menu, the IE process would start for the selected algorithm which gives the optimum parameters. Afterwards, the enhanced image is demonstrated in the "Enhanced Image" region on the right side of the software screen for visual comparison. The user can easily save and visually analyze the enhanced image. Additionally, the MSE, PSNR and SSIM metrics are calculated by comparing the reference image (can be the distorted or the original image) with its enhanced version. These performance metrics are presented to users in the graphical interface as well. The proposed software can also provide, and report results obtained from all nine optimization algorithms that were applied to a selected image for a fair comparison.
[1] Koziel, S., Yang, X.S. (Eds.). (2011). Computational optimization, methods and algorithms. Springer, 356: 33-59.
[2] Propadalo, S., Bekavac, D., Jakšić, Z. (2012). Spare modules management optimization of airspace surveillance system. Promet-Traffic&Transportation, 24(2): 119-124. https://doi.org/10.7307/ptt.v24i2.283
[3] Küçükyildiz, G., Ocak, H. (2014). Development and optimization of a DSP-based real-time lane detection algorithm on a mobile platform. Turkish Journal of Electrical Engineering and Computer Sciences, 22(6): 1484-1500. https://doi.org/10.3906/elk-1209-51
[4] Teichmann, D., Dorda, M., Bínová, H., Ludvík, M. (2015). Optimization of parking public transport vehicles in Ostrava. Promet-Traffic&Transportation, 27(1): 69-75. https://doi.org/10.7307/ptt.v27i1.1593
[5] Laplante, P.A. (2004) Performance analysis and optimization. Real‐Time Systems Design and Analysis, Third Edition. IEEE, pp. 351-396. https://doi.org/10.1002/0471648299.ch7
[6] Sawant, H.K., Deore, M. (2010). A comprehensive review of image enhancement techniques. International Journal of Computer Technology and Electronics Engineering (IJCTEE), 1(2): 39-44.
[7] Analoui, M. (2001). Radiographic image enhancement. Part I: Spatial domain techniques. Dentomaxillofacial Radiology, 30(1): 1-9. https://doi.org/10.1038/sj/dmfr/4600562
[8] Agaian, S.S., Panetta, K., Grigoryan, A.M. (2001). Transform-based image enhancement algorithms with performance measure. IEEE Transactions on Image Processing, 10(3): 367-382. https://doi.org/10.1109/83.908502
[9] Kennedy, J., Eberhart, R. (1995). Particle swarm optimization. In Proceedings of ICNN'95-International Conference on Neural Networks. IEEE, 4: 1942-1948. https://doi.org/10.1109/ICNN.1995.488968
[10] Braik, M., Sheta, A.F., Ayesh, A. (2007). Image enhancement using particle swarm optimization. In World Congress on Engineering, 1: 978-988.
[11] Gorai, A., Ghosh, A. (2009). Gray-level image enhancement by particle swarm optimization. In 2009 World Congress on Nature & Biologically Inspired Computing (NaBIC). IEEE, pp. 72-77. https://doi.org/10.1109/NABIC.2009.5393603
[12] Karaboga, D., Basturk, B. (2007). A powerful and efficient algorithm for numerical function optimization: Artificial bee colony (ABC) algorithm. Journal of Global Optimization, 39: 459-471. https://doi.org/10.1007/s10898-007-9149-x
[13] Subramaniam, S., Radhakrishnan, M. (2016). Neural network with bee colony optimization for MRI brain cancer image classification. International Arab Journal of Information Technology (IAJIT), 13(1).
[14] Singh, A. (2009). An artificial bee colony algorithm for the leaf-constrained minimum spanning tree problem. Applied Soft Computing, 9(2): 625-631. https://doi.org/10.1016/j.asoc.2008.09.001
[15] Storn, R., Price, K. (1997). Differential evolution-a simple and efficient heuristic for global optimization over continuous spaces. Journal of Global Optimization, 11: 341-359. https://doi.org/10.1023/A:1008202821328
[16] Storn, R. (1996). Differential evolution design of an IIR-filter. In Proceedings of IEEE International Conference on Evolutionary Computation, pp. 268-273. https://doi.org/10.1109/ICEC.1996.542373
[17] dos Santos Coelho, L., Sauer, J.G., Rudek, M. (2009). Differential evolution optimization combined with chaotic sequences for image contrast enhancement. Chaos, Solitons & Fractals, 42(1): 522-529. https://doi.org/10.1016/j.chaos.2009.01.012
[18] Sarangi, P.P., Mishra, B.S.P., Majhi, B., Dehuri, S. (2014). Gray-level image enhancement using differential evolution optimization algorithm. In 2014 International Conference on Signal Processing and Integrated Networks (SPIN). IEEE, pp. 95-100. https://doi.org/10.1109/SPIN.2014.6776929
[19] Kirkpatrick, S., Gelatt Jr, C.D., Vecchi, M.P. (1983). Optimization by simulated annealing. Science, 220(4598): 671-680. https://doi.org/10.1126/science.220.4598.671
[20] Hoseini, P., Shayesteh, M.G. (2010). Hybrid ant colony optimization, genetic algorithm, and simulated annealing for image contrast enhancement. In IEEE Congress on Evolutionary Computation, pp. 1-6. https://doi.org/10.1109/CEC.2010.5586542
[21] Liu, Y., Passino, K.M. (2002). Biomimicry of social foraging bacteria for distributed optimization: Models, principles, and emergent behaviors. Journal of Optimization Theory and Applications, 115: 603-628. https://doi.org/10.1023/A:1021207331209
[22] Hanmandlu, M., Verma, O.P., Kumar, N.K., Kulkarni, M. (2009). A novel optimal fuzzy system for color image enhancement using bacterial foraging. IEEE Transactions on Instrumentation and Measurement, 58(8): 2867-2879. https://doi.org/10.1109/TIM.2009.2016371
[23] Chu, S.C., Tsai, P.W., Pan, J.S. (2006). Cat swarm optimization. In PRICAI 2006: Trends in Artificial Intelligence: 9th Pacific Rim International Conference on Artificial Intelligence Guilin, China, August 7-11, 2006 Proceedings. Springer Berlin Heidelberg, 9: 854-858. https://doi.org/10.1007/978-3-540-36668-3_94
[24] Çam, H.B., Akçakoca, S., Elbir, A., Ilhan, H.O., Aydın, N. (2018). The performance evaluation of the cat and particle swarm optimization techniques in the image enhancement. In 2018 Electric Electronics, Computer Science, Biomedical Engineerings' Meeting (EBBT). IEEE, pp. 1-4. https://doi.org/10.1109/EBBT.2018.8391430
[25] Saitoh, F. (1999). Image contrast enhancement using genetic algorithm. In IEEE SMC'99 Conference Proceedings. 1999 IEEE International Conference on Systems, Man, and Cybernetics (Cat. No. 99CH37028), 4: 899-904. https://doi.org/10.1109/ICSMC.1999.812529
[26] Hashemi, S., Kiani, S., Noroozi, N., Moghaddam, M.E. (2010). An image contrast enhancement method based on genetic algorithm. Pattern Recognition Letters, 31(13): 1816-1824. https://doi.org/10.1016/j.patrec.2009.12.006
[27] Mirjalili, S. (2016). Dragonfly algorithm: A new meta-heuristic optimization technique for solving single-objective, discrete, and multi-objective problems. Neural Computing and Applications, 27: 1053-1073. https://doi.org/10.1007/s00521-015-1920-1
[28] KS, S.R., Murugan, S. (2017). Memory based hybrid dragonfly algorithm for numerical optimization problems. Expert Systems with Applications, 83: 63-78. https://doi.org/10.1016/j.eswa.2017.04.033
[29] Hatamlou, A. (2013). Black hole: A new heuristic optimization approach for data clustering. Information Sciences, 222: 175-184. https://doi.org/10.1016/j.ins.2012.08.023
[30] Yaghoobi, S., Hemayat, S., Mojallali, H. (2015). Image gray-level enhancement using black hole algorithm. In 2015 2nd International Conference on Pattern Recognition and Image Analysis (IPRIA). IEEE, pp. 1-5. https://doi.org/10.1109/PRIA.2015.7161633
[31] Ponomarenko, N., Lukin, V., Zelensky, A., Egiazarian, K., Carli, M., Battisti, F. (2009). TID2008-a database for evaluation of full-reference visual quality assessment metrics. Advances of Modern Radioelectronics, 10(4): 30-45.
[32] Kim, Y.T. (1997). Contrast enhancement using brightness preserving bi-histogram equalization. IEEE Transactions on Consumer Electronics, 43(1): 1-8. https://doi.org/10.1109/30.580378
[33] Alparslan, E., Ince, F. (1979). Image enhancement by local histgram stretching. IEEE Transactions on Systems Man and Cybernetics, 11: 376-385.
[34] Wu, Z. (2014). Signal de-noising method based on particle swarm algorithm and wavelet transform. Tehnicki Vjesnik/Technical Gazette, 21(5): 1001-1008.
[35] MENGÜÇ, E.C., Acir, N. (2015). A novel adaptive filter design using lyapunov stability theory. Turkish Journal of Electrical Engineering and Computer Sciences, 23(3): 719-728. https://doi.org/10.3906/elk-1212-29
[36] Binitha, S., Sathya, S.S. (2012). A survey of bio inspired optimization algorithms. International Journal of Soft Computing and Engineering, 2(2): 137-151.
[37] Passino, K.M. (2002). Biomimicry of bacterial foraging for distributed optimization and control. IEEE Control Systems Magazine, 22(3): 52-67. https://doi.org/10.1109/MCS.2002.1004010
[38] Ahmed, A.M., Rashid, T.A., Saeed, S.A.M. (2020). Cat swarm optimization algorithm: a survey and performance evaluation. Computational Intelligence and Neuroscience, 2020. https://doi.org/10.1155/2020/4854895
[39] Kalaiselvan, G., Lavanya, A., Natrajan, V. (2011). Enhancing the performance of watermarking based on cat swarm optimization method. In 2011 International Conference on Recent Trends in Information Technology (ICRTIT). IEEE, pp. 1081-1086. https://doi.org/10.1109/ICRTIT.2011.5972355
[40] Tawhid, M.A., Dsouza, K.B. (2018). Hybrid binary dragonfly enhanced particle swarm optimization algorithm for solving feature selection problems. Mathematical Foundations of Computing, 1(2): 181-200. http://dx.doi.org/10.3934/mfc.2018009
[41] Hore, A., Ziou, D. (2010). Image quality metrics: PSNR vs. SSIM. In 2010 20th International Conference on Pattern Recognition. IEEE, pp. 2366-2369. https://doi.org/10.1109/ICPR.2010.579
[42] Suresh, S., Lal, S. (2017). Modified differential evolution algorithm for contrast and brightness enhancement of satellite images. Applied Soft Computing, 61: 622-641. https://doi.org/10.1016/j.asoc.2017.08.019
[43] Naz, J., Sharif, M.I., Sharif, M.I., Kadry, S., Rauf, H.T., Ragab, A.E. (2023). A comparative analysis of optimization algorithms for gastrointestinal abnormalities recognition and classification based on ensemble xcepnet23 and resnet18 features. Biomedicines, 11(6): 1723. https://doi.org/10.3390/biomedicines11061723