Ali Ari![]()
© 2023 IIETA. This article is published by IIETA and is licensed under the CC BY 4.0 license (http://creativecommons.org/licenses/by/4.0/).
OPEN ACCESS
Electromyogram (EMG) signals are very important in recognizing hand and finger movements and controlling prosthesis movements. In recent years, EMG signals have become popular in designing and controlling human-machine interactions and rehabilitation equipment such as robotic prostheses. This study aims to develop an innovative model based on EMG signal in the classification of basic hand grip movements that can improve prosthetic hand movements for individuals who have lost some limbs for various reasons. The proposed approach consists of Time Domain Descriptors (TDD), convolutional neural network (CNN), Long short-term memory (LSTM) techniques, Selection Minimum Redundancy Maximum Relationship (MRMR), and Support Vector Machine (SVM). First, it is applied to TDD, CNN, and LSTM models to extract features from EMG signals. It is then applied as input to MRMR to select the most effective features from the obtained features. Finally, SVM is applied to classify different hand grip movements. The effectiveness of the proposed model was evaluated with the EMG hand gestures dataset in the publicly available UCI repository. In experimental studies, a 95.63% accuracy rate was achieved in the first two of the five subjects and 100% accuracy in the remaining three subjects. As a result, it achieved an average specificity of 99.66% and an accuracy of 98.34% for five subjects. In addition, the experimental results of the proposed hybrid model show that when compared to the most advanced methods using the same dataset, the model achieves a higher classification rate and produces superior results compared to several previous studies. Therefore, this study reveals that it can be used as a low-cost control unit that can accurately classify hand grips from EMG signals with high accuracy.
electromyography (EMG), deep learning, time domain descriptors, feature extraction, hand grip movement recognition
People worldwide lose some of their limbs due to burns, diseases such as diabetes, and work and traffic accidents. A study conducted in France in 2013 stated that approximately 60% of these cases caused damage to the arm region [1]. This seriously restricts people's daily activities and significantly reduces their quality of life. These problems are increasingly interesting in upper extremity rehabilitation devices with recurrent and capable of performing daily activities of individuals and providing auxiliary power [2].
Electromyography (EMG) is an electrophysiology procedure used to evaluate and diagnose the functions of muscle and nerve cells. EMG, which provides detailed data on the state and functioning of skeletal muscles, is the signal generated during the contraction of skeletal muscles. EMG provides the acquisition of bio-electrical signals of Motor Unit Action Potentials (MUAPs) [2]. EMG is divided into two according to the reception of bio-electrical signals. Surface EMG (sEMG) is generally preferred in subjects with limb loss and is taken with electrodes placed above the skin, while invasive EMG is used for movement restrictions in human bodies and is taken with needle electrodes placed in the muscles [3]. The location of the electrodes used to record muscle activities may have more data than a motor unit, as the muscle fibers of the motor units in different muscle parts are interconnected. In this respect, it is very important for researchers to record the correct information of the EMG signal to recognize finger movements individually and in combination to control robotic and artificial organs. Because the human hand enables it to perform a wide variety of tasks, including precise control and rough actions. We use our hands to hold objects, pull, push, perform delicate tasks such as typing, and make gestures during communication. These actions are provided by precisely controlled muscles and sensors sensitive to muscle lengths and epidermal sensors such as touch, temperature, and pressure [4]. Therefore, since sEMG signals reveal human muscle activities and distinguish wrist, hand, and finger movements, they have been effectively used recently to control state-of-the-art prostheses and design skeletal prosthetic hands [4-8].
In the literature, statistical algorithms, wavelet transform, empirical mode decomposition (EMD), artificial intelligence-based feature extraction, and classifier methods are generally preferred to classify basic hand grasp movements. Lee et al. [9] proposed a machine learning-based model to classify hand and finger movements. EMG signals from the hand and finger motions of ten volunteers were employed in their investigation. Using an artificial neural network (ANN) and support vector machine (SVM), they were able to classify the EMG signals measured from three channels with an accuracy of 94% and 87.40%, respectively. Bhattachargee et al. [10] used Fourier and statistical features such as Root Mean Square (RMS), std, Variance, and Median to classify finger movements with EMG signals. The obtained features reached 98.50% accuracy by applying them to the supervised learning-based Gradient Boosting (GB) classification algorithm.
Fang et al. [11] proposed a 2D EMG map to examine the relationship between hand movements and multichannel sEMG signals. For this purpose, they developed a special 16-channel electrode to collect sEMG signals on the forearm and used differential root mean square (DRMS) values as a feature, which references the relationship between adjacent EMG channels from sEMG signals from these multichannel electrodes. In distinguishing the four-hand movements, DRMS outperformed the traditional root mean square (RMS) approach with K-means and fuzzy C-means by 29.0% and 36.8%, respectively. Nishad et al. [12] developed the wavelet transform-based filter bank method to decompose the cross-covariance of sEMG signals to classify basic hand movements. They sequenced the features extracted with Kraskov entropy from the sEMG signals obtained from five subjects. They achieved 98.55% classification accuracy with these features, which were then applied to the k-nearest neighbor (k-NN) classifier.
Sapsanis et al. [13] used an EMD approach to classify baseline hand movement from EMG signals. This approach extracts different features in EMG signals' time and frequency domain. Then, the features were reduced by principal component analysis and applied to a linear classifier for classification. Subaşı et al. [14] proposed a model for prosthetic hand control based on wavelet packet transform (WPT) from sEMG signals and multi-scale principal component analysis (MSPCA). They used the statistical values of the subbands of the sEMG signals as features. To provide better classification performance, the first reduced the feature vector size with MSPCA and then applied decision trees as input for the classification. They achieved 98.33% classification accuracy in experimental studies.
Khusaba et al. [15] used two EMG electrodes placed on the forearm to improve control of the prosthetic fingers. He used EMG signals from these two electrodes and individual and combined finger movements that included ten different hand movements. Miften et al. [16] proposed a method for recognizing hand movements using EMG signals, including logarithmic spectrogram-based graph signal (LSGS), AdaBoost k-means (AB-k-means), and feature selection. In the study, effective feature selection was made by extracting features from EMG signals with the LSGS model. Then, the selected EMG features were classified into the AB-k-model. Aslan et al. [17] performed feature extraction using Distribution Entropy (DisEn) and Normal Cumulative Distribution Function (NCDF) methods to detect hand movements from EMG signals. Then these features used classifiers such as SVM and extreme learning machine (ELM) to classify hand gestures. In experimental studies, it distinguished hand movements with 98% accuracy performance. Rabin et al. [18] obtained frequency and time characteristics from EMG signals by short-time Fourier transform (STFT). Their studies have reduced the size of the extracted features by two-dimensional reduction methods. Then, they analyzed the effect of size reduction techniques on classification performance. The experimental studies found that the diffusion map outperformed the principal component analysis method. Feature extraction was performed using the Correlation-Similarity Analysis (F-DFA) to classify the EMG signals and RMS methods with non-overlapping windows to measure statistical similarity. The extracted features were classified by machine learning methods such as decision trees and k-NN [19, 20]. On the other hand, Tuncer et al. [21] developed a new model for prosthetic hand control based on the discrete wavelet transform and the triplet model. They used a two-level feature selection method to select the most effective features obtained from this model and a k-NN classifier to classify the selected features.
As seen in the literature, many methods have been developed for detecting hand grasp movements from EMG signals and creating prosthetic hands. Except for a few recent studies, techniques such as wavelet transform, EMD, and principal component analysis for feature reduction have been preferred. Although significant achievements are achieved in current studies, there are disadvantages, such as the high number of features. Therefore, these methods are not preferred in real-time applications.
This study is that when the works in the literature are examined, as far as we know, the features obtained from the use of LSTM, CNN, and TDD approaches together as an attribute in the classification of hand grip movements have not been found. Because new and efficient feature extraction is adopted, which can process stationary and nonlinear biomedical signals. In this respect, the proposed hybrid model will significantly contribute to designing an effective and low-cost prosthetic hand that can support individuals with partial or complete hand loss using a combined LSTM, CNN, and TDD approach. The main contributions of this article are summarized as follows:
This study proposes a new framework with TDD and deep learning-based framework to analyze EMG signals and also remove EMG properties that can recognize hand comparatives.
The study focuses on the design of the Minimal-Radiancy-Maximal-Relevance selection to select the most effective features.
The study has preferred SVM to classify the most effective feature of different handicrafts.
Finally, the study also evaluates the performance of the proposed model by comparing it with state-of-the-art methodologies.
The rest of the paper is organized as follows. The Section 2, the dataset and the proposed methodology are described. Section 3 discusses the experimental setup, the experimental results, and our findings. Section 4 presents the results and future work.
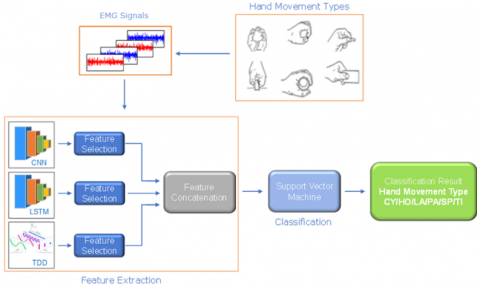
The main purpose of this study is to present a model that can automatically distinguish hand grip movements from EMG signals for people with partial or complete hand loss. The model, the general framework given in Figure 1, consists of three stages. In the first stage, TDD, CNN, and LSTM models are extracted features from EMG signals. Then, with the MRMR feature selection approach, the most effective features were selected among these features. Finally, SVM is used to classify hand grip movements from these most effective features.
Figure 1. General framework of proposed model
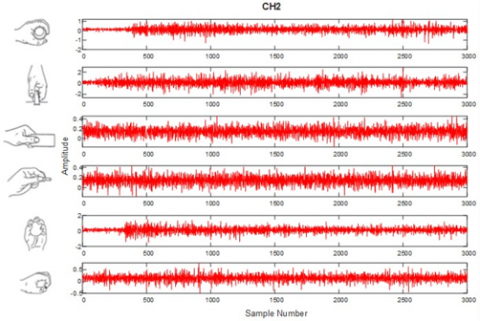
Figure 2. Six hand grip movements and the EMG signals of each electrode for these movements
2.1 EMG dataset
We used the EMG hand grasps signals dataset from the UC Irvine Machine Learning Repository, freely available for study [22]. It used two EMG channels to record EMG data. EMG signals in the dataset were collected from five healthy subjects two males and three females, aged 20 to 22. Flexor Carpi Ulnaris and Extensor Carpi Radialis, Longus, and Brevis surface electrodes attached to each subject's hands with elastic bands on the two forearm surfaces were used to record information about muscle activities.
Figure 2 shows six hand grasp movements and the EMG signals of each electrode of this hand grasp. The national instrument LabVIEW was used to sample the EMG signals at 500 Hz. Then, a Butterworth bandpass filter with low and high cutoff values of 15 Hz and 500 Hz was used to de-noise from the EMG signals. Also, a Notch filter was used at 50 Hz to eliminate line noises. Each subject was asked to perform each hand grasp movement for 6 seconds with the free force: Cylindrical (CY), Hook (HO), Lateral (LA), Palmar (PA), Tip (TI) and Spherical (SP). Each subject repeated these six hand grasp movements 30 times with the free speed, totaling 180 times. There are EMG signals of 900 hand grasps in total in the dataset. Besides, one healthy subject (male, 22-year-old) conducted the six grasps 100 times each for 3 consecutive days. The measured time is 5 sec.
2.2 CNN
In recent years, Convolutional Neural Networks (CNN) is a typical deep learning method widely applied in fields such as image processing, pattern recognition, speech recognition, and medical engineering [23-27]. The biggest advantage of CNN structures is that there is no need for manual feature selection. CNN structures can be designed as one-dimensional (1D), two-dimensional (2D), or three-dimensional (3D) [28]. 1D-CNN structures are used in serial data processing, 2D-CNN in image and text recognition, and 3D-CNN in video and medical image recognition [24]. CNN generally consists of input, convolution, pooling, fully connected, and output layers.
The input layer can process multidimensional data in standardized forms. Standardized input data increases the efficiency of CNN by helping to improve learning performance.
The convolution layer is an important layer for CNN and uses the convolution operation denoted by "*" instead of general matrix multiplication. The learnable parameters of this layer consist of a set of learnable filters known as kernels. This layer creates a data matrix that scrolls through all the input data and multiplies it with the core data to extract some features of that data. In short, the convolution layer performs feature extraction. The neurons in this layer are called filters; they take the input data and turn it into output feature maps [29, 30]. Mathematically, the filter shifts from left to right until it reaches the maximum width of the image. Then the filter starts from the leftmost value of the next row. The process continues until all input data is complete. As a result, the output of each convolution layer is the convolution result of multiple input properties, and its mathematical relation is defined as follows [31]:
$y_i^{l+1}(j)=K_i^l * x^l(j)+b_i^l$ (1)
where, $K_i^l$ describe the weight of the ith filter kernel at layer l, $x^l(j)$ describe the jth local region at layer l, $b_i^l$ describe the bias of the ith filter kernel layer l, and $y_i^{l+1}(j)$ describe the input of the jth neuron in frame I of layer l+1.
After the convolution operations, it is applied to the activation function to enable the network to obtain a nonlinear expression of the input signal to make the learned features more divisible. In this step, Rectified Linear Unit (RELU) is generally used in the activation process to accelerate the CNN. The property of this function is that the derivative of the function is always one as long as the input value is greater than 0. Thus, the gradient explosion and gradient vanishing problems are also solved. In general, RELU can be defined as follows [32]:
$a_i^{l+1}(j)=f\left(y_i^{l+1}(j)\right)=\max \left\{0, y_i^{l+1}(j)\right\}$ (2)
The pooling layer is used to reduce the parameters of the neural network. With this layer, data is down sampled, reducing the width and height of a large matrix, reducing computational cost, and preventing overfitting. While average and maximum pooling can be used in this process, maximum pooling is more commonly used in practice. The maximum pooling formula is as follows [32]:
$p_i^{l+1}(j)=\max _{(j-1) W+1 \leq t \leq j W} \quad \left\{q_i^l(t)\right\}$ (3)
where, $(t \in[(1-j) W+1, j W]$ represent the width pooling and $p_i^{l+1}(j)$, represent the value of the neuron at layer l+1, and $q_i^l(t)$ represent the value tth neuron in the ith feature at layer l.
The fully connected layer connects the neurons of the previous and subsequent layers. It usually transforms the output of the last pooling layer into a one-dimensional flattened matrix that also functions as the input of the fully connected layer. Also, this layer can integrate differentiated local information into the convolution or pooling layer. Fully connected layer general formula [32]:
$z^{l+1}(j)=f\left(\sum_{i=1}^m \sum_{t=1}^n W_{i t j}^l a_i^l(t)+b_j^l\right)$ (4)
where, f represents the RELU function, and zl+1(j) represents the activation value of the layer l+1. The output layer is known as the layer where classification labels are created. In this layer, a softmax classifier is generally based on logistic regression and has linear classifier features with a multi-class classification format.
Figure 3. Details on the designed CNN architecture
The 1D-CNN architecture designed for this study is shown in Figure 3. The proposed 1D-CNN has five Convolution (Conv) layers with filter sizes of 1×1, 2×2, 4×4, 2×2 and 1×1 respectively. Also, the two release layers have a release rate of 0.051 and 0.1, respectively. fully connected layers contain 100 and 6 neurons, respectively.
2.3 LSTM
LSTM, whose general structure is given in Figure 4, is a special Recurrent Neural Network (RNA) model developed by Hochreiter and Schmidhuberm [32].
Figure 4. The architecture of the LSTM cell
LSTM structurally has a memory cell and gate mechanism to solve the gradient burst and gradient disappearance problems that mainly occur in RNA models [31-34]. Thanks to the memory cell's structure, it provides long-term recall of information [35]. The update gate determines this memory cell (gt), input gate (it), forget gate (ft), and output gate (ot) mechanisms [34], and this process is performed by the six equations given below [31].
$g_t=\tanh \sigma\left(W_g x_t+W_g h_{t-1}+b_g\right)$ (5)
$i_t=\sigma\left(W_i x_t+W_i h_{t-1}+b_i\right)$ (6)
$f_t=\sigma\left(W_f x_t+W_f h_{t-1}+b_f\right)$ (7)
$o_t=\sigma\left(W_o x_t+W_o h_{t-1}+b_o\right)$ (8)
$c_t=f_t * c_{t-1}+i_t * g_t$ (9)
$h_t=o_t * \tanh \left(c_t\right)$ (10)
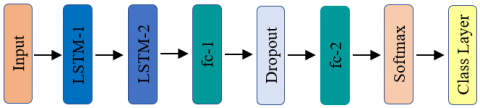
where, tanh(·) is the hyperbolic tangent function, W refers to the weights matrix, σ(·) refers to the sigmoid function, ct refers to the memory cell, ht refers to the output of the LSTM, and b refers to the bias vector. The 1D-LSTM architecture designed for this study is shown in Figure 5. The proposed 1D-LSTM contains two fully connected (fc) layers of 100 and 6 neurons, respectively, along with two dropout layers with a 0.5 dropout rate. Softmax and Class layers are also present.
Figure 5. Details on the designed LSTM architecture
2.4 Time-domain descriptors
Time-Domain Descriptors (TDD), whose block diagram is given in Figure 6, are one method used to classify hand movements from EMG signals [36]. This algorithm can be represented as a function of X[k] Discrete Fourier transform (DFT) frequency, using the DFT first from the EMG signal defined as X(j) with j=1, 2, …, N, N length, and fs sampling frequency. The basis of TDD method is based on Parseval's theorem, whose principal derivatives state that the sum of the squares of the function is equal to the sum of the squares of its transformation.
Figure 6. Block diagram of the time-domain descriptors [36]
$\begin{aligned} & \sum_{j=0}^{N-1}|x[j]|^2=\frac{1}{N} \sum_{j=0}^{N-1}\left|X[k] X^*[k]\right| =\sum_{j=0}^{N-1} P[k] \\ & \end{aligned}$ (11)
where, P[k] is the power spectrum with phase omitted. k is the frequency index, and the result is the product of multiplying X[k] by its conjugate X[k] divided by N.
As a result of the fact that the whole frequency definition of the Fourier transform is symmetric to the zero frequency, direct access to the power spectral density in the time domain is challenging. Therefore, we must deal with the entire spectrum, including positive and negative frequencies. However, this situation can be solved by using Parseval's theorem and the time derivative property of the Fourier transform for nonzero values. As seen in Figure 6, TDD consists of six features (f1, f2, ..., f6), the details of which are given below [36, 37].
Root squared zero order moment: This property shows the total power in the frequency domain and can be described by the following equation:
$\bar{m}_0=\sqrt{\sum_{j=0}^{N-1} x[j]^2}$ (12)
Root squared second and fourth order moments: Hjorth argues that the second moment can be seen as a power, but as a power with a varying spectrum, denoted by the notation k2P[k], which corresponds to the frequency function kX[k]. The first derivative of the time function is the time equivalent of a frequency function multiplied by k [38].
$\begin{aligned} & \bar{m}_2=\sqrt{\sum_{j=0}^{N-1} k^2 P[k]}=\sqrt{\frac{1}{N} \sum_{j=0}^{N-1}(k X[k])^2} =\sqrt{\frac{1}{N}} \sum_{j=0}^{N-1}(\Delta x[j])^2 \\ & \end{aligned}$ (13)
A repetition of this procedure gives the moment.
$\bar{m}_4=\sqrt{\sum_{j=0}^{N-1} k^4 P[k]}=\sqrt{\frac{1}{N}} \sum_{j=0}^{N-1}\left(\Delta^2 x[j]\right)^2$ (14)
Similarly, like the 4th order moment in Eq. (14), the 8th order moment can be defined as follows:
$\bar{m}_8=\sqrt{\sum_{j=0}^{N-1} k^8 P[k]}=\sqrt{\frac{1}{N}} \sum_{j=0}^{N-1}\left(\Delta^4 x[j]\right)^2$ (15)
Taking the 4th and 8th derivatives allows us to calculate the spectral moments in the time domain while reducing the signal's overall energy. Therefore, we apply a power transformation as follows to normalize the m0, m4, and m8 range and reduce the effect of noise on all moment-based features.
$m_0=\frac{\bar{m}_0^\lambda}{\lambda}, m_4=\frac{\bar{m}_4^\lambda}{\lambda}, m_8=\frac{\bar{m}_8^\lambda}{\lambda}$ (16)
With λ is empirically set to 0.1. Following that, the first three features derived from these variables are defined as follows:
$f_1=\log \left(m_0\right), f_2=\log \left(m_0-m_4\right), f_3=\log \left(m_0-m_8\right)$ (17)
Sparseness (SP): The sparseness feature measures how much energy is contained in a vector's few constituent parts. It is provided as.
$f_4=\log \left(\frac{m_0}{\sqrt{m_0-m_2} \sqrt{m_0-m_4}}\right)$ (18)
Irregularity Factor (IF): a measurement that reflects the proportion of upward zero crossings to peak crossings. Only in terms of their spectral moments can the number of upward zero crossings (ZC) and the number of peaks (NP) in a random signal be represented. The equivalent characteristic can be expressed as:
$f_5=\log \left(\frac{Z C}{N P}\right)=\log \left(\frac{\sqrt{\frac{m_4}{m_0}}}{\sqrt{\frac{m_8}{m_4}}}\right)=\log \left(\frac{m_4}{\sqrt{m_0 m_8}}\right)$ (19)
Waveform Length Ratio (WL): given that the waveform length feature is defined as the addition of the absolute values of the signal derivatives, we describe our WL feature as the ratio of the first derivative's waveform length to the second derivative's waveform length.
$f_6=\log \left(\frac{\sum_{j=0}^{N-1}\left|\Delta^2 x\right|}{\sum_{j=0}^{N-1}\left|\Delta^4 x\right|}\right)$ (20)
With the approach of TDD detailed above, 19 features are extracted from EMG signals, each channel represented by 1×3000 data points and 19×2 features for two channels. A 19×12 feature matrix is obtained from the EMG signals of each person's six basic hand movements.
2.5 Minimal-redundancy-maximal-relevance
MRMR is used to improve the performance of the relationship between the features obtained in feature extraction and the target classes [39]. The redundancy of some features in the feature extraction process can negatively affect the learning accuracy [40]. The MRMR feature selection algorithm eliminates this negative situation and reduces the computational cost of the proposed models by reducing the feature redundancy according to the level of relevance. In particular, the maximization of the relevance of a feature subset S to the class label c is referred to as max relevance, denoted as max D(S, c). According to the study [5], a feature subset's importance is indicated by the following:
$D(S, c)=\frac{1}{|S|} \sum_{f_i \in S} \Phi\left(f_i, c\right)$ (21)
where, the relevance of a feature fi to c is indicated by Φ(fi, c).
Based on pair-wise feature reliance, the term "feature redundancy" is used. If two important characteristics are strongly correlated, losing one of them would not significantly affect the other's ability to discriminate based on class. Min-redundancy, A feature subset of mutually incompatible features, is chosen using min R(S). According to the following definition, feature subset R(S) redundancy:
$R(S)=\frac{1}{|S|^2} \sum_{f_i, f_j \in S} \Phi\left(f_i, f_j\right)$ (22)
Accordingly, given a subset of features, the m-1 selected feature of Sm-1 should select the mth feature that best meets the criteria in Eq. (23):
$\max _{f_{j \notin S m-1}}\left[\Phi\left(f_i, c\right)-\frac{1}{m-1} \sum_{f_i \in S} \Phi\left(f_i, f_j\right)\right]$ (23)
2.6 Support vector machine
In this section, SVM, one of the popular classification methods, is used to extract features from medical signals and classify features consisting of a combination of features obtained from 1D-CNN and LSTM methods [41].
SVM is one of the widely used machine learning methods based on Vapnik's statistical learning theory, which classifies data by separating them with linear and nonlinear boundaries [42]. The main function of this method is based on finding the maximum margin hyperplane that will provide optimal separation of the data by transforming the input data into a higher dimensional space [35, 43]. The hyperplane where w represents the normal vector and b means bias can be defined by Eq. (24):
$f(x)=w^T \cdot x+b$ (24)
The relation to optimizing the hyperplane can be defined by Eq. (25):
$\left\{\begin{array}{c}\min \left\{\frac{1}{2}\|w\|^2\right\} \\ \left\{\begin{array}{l}y_i-w^T x_i-b \leq \alpha \\ w^T x_i+b-y_i \leq \alpha\end{array}\right.\end{array}\right.$ (25)
where, x defines the deviation between f(x) and the target yi. Eq. (25) can be expressed as follows, considering the regularization parameter (C), and the slack variable (ξi).
$\left\{\begin{array}{c}\min \left\{\frac{1}{2}\|w\|^2+C \times \sum_{i=1}^n\left(\xi_i+\xi_i^*\right)\right\} \\ \left\{\begin{array}{l}y_i-w^T x_i-b \leq \alpha+\xi_i \\ w^T x_i+b-y_i \leq \alpha+\xi_i^*\end{array} \quad \xi_i, \xi_i^* \geq 0\right.\end{array}\right.$ (26)
Since Eq. (26) is in a non-convex form, it can be optimized in Eq. (27) by adding the Lagrange multiplier (δi):
$f(x)=\sum_{i=1}^n\left(\delta_i-\delta_i^*\right) K\left(x_i, x\right)+b$ (27)
where, K(xi, x) is the kernel function. Although many kernel functions exist, the Gaussian radial basis function (RBF) is generally used.
Based on deep learning and TDD feature classification, the proposed hybrid model is evaluated for Accuracy (Acc), recall, Specificity (Spc), Precision (Pre), F1-score, and receiver operating characteristic (ROC) analysis. The analysis makes use of a confusion matrix defined by the following metrics:
True-Positive (TP) is the number of outcomes in which the proposed model correctly classifies the positive class.
False-Positive (FP) is the number of incorrect outcomes in which the proposed model incorrectly classifies the positive class.
True-Negative (TN) is the number of outcomes in which the proposed model correctly classifies the negative class.
False-Negative (FN) is the number of outcomes in which the proposed model incorrectly classified the negative class.
The relations for these metrics are given in Eqns. (28)-(32).
$A c c=\frac{\mathrm{TP}+\mathrm{TN}}{\mathrm{TP}+\mathrm{TN}+\mathrm{FP}+\mathrm{FN}} \quad \times 10$ (28)
Recall $=\frac{\mathrm{TP}}{\mathrm{TP}+\mathrm{FN}} \times 100$ (29)
$\mathrm{Spc}=\frac{\mathrm{TN}}{\mathrm{TN}+\mathrm{FP}} \times 100$ (30)
Pre $=\frac{\mathrm{TP}}{\mathrm{TP}+\mathrm{FP}} \times 100$ (31)
F1 Skor $=\frac{2 \times \text { Recall } \times \text { Pre }}{\text { Recall }+ \text { Pre }} \times 100$ (32)
Experimental works of the proposed model were carried out in Matlab with 32 GB RAM, NVIDIA P2200 Quadro GPU card, and Intel Xeon Silver 3.3 GHz processor installed on the 10 Pro Operating System.
In experimental studies, EMG signals of 1×3000 size for each channel of 5 different volunteers were used, details given in Section 2.1. Two different experimental studies were conducted to detect basic hand grip movements, utilizing the 1D-CNN, LSTM, and TDD+SVM models separately and using the three models together (hybrid).
Firstly, for the training of the proposed 1D- CNN and LSTM models, the data set is randomly divided into two parts, 86.67% training and 13.33% testing. The performances of 1D-CNN and LSTM models, whose details are given in sections 2.2 and 2.3, respectively, depend on many hyperparameters such as learning rate, batch size, number of training periods, dropout rates, and number of hidden neurons. In this study, after empirical evaluation that considers various combinations of hyperparameters to determine the appropriate value of the parameters, the training process was completed with the CNN model through the SGDM optimizer with a fixed learning rate of 0.01, 32 mini-batch size arrays, and iterations at 60 epochs.
Likewise, the Adam optimizer trained the LSTM model with an initial learning rate of 0.006, 64 mini-batch size arrays, and iterations at 70 epochs. The training of both models has been completed with loss rates of 0.12 and 0.10, respectively. It is desired that deep learning models have minimum loss values during training, which shows that they provide a more robust fit performance to the training data. After completing the training of both deep learning models according to the above parameters, the classification results of the test data are given in Table 1.
From the same data set with TDD, feature extraction from EMG signals and classification with SVM is as follows.
Nineteen features are extracted from 1×3000 data points in each channel of a subject's handgrip movement and represented by 19×2 features for the two channels. A 95×12 feature matrix is obtained from the dataset's EMG signals of 1 subject. These features are then applied to the SVM to classify hand gestures. Classification performances of each person's basic hand movements in experimental studies of each model at this stage are shown in Table 1.
The maximum performance was attained in subject 2 with 100% of all evaluation criteria, as shown in Table 1 results using 1-D CNN. Subject 1, subject 3 in LSTM classification results, and subject 2, subject 4 in TDD+SVM classification results achieved the highest performance. In both methods, accuracy, recall, Spc, pre, and F1 scores were 95.833%, 95.833%, 99.167%, 96.667%, and 95.767% success rates, respectively.
In the second experiment, features to distinguish basic hand movements from EMG signals were extracted separately from 1D-CNN, LSTM and TDD models. One hundred features are extracted from the 1d-CNN FC-2 layer, 100 from the FC layer of LSTM, and 228 from the TDD. Then, the most effective features of each model are selected and combined with the MrMr feature selection approach. In this process step, the 13 most effective features for 1d-CNN, 15 for LSTM and 150 for TDD are extracted. When these features are combined, a total of 178 most effective features are obtained. The SVM classification performances of each subject's combined most effective features are shown in Table 2.
According to the results in Table 2, accuracy and recall performance evaluation criteria of 95.83%, specificity of 99.16%, precision of 96.67% and F1 score of 95.76% were achieved in subjects 1 and 2. In addition, 100% performance was achieved in all performance evaluation criteria in peer 3, subject 4, and subject 5.
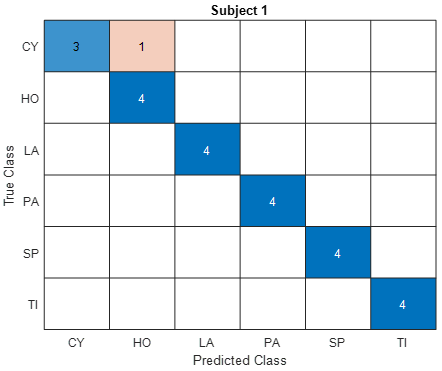
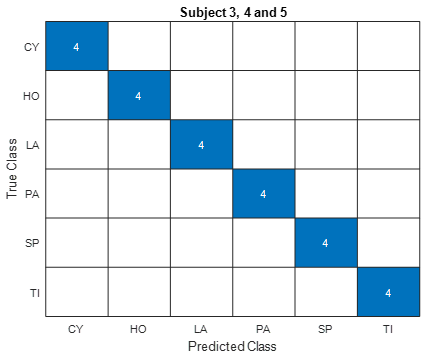
Figures 7-9 show the confusion matrices of the proposed hybrid model for the classification of basic hand grip movements of 5 subjects in the dataset. The purpose of confusion matrices is generally to provide an opportunity to see the classification sensitivity of each basic hand grip movement and its ratio to precision. In confusion matrices, rows represent actual class values, and columns represent the proposed method's predicted class. As seen in the confusion matrix of subject 1 in Figure 7, the actual cylindrical (CY) hand grip was incorrectly identified as the proposed hybrid model hook (HO). It is classified with 75% accuracy in CY hand grip movement and 100% accuracy in all other hand grip movements. In total, a 95.83% accuracy rate was reached in the classification of all hand grip movements. The proposed model predicted all other hand grip movements correctly.
A similar situation is also seen in the confusion matrix of subject 2 in Figure 8. The proposed hybrid model incorrectly detected the hand grasp, which is a hook (HO), as cylindrical (CY). The proposed model predicted all other hand grip movements correctly. In other words, the proposed model is classified with 75% accuracy in HO hand grip movement and 100% accuracy in all other hand grip movements. In total, a 95.83% accuracy rate was reached in the classification of all hand grip movements.
As seen in Figure 9 confusion matrix of subject 3, subject 4, and subject 5, all hand grip movements are predicted correctly by the proposed hybrid model. In other words, the proposed model is classified as 100%accuracy in all (CY, HO, LA, PA, SP, TI) hand grasping movements.
Table 1. Classification performances of 1-D CNN, LSTM, and TDD+SVM models (%)
|
Subject No |
|
1-D CNN |
LSTM |
TDD+SVM |
|
Subject 1 |
Acc |
95.833 |
95.833 |
91.667 |
|
Recall |
95.833 |
95.833 |
91.667 |
|
|
Spc |
99.167 |
99.167 |
98.333 |
|
|
Pre |
96.667 |
96.667 |
94.444 |
|
|
F1 |
95.767 |
95.767 |
91.905 |
|
|
Subject 2 |
Acc |
100.000 |
95.833 |
95.833 |
|
Recall |
100.000 |
95.833 |
95.833 |
|
|
Spc |
100.000 |
99.167 |
99.167 |
|
|
Pre |
100.000 |
96.667 |
96.667 |
|
|
F1 |
100.000 |
95.767 |
95.767 |
|
|
Subject 3 |
Acc |
91.667 |
95.833 |
87.500 |
|
Recall |
91.667 |
95.833 |
87.500 |
|
|
Spc |
98.333 |
99.167 |
97.500 |
|
|
Pre |
92.500 |
96.667 |
88.333 |
|
|
F1 |
91.601 |
95.767 |
87.434 |
|
|
Subject 4 |
Acc |
91.667 |
91.667 |
95.833 |
|
Recall |
91.667 |
91.667 |
95.833 |
|
|
Spc |
98.333 |
98.333 |
99.167 |
|
|
Pre |
93.333 |
94.444 |
96.667 |
|
|
F1 |
91.534 |
91.111 |
95.767 |
|
|
Subject 5 |
Acc |
91.667 |
87.500 |
83.333 |
|
Recall |
91.667 |
87.500 |
83.333 |
|
|
Spc |
98.333 |
97.500 |
96.667 |
|
|
Pre |
93.333 |
92.857 |
91.667 |
|
|
F1 |
91.534 |
88.312 |
83.333 |
Table 2. Proposed hybrid model and classification results (%)
|
|
Acc |
Recall |
Spc |
Pre |
F1-Score |
|
Subject 1 |
95.83 |
95.83 |
99.16 |
96.67 |
95.76 |
|
Subject 2 |
95.83 |
95.83 |
99.16 |
96.67 |
95.76 |
|
Subject 3 |
100.00 |
100.00 |
100.00 |
100.00 |
100.00 |
|
Subject 4 |
100.00 |
100.00 |
100.00 |
100.00 |
100.00 |
|
Subject 5 |
100.00 |
100.00 |
100.00 |
100.00 |
100.00 |
Table 3. Comparison of the performance of the proposed model and the state-of-the-art models
|
Authors |
Feature extraction |
Classification models |
Classification accuracy (%) |
||||
|
Subject #1 |
Subject #2 |
Subject #3 |
Subject #4 |
Subject #5 |
|||
|
Sapsanis et al. [44] |
EMD |
Linear classifier |
87.25 |
88.05 |
85.53 |
90.42 |
94.80 |
|
Ruangpaisan at al. [45] |
SVD |
SMO |
96.67 |
98.89 |
96.67 |
98.89 |
100.00 |
|
Iqbal et al. [46] |
SDV-PAC |
k-NN |
82.78 |
87.67 |
83.11 |
90.00 |
90.00 |
|
Akben [47] |
Histogram |
k-means |
93.04 |
86.66 |
97.00 |
99.23 |
97.66 |
|
Subasi et al. [14] |
WPD |
Rotation forest |
95.56 |
88.88 |
92.22 |
92.22 |
98.33 |
|
Nishad et al. [12] |
TQ WT |
k-NN |
98.33 |
97.78 |
99.44 |
98.89 |
98.33 |
|
Yavuz and Eyupoglu [48] |
Cepstral coefficients |
GRNN |
98.33 |
99.48 |
99.44 |
99.78 |
98.69 |
|
Miften et al. [16] |
LSGS |
AB-k-means |
98.00 |
99.00 |
99.00 |
99.00 |
99.00 |
|
The Proposed model |
CNN+LSTM+TDD |
SVM |
95.83 |
95.83 |
100.00 |
100.00 |
100.00 |
Figure 7. Confusion matrix for the proposed model using Subject 1
Figure 8. Confusion matrix for the proposed model using Subject 2
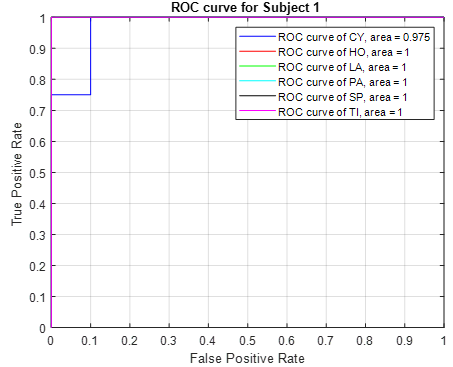
Receiver Operating Characteristic (ROC) curves are shown in Figure 10 and Figure 11, respectively, to more effectively show the performance of each hand grip movement of Subjects 1 and 2, where 100% performance was not achieved in the proposed hybrid model. The Area Under the Curve (AUC) value in the curves of the cylindrical (CY) grip movement in Subject 1 is 0.97, and the AUC in the hook (HO) hand grip in Subject 2 is 0.98.
The proposed model was compared in terms of classification accuracy with some state-of-the-art methods using the same data set, and the results are given in Table 3. Sapsanis et al. [44] created the dataset used in all these studies in 2013 and proposed a method based on feature extraction with EMD and a linear classifier. The proposed method recorded the lowest accuracy rate for subject 3, with 85.43%, and the highest accuracy rate for subject number 5, with 94.80%.
Figure 9. Confusion matrix for the proposed model using Subjects 3, 4, and 5
Figure 10. ROC curve of the proposed model for subject 1
Figure 11. ROC curve of the proposed model for subject 2
Ruangpaisarn and Jaiyen [45] proposed a method that references the singular value decomposition (SVD) and sequential minimal optimization (SMO) methods. They performed feature extraction from EMG data with SVD. They then applied it to SMO to classify basic hand movements. In this study, the lowest accuracy rate of 96.67% was recorded in subjects 1 and 3, while the highest accuracy rate was recorded for subject 5 with 100%.
Iqbal et al. [46] have suggested using SVD for feature extraction and k-NN for classification. They used PCA to size-reduce their features after subtracting them with SVD from the EMG signals. Finally, they applied the k-NN classifier to classify hand gestures. In experimental studies, the lowest accuracy rate of 82.78% was recorded in subject 1, and the highest accuracy rate was recorded in subjects 4 and 5 at 90%.
Akben [47] proposed a method based on histograms and k-means. He used the histogram of the energy values of the EMG signals for feature extraction. Then, the classification of basic hand movements was performed with k-means. With the proposed method, the lowest accuracy rate of 86.66% was recorded in subject 2, and the highest accuracy rate of 99.23% was recorded in subject 4.
Yavuz and Eyupolu [48] proposed a method based on cepstrum analysis for EMG signals and basic hand movement classification. The proposed method used the cepstral analysis technique, mel-frequency cepstral coefficients (MFCC), to extract the EMG signal features. The features composed of MFCCs were then applied to a generalized regression neural network (GRNN) to classify basic hand movements. Subject number 1 was recorded with the lowest accuracy rate of 98.33%, and subject number 4 with the highest accuracy rate of 99.78% with the proposed method.
Considering the highest classification accuracies in Table 3, Yavuz et al. proposed methods of 98.33% and 99.48% accuracy scores obtained in subjects 1 and 2, respectively. In the other three subjects (subject 3, subject 4, and subject 5), the proposed 1D-CNN, LSTM, and TDD based hybrid model was 100% successful. All these results provided an accuracy increase of 0.22% to 0.56% compared to state-of-the-art methods in Subject 3, Subject 4, and Subject 5.
This paper proposes a new hybrid model based on deep learning from EMG signals and time-domain descriptive features to classify basic hand movements. The proposed model has three stages: feature extraction, selection, and classification. In the first stage, feature extraction is done from EMG signals with reference to 1-D CNN and LSTM deep learning models and time domain descriptive approach. In the second stage, in the MRMR feature selection approach, the most effective features of each model are selected and concatenated. In the final stage, the most effective features combined are used to feed the SVM to classify basic hand gestures.
The proposed model was evaluated using an EMG dataset consisting of five subjects public and including their basic movements such as Cylindrical (CY), Hook (HO), Lateral (LA), Palmar (PA), Tip (TI) and Spherical (SP). In the use of only 1-D CNN in the proposed hybrid model, the hand-grasp movements reached 95.83% in subject 1, 100% in subject 2 and 91.66% accuracy rate in other subjects (3, 4 and 5). In the use of the LSTM model alone, (1, 2 and 3) reached 95.83% in subjects, 91.66% in subject 4 and 87.50% accuracy rate in subject 5. Similarly, in the use of TDD+SVM alone, the subject reached 91.66% in subject 1, 95.83% in subjects 2 and 4, 87.5% in subjects 3 and 83.33% accuracy rate in subject 5. However, in the proposed hybrid model achieved an accuracy of 95.833% in the first two of the five subjects and 100% in the other three subjects. It also achieved an average accuracy of 98.34% and a specificity of 99.66% for five subjects.
Experimental results show that the proposed method outperforms subjects 3, 4, and 5 with 100% accuracy in all state-of-the-art studies using the same dataset. In the future, the proposed model, with remarkable results, could be applied as a control unit to improve the quality of life of hand-amputated patients and a robotic and prosthetic exoskeleton to mobilize the hand.
[1] Ouyang, G., Zhu, X., Ju, Z., Liu, H. (2013). Dynamical characteristics of surface EMG signals of hand grasps via recurrence plot. IEEE Journal of Biomedical and Health Informatics, 18(1): 257-265. https://doi.org/10.1109/JBHI.2013.2261311
[2] Torres-Castillo, J.R., López-López, C.O., Padilla-Castañeda, M.A. (2022). Neuromuscular disorders detection through time-frequency analysis and classification of multi-muscular EMG signals using Hilbert-Huang transform. Biomedical Signal Processing and Control, 71: 103037. https://doi.org/10.1016/j.bspc.2021.103037
[3] Samuel, O.W., Asogbon, M.G., Geng, Y., et al. (2019). Intelligent EMG pattern recognition control method for upper-limb multifunctional prostheses: advances, current challenges, and future prospects. IEEE Access, 7: 10150-10165. https://doi.org/10.1109/ACCESS.2019.2891350
[4] Kumar, D.K., Jelfs, B., Sui, X., Arjunan, S.P. (2019). Prosthetic hand control: A multidisciplinary review to identify strengths, shortcomings, and the future. Biomedical Signal Processing and Control, 53: 101588. https://doi.org/10.1016/j.bspc.2019.101588
[5] Taghizadeh, Z., Rashidi, S., Shalbaf, A. (2021). Finger movements classification based on fractional Fourier transform coefficients extracted from surface EMG signals. Biomedical Signal Processing and Control, 68: 102573. https://doi.org/10.1016/j.bspc.2021.102573
[6] Özküçük, M., Alçin, Ö.F., Gençoğlu, M. (2022). EMG Sinyalleri Kullanılarak GoogLeNet ve Çok Seviyeli DPD ile El Tutma Hareketlerinin Sınıflandırılması. Fırat Üniversitesi Mühendislik Bilimleri Dergisi, 34(1): 33-43. https://doi.org/10.35234/fumbd.932585
[7] Arı, A., Ayaz, F., Hanbay, D. (2019). EMG sinyallerinin kısa zamanlı fourier dönüşüm özellikleri kullanılarak yapay sinir ağları ile sınıflandırılması. Fırat Üniversitesi Mühendislik Bilimleri Dergisi, 31(2): 443-451. https://doi.org/10.35234/fumbd.545161
[8] Arı, A., Arı, B., Alçin, Ö.F. (2020). Elektromiyografi Sinyallerinin Permütasyon Entropi ve Bir Boyutlu Yerel İkili Özellikler Kullanılarak Sınıflandırılması. The Journal of Tepecik Education and Research Hospital, 30(1): 46-49.
[9] Lee, K.H., Min, J.Y., Byun, S. (2021). Electromyogram-based classification of hand and finger gestures using artificial neural networks. Sensors, 22(1): 225. https://doi.org/10.3390/s22010225
[10] Bhattachargee, C.K., Sikder, N., Hasan, M.T., Nahid, A.A. (2019). Finger movement classification based on statistical and frequency features extracted from surface emg signals. In 2019 International Conference on Computer, Communication, Chemical, Materials and Electronic Engineering (IC4ME2), pp. 1-4. https://doi.org/10.1109/IC4ME247184.2019.9036671
[11] Fang, Y., Liu, H., Li, G., Zhu, X. (2015). A multichannel surface EMG system for hand motion recognition. International Journal of Humanoid Robotics, 12(02): 1550011. https://doi.org/10.1142/S0219843615500115
[12] Nishad, A., Upadhyay, A., Pachori, R.B., Acharya, U.R. (2019). Automated classification of hand movements using tunable-Q wavelet transform based filter-bank with surface electromyogram signals. Future Generation Computer Systems, 93: 96-110. https://doi.org/10.1016/j.future.2018.10.005
[13] Sapsanis, C., Georgoulas, G., Tzes, A. (2013). EMG based classification of basic hand movements based on time-frequency features. In 21st Mediterranean conference on control and automation, pp. 716-722. https://doi.org/10.1109/MED.2013.6608802
[14] Subasi, A., Alharbi, L., Madani, R., Qaisar, S.M. (2018). Surface EMG based classification of basic hand movements using rotation forest. In 2018 Advances in Science and Engineering Technology International Conferences (ASET), pp. 1-5. https://doi.org/10.1109/ICASET.2018.8376887
[15] Khushaba, R.N., Kodagoda, S., Takruri, M., Dissanayake, G. (2012). Toward improved control of prosthetic fingers using surface electromyogram (EMG) signals. Expert Systems with Applications, 39(12): 10731-10738. https://doi.org/10.1016/j.eswa.2012.02.192
[16] Miften, F.S., Diykh, M., Abdulla, S., Siuly, S., Green, J. H., Deo, R.C. (2021). A new framework for classification of multi-category hand grasps using EMG signals. Artificial Intelligence in Medicine, 112: 102005. https://doi.org/10.1016/j.artmed.2020.102005
[17] Aslan, M. (2020). Normal cumulative distribution function and dispersion entropy based EMG classification. Sakarya University Journal of Computer and Information Sciences, 3(3): 325-333.
[18] Rabin, N., Kahlon, M., Malayev, S., Ratnovsky, A. (2020). Classification of human hand movements based on EMG signals using nonlinear dimensionality reduction and data fusion techniques. Expert Systems with Applications, 149: 113281. https://doi.org/10.1016/j.eswa.2020.113281
[19] Alçin, Ö.F. (2020). Fraktal Eğimden Arındırılmış Dalgalılık Analizi ve Pencereli Kare Ortalamanın Karekökü Tabanlı EMG Sınıflandırma. Fırat Üniversitesi Mühendislik Bilimleri Dergisi, 32(2): 359-368. https://doi.org/10.35234/fumbd.771205
[20] Arı, B., Alçin, Ö.F., Şengür, A. (2022). A lung sound classification system based on data augmenting using ELM-Wavelet-AE. Turkish Journal of Science and Technology, 17(1): 79-88. https://doi.org/10.55525/tjst.1063039
[21] Tuncer, T., Dogan, S., Subasi, A. (2020). Surface EMG signal classification using ternary pattern and discrete wavelet transform based feature extraction for hand movement recognition. Biomedical Signal Processing and Control, 58: 101872. https://doi.org/10.1016/j.bspc.2020.101872
[22] Sapsanis, C., Tzes, A., Georgoulas, G. (2014). sEMG for basic hand movements data set. UCI Machine Learning Repository.
[23] Wang, X., Mao, D., Li, X. (2021). Bearing fault diagnosis based on vibro-acoustic data fusion and 1D-CNN network. Measurement, 173: 108518. https://doi.org/10.1016/j.measurement.2020.108518
[24] Aslan, M. (2022). CoviDetNet: A new COVID‐19 diagnostic system based on deep features of chest x‐ray. International Journal of Imaging Systems and Technology, 32(5): 1447-1463. https://doi.org/10.1002/ima.22771
[25] Ari, B., Siddique, K., Alçin, Ö.F., Aslan, M., Şengür, A., Mehmood, R.M. (2022). Wavelet ELM-AE based data augmentation and deep learning for efficient emotion recognition using EEG recordings. IEEE Access, 10: 72171-72181. https://doi.org/10.1109/ACCESS.2022.3181887
[26] Ari, B., Sobahi, N., Alçin, Ö.F., Sengur, A., Acharya, U.R. (2022). Accurate detection of autism using Douglas-Peucker algorithm, sparse coding based feature mapping and convolutional neural network techniques with EEG signals. Computers in Biology and Medicine, 143: 105311. https://doi.org/10.1016/j.compbiomed.2022.105311
[27] Sobahi, N., Ari, B., Cakar, H., Alcin, O.F., Sengur, A. (2022). A new signal to image mapping procedure and convolutional neural networks for efficient schizophrenia detection in EEG recordings. IEEE Sensors Journal, 22(8): 7913-7919. https://doi.org/10.1109/JSEN.2022.3151465
[28] Li, T., Hua, M., Wu, X.U. (2020). A hybrid CNN-LSTM model for forecasting particulate matter (PM2. 5). Ieee Access, 8: 26933-26940. https://doi.org/10.1109/ACCESS.2020.2971348
[29] Balaha, H.M., El-Gendy, E.M., Saafan, M.M. (2021). CovH2SD: A COVID-19 detection approach based on Harris Hawks Optimization and stacked deep learning. Expert Systems with Applications, 186: 115805. https://doi.org/10.1016/j.eswa.2021.115805
[30] Turkoglu, M., Alcin, O.F., Aslan, M., Al-Zebari, A., Sengur, A. (2021). Deep rhythm and long short term memory-based drowsiness detection. Biomedical Signal Processing and Control, 65: 102364. https://doi.org/10.1016/j.bspc.2020.102364
[31] Zhang, W., Peng, G., Li, C., Chen, Y., Zhang, Z. (2017). A new deep learning model for fault diagnosis with good anti-noise and domain adaptation ability on raw vibration signals. Sensors, 17(2): 425. https://doi.org/10.3390/s17020425
[32] Hochreiter, S., Schmidhuber, J. (1997). Long short-term memory. Neural Computation, 9(8): 1735-1780. https://doi.org/10.1162/neco.1997.9.8.1735
[33] Demir, F., Sengur, A., Ari, A., Siddique, K., Alswaitti, M. (2021). Feature mapping and deep long short term memory network-based efficient approach for Parkinson’s disease diagnosis. IEEE Access, 9: 149456-149464. https://doi.org/10.1109/ACCESS.2021.3124765
[34] Li, Q., Huang, Q., Zhou, Y., Yang, T., Ran, M., Liu, X. (2021). Combined convolutional and LSTM recurrent neural networks for internal defect detection of arc magnets under strong noises and variable object types. IEEE Access, 9: 71446-71460. https://doi.org/10.1109/ACCESS.2021.3078709
[35] Aslan, M., Zurel, E.N. (2022). An efficient hybrid model for appliances classification based on time series features. Energy and Buildings, 266: 112087. https://doi.org/10.1016/j.enbuild.2022.112087
[36] Khushaba, R.N., Al-Ani, A., Al-Timemy, A., Al-Jumaily, A. (2016). A fusion of time-domain descriptors for improved myoelectric hand control. In 2016 IEEE Symposium Series on Computational Intelligence (SSCI), pp. 1-6. https://doi.org/10.1109/SSCI.2016.7850064
[37] Al-Timemy, A.H. (2017). An investigation of feature combinations of time-domain power spectral descriptors feature extraction for myoelectric control of hand prostheses. In 2017 Fourth International Conference on Advances in Biomedical Engineering (ICABME), pp. 1-4. https://doi.org/10.1109/ICABME.2017.8167530
[38] Hjorth, B. (1970). EEG analysis based on time domain properties. Electroencephalography and Clinical Neurophysiology, 29(3): 306-310. https://doi.org/10.1016/0013-4694(70)90143-4
[39] Peng, H., Long, F., Ding, C. (2005). Feature selection based on mutual information criteria of max-dependency, max-relevance, and min-redundancy. IEEE Transactions on Pattern Analysis and Machine Intelligence, 27(8): 1226-1238. https://doi.org/10.1109/TPAMI.2005.159
[40] Yang, J., Zhu, Z., He, S., Ji, Z. (2013). Minimal-redundancy-maximal-relevance feature selection using different relevance measures for omics data classification. In 2013 IEEE Symposium on Computational Intelligence in Bioinformatics and Computational Biology (CIBCB), pp. 246-251. https://doi.org/10.1109/CIBCB.2013.6595417
[41] Arı, A. (2020). Analysis of EEG signal for seizure detection based on WPT. Electronics Letters, 56(25): 1381-1383. https://doi.org/10.1049/el.2020.2701
[42] Vapnik, V.N. (2000). The Nature of Statistical Learning Theory. Springer New York, NY. https://doi.org/10.1007/978-1-4757-2440-0
[43] Wu, Y., Li, S. (2022). Damage degree evaluation of masonry using optimized SVM-based acoustic emission monitoring and rate process theory. Measurement, 190: 110729. https://doi.org/10.1016/j.measurement.2022.110729
[44] Sapsanis, C., Georgoulas, G., Tzes, A., Lymberopoulos, D. (2013). Improving EMG based classification of basic hand movements using EMD. In 2013 35th Annual International Conference of the IEEE Engineering in Medicine and Biology Society (EMBC), pp. 5754-5757. https://doi.org/10.1109/EMBC.2013.6610858
[45] Ruangpaisarn, Y., Jaiyen, S. (2015). sEMG signal classification using SMO algorithm and singular value decomposition. In 2015 7th International Conference on Information Technology and Electrical Engineering (ICITEE), pp. 46-50. https://doi.org/10.1109/ICITEED.2015.7408910
[46] Iqbal, O., Fattah, S.A., Zahin, S. (2017). Hand movement recognition based on singular value decomposition of surface EMG signal. In 2017 IEEE Region 10 Humanitarian Technology Conference (R10-HTC), pp. 837-842. https://doi.org/10.1109/R10-HTC.2017.8289085
[47] Akben, S.B. (2017). Low-cost and easy-to-use grasp classification, using a simple 2-channel surface electromyography (sEMG). Biomed Res, 28(2): 577-582.
[48] Yavuz, E., Eyupoglu, C. (2019). A cepstrum analysis-based classification method for hand movement surface EMG signals. Medical & Biological Engineering & Computing, 57: 2179-2201. https://doi.org/10.1007/s11517-019-02024-8