Xiaoying Yang![]() | Wanli Zhang*
| Wanli Zhang*![]()
© 2023 IIETA. This article is published by IIETA and is licensed under the CC BY 4.0 license (http://creativecommons.org/licenses/by/4.0/).
OPEN ACCESS
Straw coverage in wheat fields serves multiple purposes, encompassing insulation, moisture preservation, soil conservation, root stimulation, weed suppression, and fertilization. Despite these benefits, automatic recognition of straw coverage remains a challenge due to the difficulty in identifying fine straw accurately, leading to lower accuracy rates. A novel method has been developed to calculate field straw coverage rates, leveraging an improved AdaBoost algorithm and an enhanced Otsu algorithm. Initially, a nonlinear adjustment strategy utilizing the Sine wave is implemented, improving the weak classifier selection strategy. A new weighting coefficient calculation method is also introduced to enhance the classification performance of the AdaBoost algorithm. This improved AdaBoost algorithm then auto-determines whether the no-tillage seeder's working environment constitutes no-tillage land. The collected images of straw cover on non-arable land undergo median filtering denoising preprocessing. Subsequently, these images undergo a contrast enhancement process via grayscale and logarithmic transformations to highlight identifiable features of straw. Lastly, an enhanced Otsu algorithm is presented, which combines the merits of the maximum inter-class variance method (Otsu method) and the minimum Cross entropy segmentation algorithm. This leads to significant improvements in the classification and detection of straw coverage, verified by experimental results. The improved AdaBoost algorithm effectively recognizes the no-tillage seeder's working environment. Using the image processing algorithm developed, the calculation of field straw coverage is refined. When compared to the Otsu and K-means methods, the average error was reduced by approximately 49.3% and 33.8%, respectively, with the least misjudgment rate noted to be 5%.
straw coverage rate, conservation tillage, image processing, Adaboost algorithm, Otsu algorithm
The estimation of straw coverage rates in farmland is recognized as a crucial metric for assessing conservation tillage [1-5]. Conservation tillage, a contemporary agricultural system that primarily involves straw coverage and minimal tillage and seeding, is noted for its protective roles in farmland: inhibiting dust and soil erosion, preserving soil moisture, improving soil fertility, enhancing efficiency and cost-effectiveness, and reducing stubble burning and greenhouse gas emissions. In April 2020, China's Ministry of Agriculture and Rural Affairs put forth the "Northeast Black Soil Conservation Tillage Action Plan (2020-2025)", intending to enlarge the conservation tillage implementation area to 9.33×10⁶ hm2 by 2025 [6-9]. This plan outlined a comprehensive support system for conservation tillage, integrating policy, technical equipment, and promotion.
Straw coverage rate serves as a vital technical metric for conservation tillage and a critical foundation for straw return subsidies. Efficient and precise detection of straw coverage rate thus underpins the expansion of conservation tillage. Yet, national standards, such as GB/T 20865-2017, rely on manual methods, like the "rope pulling method", for straw coverage rate measurement. These methods are labor-intensive and inefficient, proving obsolete for the current agricultural machinery production needs in an era of "Internet plus" mode.
No-tillage seeders are a novel type of agricultural machine, working on the principle of mechanical force to directly sow seeds into the soil, thus eliminating the need for farmland operations. Their use can be optimized according to varying crops and soil types, ensuring appropriate seed placement in the soil for improved crop growth and yield. No-tillage seeders not only offer time and labor efficiency but also minimize soil erosion and energy consumption. However, straw coverage rates for no-tillage sowing surpass 70%, necessitating testing and evaluation of straw coverage rates prior to the implementation of no-tillage operations.
Addressing the primary issue of straw coverage rate identification and detection is critical for the widespread adoption of zero tillage seeders in China. The conventional methods for monitoring straw coverage, which are labor-intensive, time-consuming, inefficient, and susceptible to corruption, necessitate improvement. This research introduces an enhanced AdaBoost algorithm, addressing these deficiencies and providing an automated method for non-arable land detection in the working environment.
Image background segmentation plays an integral role in attaining straw coverage. The Otsu method has been identified as the optimal algorithm for automatic threshold selection in image segmentation. However, improper threshold selection can lead to misclassification of target and background areas, resulting in the loss of useful information in the image. This research proposes a combination of the improved Otsu method and corn straw image segmentation to enhance the accuracy of straw coverage calculation.
The significant contributions of this research include:
(1) An improved AdaBoost algorithm featuring a sine wave-based nonlinear adjustment strategy is proposed to address the issues of early stopping of training due to excessive clipping and the negligible acceleration effect from insufficient clipping. Furthermore, the weak classifier's weight coefficient is enhanced to overcome the limitations of the traditional AdaBoost algorithm, thereby augmenting the detection performance of the classifier.
(2) Features of the no-tillage sowing operation environment are extracted from the collected image information, and a strong classifier is constructed from the set of weak classifiers using the improved AdaBoost algorithm. A cascaded AdaBoost classifier is eventually obtained through cascading to automatically classify the no-tillage sowing operation environment, thereby augmenting the system's ability to detect and calculate straw coverage.
(3) Images identified as a no-tillage operation environment undergo preprocessing using median filtering to mitigate the effects of noise. Following this, a logarithmic transformation is applied to further enhance the grayscale image contrast, facilitating easier straw separation from the transformed image.
(4) An Otsu and minimum Cross entropy threshold segmentation algorithm based on variance weight is proposed, which combines the benefits and drawbacks of both algorithms. This algorithm introduces adaptive weight parameters (δ), adjusting the Otsu algorithm's threshold size to maximize image texture detail preservation, enhance image richness, effectively segment straw and land, and improve the algorithm's segmentation accuracy and stability.
The remaining sections of this research are organized as follows: Section 2 discusses related work. Section 3 delves into the automatic recognition technology of the no-tillage seeder working environment. Section 4 addresses straw recognition technology. The algorithm's effectiveness is evaluated via simulation experiments in Section 5, and Section 6 offers a summary of the research work.
In the pursuit of integrating novel generation information technologies such as Big Data, cloud computing, and the Internet of Things with modern agriculture, significant strides have been made towards swift and precise identification of field covers. The utilization of image methods, stemming from their cost-effectiveness and high efficiency, has garnered considerable interest as a means for field cover detection. A plethora of studies both domestically and internationally have been dedicated to this field, resulting in noteworthy outcomes.
Prabhu and Lakshmi [10] have introduced a framework for differentiating fruits from the background and recognizing overlapping fruits based on contour detection. Diverse fuzzy algorithms have been applied by Seyed Mehdi Nassiri to classify ripe tomatoes, with the Matlab image processing toolbox deployed for determining the color and size of the fruit [11]. Principle component analysis (PCA) has been employed for the discrimination of sensory profiles across various citrus fruits [12]. Image-based Convolutional Neural Networks (CNNs) were used by Sabadin et al. [13] to identify true positives among hypothetical haploid seeds for haploid seed identification.
Potena et al. [14] developed a sensing system for agricultural robots, incorporating multispectral cameras and utilizing the Convolutional Neural Network method to differentiate between weeds and crops. The effectiveness of this approach was substantiated via farm testing. Sabzi et al. [15] suggested a neural network-based strategy for identifying potatoes and three different weed types for targeted spraying. A random decision forest algorithm was proposed for the classification of residues in the soil, utilizing simple pixel comparisons and neighboring pixels with training offsets for individual pixel classification [16].
Highly accurate semantic segmentation algorithms, which require fewer training parameters and provide rapid execution speed, have been suggested to accurately segment straw and soil [17]. The color component spatial distance grayization algorithm and the improved Bernsen algorithm were used to compute straw coverage [18]. K-means clustering and zoning optimization based strategies have been proposed for the calculation of straw coverage [19]. An automatic segmentation optimization algorithm for multi-objective straw images, founded on multiple thresholds (DE AS MOGWO), has been proposed to improve image segmentation speed and accuracy [20].
Fast Fourier Transform combined with SVM has been used to identify straw images, designing multi-scale proportional filters to repair noise and image holes, rendering the algorithm applicable across a wide range of scenarios [21]. Winter wheat canopy images have been segmented using the maximum interclass variance method based on a * component of CIEL * a * b * color space and the Random forest algorithm based on sRGB and CIEL * a * b * color space, and segmentation accuracies were compared [22].
An automatic threshold segmentation algorithm has been used for straw coverage detection, primarily calculating the coverage rate through binary processing based on the disparate brightness of soil and straw. Nevertheless, the adaptability of this method under uneven lighting conditions was found lacking [23]. A technique that combines Sauvola and Otsu to binarize images and calculate straw coverage was proposed, boasting rapid detection speed and accurate straw coverage calculation, but it exhibited limited adaptability to changes in light [2].
These aforementioned methods primarily consider image segmentation processing, overlooking the prior recognition and classification of the images. As a result, they fail to achieve recognition of the no-tillage operation environment. The challenges posed by the scattered and diverse fragments of straw in the field, as well as difficulties in distinguishing between straw and soil under varying light conditions, lead to inaccuracies in straw coverage. To address these issues, the improved AdaBoost algorithm is initially used to recognize the no-tillage operation environment, followed by the application of the improved Otsu algorithm for image segmentation to enhance the precision of straw coverage calculation.
In the modern landscape of no-tillage seeding operations, the employment of monocular cameras has been observed to collect data pertaining to the working environment. Thus, the classification of such an environment becomes a critical consideration [24]. This study aims to contribute to this arena through the introduction of an enhanced AdaBoost algorithm for automatic recognition technology.
3.1 AdaBoost algorithm
Over the years, diverse algorithms have found their way into object classification and recognition research. One such algorithm that has garnered significant attention due to its high detection speed is the AdaBoost algorithm. Upon its proposal, it has seen wide-ranging applications, especially in face and image detection, leading to substantial advancements in this field [24].
The AdaBoost algorithm begins by assigning initial weights to all samples present within the training set. In each iteration, a weak learning algorithm is invoked, guided by the current sample distribution, thereby generating a weak classifier. In the course of this iterative process, weights of correctly classified samples are diminished while those of misclassified samples are increased. Upon the completion of iterations, weak classifiers are combined, considering their respective error rates, to form a strong classifier. A detailed overview of the AdaBoost algorithm process can be outlined as follows:
Step 1: (1) Input: Training set $S=\left\{\left(x_1, y_1\right),\left(x_1, y_1\right), \cdots,\left(x_i, y_i\right), \cdots,\left(x_m, y_m\right)\right\}$.
where, $x_i$ is the instance sample and $x_i \in X . y_i$ is a category marker and $y_i \in Y=\{+1,-1\}$. In this study, $y_i=1$ represents free farmland (positive sample), $y_i=-1$ represents non free farmland (negative sample), and m represents the number of training samples.
Step 2: Initialization: $D_1(i)=1 / m$ .
Step 3: Loop: $t=1,2,3, \cdots, T$:
(1) Select weak classifier ht: Under the current distribution Dt, train a weak classifier for each single feature, and select the one with the lowest error rate as the weak classifier for this cycle.
(2) Calculate the error rate of weak classifier ht, also known as weighted error.
$\varepsilon_{t=} \sum_{h_t\left(x_i\right) \neq y_i} D_t(i)$ (1)
If $\varepsilon_t>0.5$, then set $T=t-1$ and stop the iteration.
(3) Calculate the weighting coefficient of the weak classifier.
$\alpha_t=\frac{1}{2} \ln \frac{1-\varepsilon_t}{\varepsilon_t}$ (2)
(4) Update sample weights.
$D_{t+1}(i)=D_t(i) \exp \left(-\alpha_t y_i h_t\left(x_i\right)\right) / Z_t$ (3)
where, $Z_t=\sum_{i=1}^m D_t(i) \exp \left(-\alpha_t y_i h_t\left(x_i\right)\right)$ is a normalization factor.
Step 4: Obtain a strong classifier:
$(x)=\operatorname{sign}\left(\sum_{t=1}^T \alpha_t h_t\left(x_i\right)\right)$ (4)
3.2 Improved AdaBoost algorithm
In the established AdaBoost algorithm, a notable limitation lies in the fact that the coefficients of the foundational classifiers are solely contingent on the error rate, disregarding the condition of the sample weight distribution. This scenario fails to accurately mirror the performance of the foundational classifiers. Moreover, the selection of these classifiers, being dependent on the criterion of minimum error rate, results in the algorithm easily adapting and not ensuring effective generalization performance. Thus, an enhancement in the algorithm's generalization capability necessitates both differentiation and performance in foundational classifiers.
The modifications in the algorithm are primarily concentrated on steps 3 (1) and (3) of the original AdaBoost algorithm, altering the weak classifier selection strategy and the weighted coefficient of the weak classifier.
(1) Improvement of weak classifier selection strategy
The AdaBoost algorithm utilizes a strategy where the weight of correctly classified samples is reduced while that of misclassified samples is increased after each iteration. Thus, samples correctly classified after multiple iterations have less impact on classifier generation. In a bid to enhance this, Friedman et al. proposed the SWTAdaboost algorithm that trims samples that minimally impact the classifier [25]. Subsequently, Jia and Zhang [26] introduced DWTAdaboost to tackle the issue of premature iteration stopping common with SWTAdaboost.
They incorporated a concept known as the pruning coefficient (β), which represents the sum of the weights of each omitted sample. The samples with weights less than a threshold t(β) are excluded. The formula defining this threshold is as follows:
$\beta=\sum_{i=1}^m D_t(i) I\left[D_t(i)<t(\beta)\right]$ (5)
In the SWTAdaboost algorithm, the clipping coefficient, beta, remains unchanged during each iteration, which can often lead to premature termination and sub-optimal classification performance. To mitigate this, the DWTAdaboost algorithm was developed, introducing dynamic adjustments of the clipping coefficient. At the start of each iteration, a fixed clipping coefficient, beta, is assigned. If the trained weak classifier's weighted error rate across all sample sets exceeds 0.5, the iteration's clipping coefficient is reduced. This algorithm helps rectify the issues with the SWTAdaboost algorithm, but it still lacks the ability to set different betas as required.
The study cited as reference [27] suggests that using a sine curve, tangent curve, or logarithmic curve to adjust the inertia weight of particle swarms offers better optimization than traditional adjustment strategies. In light of this, a new strategy is proposed for the DWTAdaboost algorithm, inspired by the non-linear increase of the Sine wave in the interval [0, π/2]. This strategy involves the dynamic adjustment of the clipping coefficient, beta, using the Sine wave's non-linear property. This innovative method promises to optimize the performance of the algorithm by taking advantage of the unique characteristics of the sine curve.
$\beta=\sum_{i=1}^m \sin \left[D_t(i) \pi / 2\right] I\left[D_t(i)<t(\beta)\right]$ (6)
During training, the samples participating in the training are adaptively pruned according to β, which is obtained by the above formula, and the samples with greater influence are retained to participate in each iteration. This ensures the detection performance of the classifier while avoiding early stopping of training caused by excessive pruning, as well as the insignificant acceleration effect caused by insufficient pruning.
(2) Improvement of weighted coefficients for weak classifiers
The improved algorithm adopts a formula for solving weighted parameters that is different from the traditional AdaBoost algorithm:
$\alpha_t=\frac{1}{2} \ln \frac{1-\varepsilon_t}{\varepsilon_t}+k \times e^{p_t}$ (7)
where, k is a constant, $p_t=\sum_{h_t\left(x_i\right)=y_i} D_t(i)$, represents the cumulative sum of the weights of the correctly classified samples in the t-th iteration, which can represent the recognition ability of the weak classifier ht on positive samples.
In AdaBoost, a crucial aspect is the coefficient of the weak classifier, which determines its influence during the integration of classifiers. The weight distribution status of the sample mirrors the classification impact of the weak classifier. When calculating the coefficients of the weak classifier, it's essential to consider the weight distribution status of the sample.
The AdaBoost algorithm tends to assign greater weight to misclassified samples, resulting in a decrease in the number of misclassified samples with increasing iterations. However, the weight of these misclassified samples continues to rise. Due to normalization, the total weight of all samples is 1, which might lead to some correctly classified samples having extremely low weights.
The parameter pt reflects the quality of the sample distribution state. If pt is large, it implies that the weak classifiers are performing well and their weight should be increased during integration. On the other hand, if pt is small, it suggests that the number of misclassified samples is high, indicating that the weak classifiers are performing poorly, and their weight should be decreased during integration.
The formula $k \times e^{p_t}$ is an increasing function of pt , providing higher weight values for weak classifiers that have stronger recognition capabilities for positive samples under the same error rate, and thus, they play a more significant role in integration. This method overcomes the limitation of traditional AdaBoost, where the coefficients of the weak classifiers are solely related to the error rate and are independent of the sample weight distribution state, allowing a better reflection of the classification performance of the weak classifiers.
Nonetheless, it's important to note that excessively high k values can hinder the classifier's ability to recognize negative samples and reduce the diversity between base classifiers. If the k value is too small, it can reduce the rate of convergence and diminish the accuracy of the algorithm. Therefore, the k value should be chosen carefully to optimize the performance of the classifier. According to a study, for k<1/120, the algorithm's convergence can be ensured [28].
To select the most reasonable value of k and ensure the maximum accuracy of the improved AdaBoost algorithm, tests were conducted in the interval [0.0068-0.0083]. The experimental results are shown in Figure 1. The experiments revealed that the error rate is the lowest when K=0.008. Hence, in this experiment, the K value is chosen to be 0.008.
Figure 1. Errors under different values of k
Figure 2. Comparison of inspection results
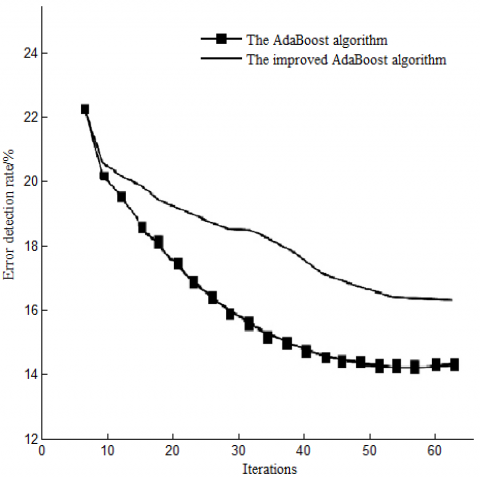
This study presents an improved version of the AdaBoost algorithm and evaluates its effectiveness via experiments carried out on MATLAB. Both the traditional AdaBoost algorithm and the improved version were employed for this purpose. The outcomes of these experiments can be viewed in Figure 2.
Upon examining the figure, one can observe a continuous decline in the error detection rate of the improved algorithm as the iteration times increase. More importantly, this rate is considerably lower than that of the traditional AdaBoost algorithm. This implies that the classification capabilities of the enhanced algorithm have indeed seen significant improvement.
Upon automatic classification of image information gathered by the zero tillage seeder using the enhanced AdaBoost algorithm, it is ascertained if the given environment is suitable for zero tillage seeding operations. In an affirmative scenario, the system then carries out the process of detecting and calculating straw coverage. However, it should be noted that the use of monocular cameras for information collection can lead to environmental pollution, thereby directly affecting the accuracy of image segmentation and subsequent straw coverage detection results. Consequently, image preprocessing becomes a crucial step prior to the calculation of straw coverage rate to eliminate these deviations.
4.1 Image preprocessing
4.1.1 Noise removal preprocessing
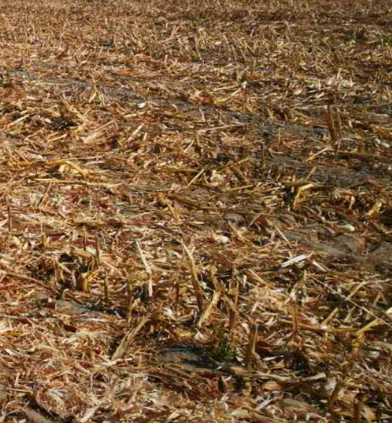
Figure 3. Original image
(a)
(b)
Figure 4. (a) Grayscale map; (b) Grayscale histogram
(a)
(b)
Figure 5. (a) Gray scale map; (b) Gray scale histogram
Images of straw coverage obtained from field conditions under natural circumstances are generally impacted by an array of natural noises, thus warranting the need for image filtration. Three popular methods of denoising filtering are frequently employed, namely median filtering, mean filtering, and Gaussian filtering. Figure 3 displays the working environment of the no-tillage seeder as captured by the camera. Considering the extensive information and noise inherent in the captured color image, it poses challenges and delays for processing. Therefore, before the filtration step, the image undergoes greyscaling, as shown in Figure 4(a) [1, 2].
Median filtering, a nonlinear smoothing method, replaces the brightness value of the current point with the median brightness value of several neighboring points. Given that the median brightness of these points remains unaffected by the noise of individual points, median filtering stands as an effective method for noise elimination [29]. For effective noise removal without compromising the original features of the image, a pixel window of 3x3 median filtering is implemented for image filtration. The results of this process are depicted in Figure 5(a).
Following median filtering, a grayscale map and histogram are drawn, as illustrated in Figures 4(b) and 5(b). Observation of the gray distribution reveals that the straw corresponds to the area with a high gray value, while the soil aligns with the low gray value area. Noise influence makes the layering in the original histogram less pronounced, thereby making the separation of straw and land challenging. Post median filtering, the histogram layering is more apparent, thereby increasing the contrast between straw and land.
(a)
(b)
Figure 6. (a) Grayscale map; (b) Grayscale histogram
To further enhance the layering of the image histogram, a logarithmic transformation is employed to improve the contrast of the grayscale image. The logarithmic transformation function can be represented as:
$t=c \times \log (1+s)$ (8)
where, c represents the scale constant, s denotes the source grayscale value, and t stands for the transformed target grayscale value. This logarithmic function operates on each element in the input image matrix s.
Figure 6(a) showcases the image post logarithmic transformation, and Figure 6(b) presents the transformed histogram. It can be observed from these images that the histogram stratification is more evident, and the contrast between the soil area and the straw area is markedly pronounced. This contrast significantly simplifies the process of separating the straw from the logarithmically transformed image.
4.2 Calculation of straw coverage rate based on improved Otsu
4.2.1 Otsu algorithm
The Otsu method, owing to its simplicity and ease of implementation, has been extensively deployed in image segmentation tasks. It leverages the principle of maximal interclass variance to compute the segmentation threshold [30]. This method operates on the assumption that the original image exhibits a grayscale spectrum of L, with the grayscale values spanning from 0 to L-1. Considering the total number of pixels in the image as N, and ni as the count of pixels possessing grayscale value i , the probability of occurrence of pixels with grayscale value i, P(i), is calculated as ni /N.
A threshold 't' is presumed to exist that bifurcates the image into two distinct regions: the background, denoted by $C_0(0 \leq i \leq t)$, and the target region, denoted by $C_1(t<i \leq L-1)$.
The pixel proportion in the background region to the entire image is computed as:
$\omega_0(t)=\sum_{i=0}^t P(i)$ (9)
while that in the target region to the entire image is:
$\omega_1(t)=\sum_{i=t+1}^{L-1} P(i)$ (10)
The background region's average grayscale, u0(t) , is the ratio of the sum of product of each grayscale value i and its probability P(i) to the total pixel proportion in the background region:
$u_0(t)=\frac{\sum_{i=0}^t i P(i)}{\omega_0(t)}$ (11)
The average grayscale for the target region, u1(t), is calculated similarly (Eq. (12)):
$u_1(t)=\frac{\sum_{i=t+1}^{L-1} i P(i)}{\omega_1(t)}$ (12)
The interclass variance is determined as:
$\sigma_B^2(t)=\omega_0(t) \omega_1(t)\left(u_0(t)-u_1(t)\right)^2$ (13)
The optimal threshold, Th1, under the Otsu method is that which maximizes this interclass variance:
$T h_1=\operatorname{Arg} \max _{0 \leq t \leq L-1} \sigma_B^2(t)$ (14)
4.2.2 Minimum cross entropy
The minimum cross entropy is utilized for determining the optimal threshold for image segmentation, focusing on the least possible difference in information quantity prior to and subsequent to the segmentation process [31]. An image, characterized by a grayscale value range of [0~L-1], is divided into two distinct regions based on a threshold denoted as Th2- the region of interest and the remaining region. The frequency of pixels with grayscale 'i' is denoted by H(i), and the grayscale mean values of the target and background regions are represented by u0(t) and u1(t) , respectively. Cross entropy is thus expressed by the equation:
$I(t)=\sum_{i=0}^t i H(i) \ln \frac{i}{u_0(t)}+\sum_{i=t+1}^{L-1} i H(i) \ln \frac{i}{u_1(t)}$ (15)
The value of Th2 that minimizes I(t) is deemed the optimal threshold, represented by the equation:
$T h_2=\operatorname{Arg} \min _{0 \leq t \leq L-1} I(t)$ (16)
4.2.3 The improved Otsu algorithm
An improved version of the Otsu algorithm is proposed, with an aim to maximize the threshold for effective extraction of straw based on grayscale differences between straw and land. The optimal threshold is determined using the maximum interclass variance of the two parts obtained post-image segmentation. This interclass variance acts as a measurement for the difference between straw and land.
However, due to inevitable overlaps between straw and land in actual images, it becomes challenging to achieve complete separation using a single threshold. As a response to this challenge, an improved Otsu algorithm is proposed which combines the merits of the original Otsu algorithm and the minimum cross entropy segmentation algorithm. The variance in regions segmented by the two algorithms is considered, and a variance weight-based Otsu and minimum cross entropy threshold segmentation algorithm is put forth.
Through the introduction of weight parameters denoted by δ, the threshold size is adaptively adjusted to efficiently segment straw and land, enhancing the accuracy and stability of the algorithm. This is represented by the equation:
$T h=\delta \times T h_1+(1-\delta) T h_2$ (17)
$\delta=\frac{\sigma_{C_0+}^2+\sigma_{C_1}^2}{\sigma_{C_0+}^2 \sigma_{C_1}^2+\sigma_{D_0+}^2+\sigma_{D_1}^2}$ (18)
where, Th1 denotes the threshold obtained through the Otsu algorithm, Th2 denotes the threshold obtained via the minimum cross entropy method, and δ represents the weight parameter. $C_0, C_1, D_0$, and $D_1$ represent the four image regions segmented by thresholds Th1 and Th2, while $\sigma_{C_0}^2, \sigma_{C_1}^2, \sigma_{D_0}^2$, and $\sigma_{D_1}^2$ represent the variances of these regions.
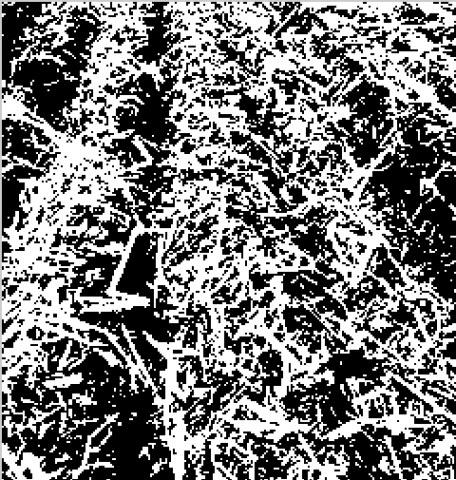
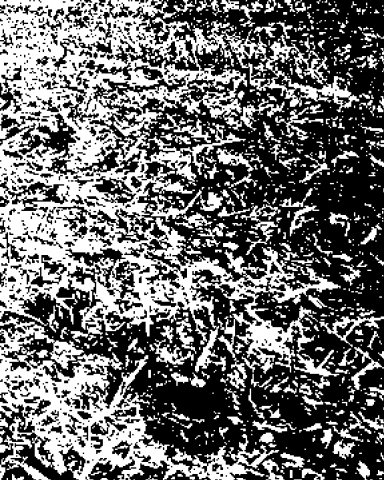
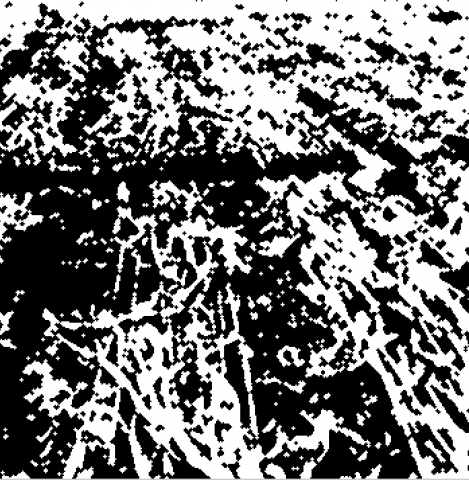
Using the Otsu algorithm and the improved algorithm in this article to segment the images in Figure 7, the segmentation results are shown in Figure 8 and Figure 9. Among them, the white area corresponds to the target (straw), and the black area corresponds to the background (soil). significant improvements are observed. These images not only become richer but also display enhanced edge recognition, thereby improving segmentation accuracy.
|
(a) |
(b) |
(c) |
Figure 7. Original image
|
(a) |
(b) |
(c) |
Figure 8. Segmentation results of Otsu
|
(a) |
(b) |
(c) |
Figure 9. Segmentation results of the improved Otsu
|
(a) |
(b) |
(c) |
Figure 10. Binary image after noise reduction
Figure 11. Flow chart for measuring straw coverage rate
4.2.4 Calculation of straw coverage rate
The identification of straw coverage commences with image segmentation. Initially, the image is cropped to ensure the focus is purely on the desired subject. Subsequently, the image threshold is optimised through a refined Otsu algorithm, which results in a binary image that distinguishes between straw and land areas. Within the obtained image, as exemplified in Figure 9, certain scattered points and small holes exist, which are indicative of noise areas. These noise areas can impede the accurate extraction of straw information, hence necessitating additional noise reduction measures.
In order to suppress this noise and smooth the image, methods from mathematical morphology such as corrosion and expansion are employed. By implementing a combination of open operation (corrosion followed by expansion) and closed operation (expansion followed by corrosion), the image is further denoised. This noise reduced binary image is illustrated in Figure 10. Upon comparing Figures 9 and 10, it becomes evident that the noise reduction treatment significantly reduces scattered points and small holes in the image. Such a treatment can successfully filter out disturbances caused by noise and uneven lighting, therefore, enhancing the image's capacity to recognize fine and coarse straw.
The straw coverage rate is calculated by the ratio of the number of pixels in the segmented white area (representing straw) to the total number of pixels in the image. This metric provides a quantifiable measure for the detection system to ascertain straw coverage. The equation is given as:
$K=\frac{T}{N} \times 100 \%$ (19)
where, K denotes the straw coverage rate, T corresponds to the number of straw pixels, and N signifies the total number of image pixels.
An illustration of the process involved in measuring straw coverage is provided in Figure 11. The detailed procedure assists in clarifying the individual steps involved in obtaining the final coverage rate, therefore, offering a comprehensive understanding of the methodology. The modifications to the text have endeavored to align with the stringent standards of top-tier academic journals such as Nature and Science, which emphasize clear, concise language usage, and logical, coherent argument structure.
5.1 Evaluation methods
The evaluation of the proposed methodology for the calculation of straw coverage in farmland employed three distinct indicators: the correlation coefficient, relative error, and misjudgment rate. The correlation coefficient provided a measure of correlation between the results yielded by the computational technique for straw coverage and those obtained through manual detection. A higher correlation suggested a better alignment between these two methods.
In contrast, the relative error offered an insight into the extent of deviation in the error of the computation technique. Lastly, the misjudgment rate was used to ascertain the accuracy of the judgement based on the calculation results, in conjunction with the actual subsidy level results, framed within the real-world subsidy distribution scenario. The correlation coefficient was calculated by Eq. (20):
$r=\frac{\sum_{k=1}^n\left(v_{s k}-\overline{v_s}\right)\left(v_{d k}-\overline{v_d}\right)}{\sqrt{\sum_{k=1}^n\left(v_{s k}-\overline{v_s}\right)^2 \sum_{k=1}^n\left(v_{d k}-\overline{v_d}\right)^2}}$ (20)
In the formula, $v_{s k}$ and $v_{d k}$ stand for the standard and detection values of straw coverage, respectively, whereas $\bar{v}_s$ mean and $\overline{v_d}$ mean represent the means of $v_{s}$ and $v_{d}$, respectively.
The relative error was computed as per Eq. (21):
$E r r=\frac{C_d-C_t}{C_t} \times 100 \%$ (21)
In this equation, Cd and Ct represent the detected and true values of straw coverage, respectively.
The misjudgment rate was calculated using the following formula:
$M r=\frac{G_r}{G_r+G_t} \times 100 \%$ (22)
where, Gr and Gt symbolize the number of incorrect and correct level judgments, respectively.
In the manual measurement method, the proportion of the straw coverage area to the total land area was taken as the straw coverage rate. Figure 12 displays the map of straw area ascertained manually. The green line surrounding the area in the figure demarcates the manually determined straw coverage area. The artificial straw coverage rate, Z, was determined by computing the ratio of the actual field area, S, to the total land area, A, and expressed as a percentage, according to Eq. (23):
$Z=\frac{S}{A} \times 100 \%$ (23)
Figure 12. Manual measurement method
Figure 13. Correlation coefficient with artificial methods
Figure 13 shows the correlation coefficient between the manual notation and this method, approximately 0.9277, signifying that the results procured by this computational technique are very akin to those achieved by manual labeling methods. This observation suggests that the current methodology can successfully ascertain the corn straw coverage.
5.2 Comparative analysis of different techniques
The comparative examination of varied methods was conducted, incorporating the traditional Otsu algorithm, classical K-means algorithm, and the enhanced algorithm discussed in this study. A sample size of 100 was employed and the outcomes were contrasted against the manual Notation. The results, presented in Table 1, indicate a notable superiority of the methodology proposed in this study over both the Otsu algorithm and the classical K-means algorithm in regards to the mean error and misjudgment rate. An appreciable reduction of 49.3% and 33.8% in the average error was achieved, and the misjudgment rate was the lowest, at 5%.
Albeit the advanced algorithm proposed in this study necessitated the most prolonged processing duration of 850 ms due to the incorporation of an enhanced AdaBoost algorithm for the classification of no-tillage land and the augmentation of the Otsu threshold computation methodology, the processing time remained under 1 second. This rate is satisfactory for image detection response speed under field conditions.
Table 1. Comparative performance of different straw coverage detection algorithms
|
Method |
Average error/% |
Misjudgment rate/% |
Processing time/ms |
|
Ostu |
7.7% |
14 |
340 |
|
K-means |
5.9% |
10 |
483 |
|
Improved Ostu |
3.9% |
5 |
850 |
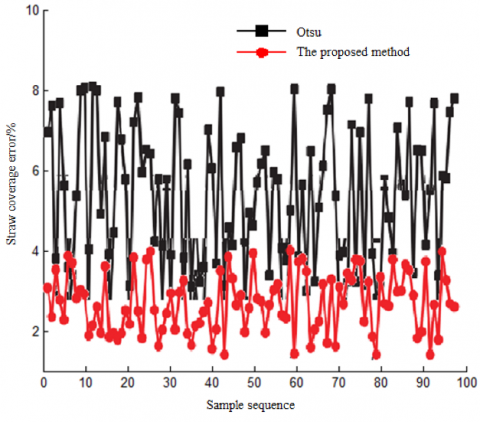
Straw coverage rates were computed using the Otsu algorithm and the method delineated in this study, with error curves drawn for different recognition methodologies based on test data, as shown in Figure 14.
Figure 14. Comparison curve for errors
The graph illustrates that the detection methodology applied in this study is substantially more precise than the Otsu algorithm, displaying an improvement of approximately 49%. This technique enables accurate identification of straw and consistent, stable operation on agricultural machinery, exhibiting a certain degree of universality.
The algorithm incorporated in this study employs a threshold calculation method founded on weight coefficients, supplanting the original Otsu algorithm's threshold calculation methodology. This substitution permits the smooth identification of shadows induced by root stubble and overlapping caused by the color at the bottom of the root stubble being similar to the soil background even under bare root conditions, consequently enhancing the accuracy of straw coverage detection.
The study utilized camera technology to gather image data, following which the AdaBoost algorithm was employed for classification of the collected images, effectively determining whether the operational environment of the zero tillage seeder could be categorized as non-arable land.
In no-tillage conditions, noise reduction was achieved through median filtering, and logarithmic transformation greyscale enhanced the contrast between images of straw and land. This process effectively segregated the two elements in the image.
An improved version of the Otsu algorithm, combined with the minimum Cross entropy method, was utilized for threshold calculation. Corrosion and expansion methods further denoised and smoothed the image, thereby enhancing the precision of image segmentation. These processes served to resolve the issue of straw coverage rate calculation, verifying the efficacy of the algorithm through rigorous experimentation. The observed detection error of the straw coverage rate was less than 5%.
Future studies will focus on transferring the straw coverage measurement algorithm onto a hardware platform to elevate the precision of the measurement. This progression aligns with the objective of advancing the field of agricultural technology by enhancing operational accuracy and efficiency. The research is essential in the context of sustainable farming practices and is expected to contribute positively to agricultural methodologies.
The innovations presented in this study underscore the value of integrating technology with agricultural practices, providing a path forward for further research and development in this area. The methodology and findings can act as a foundation for subsequent studies seeking to address similar challenges in agriculture.
This research was funded by the Open Project of Anhui Key Laboratory of Intelligent Building and Building Energy Efficiency of Anhui University of Architecture and Architecture (Grant No.: IBES2020KF03); Anhui Provincial Key Research and Development Program (Grant No.: 202104g01020005); State Key Laboratory of Tea Biology and Resource Utilization of Anhui Agricultural University (Grant No.: SKLTOF20220131); Domestic Visiting Program for Outstanding Young Teachers in Colleges and Universities (Grant No.: gxgnfx2021154 and gxgnfx2022078); Anhui Provincial Education Department (Grant No.: 2022AH051372); Subsidy Projects for Surplus Funds of Suzhou University (Grant No.: szxy2023jyjf86, szxy2023jyjf80 and szxy2023jyjf71).
[1] Wang, Q.J., Wang, X.L., Li, H.W., He, J., Zhang, Y.F., Huang, X.Y. (2017). Effect of maize straw mulching on winter wheat growth in double cropping area of Northern China. Transactions of the Chinese Society for Agricultural Machinery, 48: 192-198. https://doi.org/10.6041/j.issn.1000-1298.2017.08.022
[2] Wang, L., Xu, L., Wei, S. (2017). Straw coverage detection method based on Sauvola and Otsu segmentation algorithm. Agricultural Engineering, 17(4): 29-35.
[3] Yu, G., Hao, R., Ma, H., Wu, S., Chen, M. (2018). Research on image recognition method based on SVM algorithm and ESN algorithm for crushed straw mulching rate. Journal of Henan Agricultural Sciences, 47(11): 155-160. https://doi.org/10.15933/j.cnki.1004-3268.2018.11.028
[4] Wang, J.W., Tang, H., Wang, J.F. (2017). Comprehensive utilization status and development analysis of crop straw resource in Northeast China. Transactions of the Chinese Society for Agricultural Machinery, 48(5): 1-21. https://doi.org/10.6041/j.issn.1000-1298.2017.05.001
[5] He, M. (2016). Effects of straw return on changes in organic matter in black soil. Beijing: Chinese Academy of Agricultural Sciences.
[6] Ma, Q., Wan, C.F., Wei, J., Wang, W.T., Wu, C.C. (2023). Calculation method of straw coverage based on U-Net and feature pyramid network. Journal of Agricultural Machinery, 54(1): 224-234. https://doi.org/10.6041/j.issn.1000-1298.2023.01.022
[7] Liu, Y.Y., Zhou, X.K., Wang, Y.Y., Yu, H.Y., Geng, C., He, M. (2022). Improvement of U-Net model for detecting straw cover in conservation tillage fields. Optical Precision Engineering, 30(9): 1101-1112.
[8] Yang, G.Y., Sun, C.L. (2022). Common problems and solutions in the promotion of agricultural machinery. Jiangxi Agriculture, 2022(12): 110-111.
[9] Meng, F.J., Yu, X.F., Gao, J.L., Zhao, Y.P. (2020). Constraint bottleneck and breakthrough path of conservation tillage development in black soil. Issues in Agricultural Economics, 2020(2): 135-142.
[10] Prabhu, A., Lakshmi, S. (2021). Identification and yield estimation of mature fruits using modified watershed algorithm. In 2021 2nd International Conference for Emerging Technology (INCET), Belagavi, India, pp. 1-6. https://doi.org/10.1109/INCET51464.2021.9456198
[11] Nassiri, S.M., Tahavoor, A., Jafari, A. (2022). Fuzzy logic classification of mature tomatoes based on physical properties fusion. Information Processing in Agriculture, 9(4): 547-555. https://doi.org/10.1016/j.inpa.2021.09.001
[12] Feng, S., Gmitter Jr, F.G., Grosser, J.W., Wang, Y. (2021). Identification of key flavor compounds in citrus fruits: A flavoromics approach. ACS Food Science & Technology, 1(11): 2076-2085. https://doi.org/10.1021/acsfoodscitech.1c00304
[13] Sabadin, F., Galli, G., Borsato, R., Gevartosky, R., Campos, G.R., Fritsche‐Neto, R. (2021). Improving the identification of haploid maize seeds using convolutional neural networks. Crop Science, 61(4): 2387-2397. https://doi.org/10.1002/csc2.20487
[14] Potena, C., Nardi, D., Pretto, A. (2017). Fast and accurate crop and weed identification with summarized train sets for precision agriculture. In Intelligent Autonomous Systems 14, pp. 105-121. https://doi.org/10.1007/978-3-319-48036-7_9
[15] Sabzi, S., Abbaspour-Gilandeh, Y., García-Mateos, G. (2018). A fast and accurate expert system for weed identification in potato crops using metaheuristic algorithms. Computers in Industry, 98: 80-89. https://doi.org/10.1016/j.compind.2018.03.001
[16] Riegler-Nurscher, P., Prankl, J., Bauer, T., Strauss, P., Prankl, H. (2018). A machine learning approach for pixel wise classification of residue and vegetation cover under field conditions. Biosystems Engineering, 169: 188-198. https://doi.org/10.1016/j.biosystemseng.2018.02.011
[17] Liu, Y.Y., Zhang, S., Yu, H.Y., Wang, Y.Y., Wang, J.M. (2020). Straw detection in complex scenes based on semantic segmentation. Optical Precision Engineering, 28(1): 200-211. https://doi.org/10.3788/OPE.20202801.0200
[18] Yang, G., Ding, B., Song, X. (2021). Research on improved bernsen straw coverage image processing algorithm. Journal of Electronic Measurement and Instrumentation, 35(12): 158-166. https://doi.org/10.13382/j.jemi.B2104555
[19] An, X.F., Wang, P., Luo, C.H., Meng, Z.J., Chen, L.P., Zhang, A.Q. (2021). Calculation method of straw coverage based on K-means clustering and zoning optimization. Journal of Agricultural Machinery, 52(10): 84-89.
[20] Liu, Y.Y., Sun, J.H., Zhang, S.J., Yu, H.Y., Wang, Y.Y. (2020). Detection of straw coverage using multi threshold multi-target UAV image segmentation optimization algorithm. Journal of Agricultural Engineering, 36(20): 134-143. https://doi.org/10.11975/j.issn.1002-6819.2020.20.016
[21] Li, J., Lv, P., Yuan, Y., Li, Y., Wei, L., Qin, Q. (2019). Fast Fourier transform combined with SVM algorithm to identify surface corn straw coverage. Journal of Agricultural Engineering, 35(20): 194-201. https://doi.org/10.11975/j.issn.1002-6819.2019.20.024
[22] Liu, Y.D., Cui, R.X. (2015). Winter wheat canopy image segmentation based on visible light spectrum and Random forest algorithm. Spectroscopy and Spectral Analysis, 35(12): 3480-3484. https://doi.org/10.3964/j.issn.1000-0593(2015)12-3480-05
[23] Hao, R.F. (2019). Research on estimation of regional straw coverage based on scattered sample images. Shijiazhuang: Hebei University of Science and Technology.
[24] Fang, T. (2020). Research on monitoring system of subsoil depth and straw coverage based on ARM. Changchun University of Science and Technology.
[25] Friedman, J., Hastie, T., Tibshirani, R. (2000). Additive logistic regression: A statistical view of boosting (with discussion and a rejoinder by the authors). The Annals of Statistics, 28(2): 337-407. https://doi.org/10.1214/aos/1016218223
[26] Jia, H., Zhang, Y. (2009). Fast Adaboost training algorithm by dynamic weight trimming. Chinese Journal of Computers, 32(2): 336-341. https://doi.org/10.3724/SP.J.1016.2009.00336
[27] Sun, B.W., Wei, S.Y. (2019). DV Hop localization algorithm based on adaptive adjustment strategy grey wolf algorithm. Computer Science, 46(5): 77-82. https://doi.org/10.11896/j.issn.1002-137X.2019.05.012
[28] Zhu, L. (2022). Ensemble learning AdaBoost and classifier fusion research. Jiangnan University, https://doi.org/10.27169/d.cnki.gwqgu.2022.001926
[29] Ye, R.Q., He, H., Zheng, P., Xu, M.X., Wang, L. (2022). A Raman spectral spike elimination algorithm based on median filtering and statistics. Spectroscopy and Spectral Analysis, 42(10): 3174-3179.
[30] Bhandari, A.K., Ghosh, A., Kumar, I.V. (2020). A local contrast fusion based 3D Otsu algorithm for multilevel image segmentation. IEEE/CAA Journal of Automatica Sinica, 7(1): 200-213. https://doi.org/10.1109/JAS.2019.1911843
[31] Guo, Y.C., Zhou, L.F. (2015). Research on anisotropic Diffusion model based on pulse coupled neural network and image entropy. Journal of Physics, 64(19): 140-150. https://doi.org/10.7498/aps.64.194204