Hüseyin Eldem*![]() | Erkan Ülker
| Erkan Ülker![]() | Osman Yaşar Işıklı
| Osman Yaşar Işıklı![]()
© 2023 IIETA. This article is published by IIETA and is licensed under the CC BY 4.0 license (http://creativecommons.org/licenses/by/4.0/).
OPEN ACCESS
Deep learning is more extensively used in image analysis-based classification of wounds with an aim to facilitate the monitoring of wound prognosis in preventive treatments. In this paper, the classification success of AlexNet architecture in pressure and diabetic foot wound images is discussed. Optimizing training parameters in order to increase the success of Convolutional Neural Network (CNN) architectures is a frequently discussed problem. This paper comparatively examines the effects of optimization of the training parameters of CNN architecture on classification success. The paper examines how the optimizer algorithm, mini-batch size (MBS), maximum epoch number (ME), learning rate (LR), and LearnRateSchedule (LRS) parameters, which are among the training parameters used in combination in architectural training, perform at different values. The best results were obtained with an accuracy of 95.48% at the 10e-4 value of the LR parameter. When the changes in the evaluation metrics during the parameter optimization experiments were examined, it was seen that the LR parameter produced optimum values at 10e-4. As a result, when the Accuracy metric and standard deviations were examined, it was determined only with the LR parameter. No general conclusion could be reached regarding the other parameters.
wound image classification, AlexNet, parameter optimization, deep learning
Pressure and diabetic foot wounds, which are highly costly for the patients and health systems of countries, have recently been studied by many scholars and need to be researched further. There is a need for studies that can contribute to reducing the sufferings of the patients, raising the comfort standards of the patients, solution of problems of prolonged care in hospitals and high costs [1-6].
Classifying wounds with high accuracy is highly important for identifying patients at risk and following wounds during the healing process. To find solutions for these problems, many studies are carried out on wound image classification with deep learning methods, which can help in the correct classification of wound tissues [7-12]. These studies, which seek to contribute to the analysis and follow-up of images obtained from patients in hospitals, contribute to this field by developing new approaches as well as addressing existing approaches and making improvements. In addition, research also contributes by examining parameters of deep learning methods that give the best results in a specific database, by finding a correlation between parameters, or by investigating the parameters that yield optimum values.
There is no consensus on setting each parameter in the CNN models. Therefore, for each data set, it is important to investigate the sensitivity of the parameters in the CNN model to make predictions with high accuracy. To develop any deep learning model, the optimal values of a set of hyperparameters must be decided, such as activation functions, batch size, and learning rate, among others, in order to fine-tune each of these layers [13-16].
AlexNet architecture, which is one of the first Convolutional Neural Network (CNN) architectures used in the classification of medical images from deep learning architectures, is still used in studies. This architecture has been researched more extensively especially after winning the ImageNet large-scale visual recognition challenge (ILSVRC) competition in 2012 and has been used in image classification since then [17].
The success of AlexNet architecture may vary depending on the parameters used in the training phase [18]. Zhao et al. [18] worked on AlexNet and LeNet architectures to optimize kernel size, learning rate, batch size, and weight parameters with an aim to improve the performance of CNN architecture for Lung nodule Classification.
In the literature, there are also studies on parameter optimization using optimization methods in combination with different CNN architectures. Using Bees Algorithm (BA) and Bayesian Optimization (BO) methods, Alamri et al. [19] have developed a hybrid method tested on cifar10DataDir, handwritten digits and concrete crack images benchmark data sets to optimize the parameters and weights of CNN architecture. Xu et al. [20] diagnosed lung cancer with a modified version of the Bowerbird Optimization Algorithm for the optimal design of the Alexnet architecture and the optimal selection of features.
Using AlexNet CNN architecture, this paper examines how training parameters used in the classification of original pressure and diabetic foot wound images affect success and which parameter(s) are effective in finding the optimum results. The study attempts to find the optimizer algorithm, mini-batch size (MBS), max epoch number (ME), learning rate (LRS), and LearnRateSchedule (LRS) parameters that yield the highest success in the classification of wound images.
The organization of the paper is as follows. The data set, pre-processing steps, information about AlexNet architecture, and parameters used in this study are explained in Section 2. Information about the data set used is also presented in this section. Details of the experiments are presented in Section 3. This section also includes interpretations of the experimental results of AlexNet architecture. The paper has been finalized with the conclusion section.
Classification of wound images is of great importance for efficient wound treatment so that appropriate treatment methods can be recommended quickly. In this section, details are given about the data set, AlexNet architecture, and the effects of training parameters that are effective in wound classification.
2.1 DataSet
In this paper, 2090 images categorized as granular, necrotic and slough and collected from different patients in Karaman Training and Research Hospital were used. 1045 of them were diabetic foot wounds and 1045 of them were pressure wounds, and the images were taken with mobile devices.
In the pre-processing step, the images were resized to 227×227 pixels according to the image input size of the AlexNet model. In addition, data were augmented with rotation, reflection, brightness, and gauss noise methods to avoid overfitting during the training phase.
2.2 AlexNet architecture
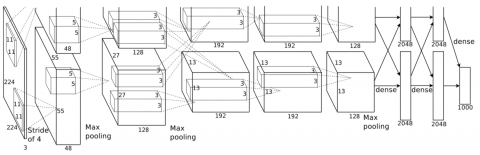
The AlexNet is a deep convolutional neural network (DCNN) [17]. The architecture has a depth of 8 layers. The first five layers consist of a convolutional layer and the last three layers consist of a fully connected layer. In between these set of layers are max pooling and activation layers. The architecture uses the ReLu activation function. There are two dropout layers. The output layer uses the Softmax activation function. The image input size is 227×227. AlexNet architecture is shown in Figure 1.
Figure 1. AlexNet architecture [13]
The training parameters used in the classification of wound images in Alexnet architecture are important for minimizing the loss function by changing the weights at each epoch during the training of the network. The aim is to increase the accuracy of the model by reducing the losses. Parameter optimization was done considering the importance of the parameters used in training.
2.3 Effects of parameters for wound classification
Among the parameters used in Alexnet architecture, the study examines how the optimizer algorithm, mini-batch Size, maximum Epoch Number, learning rate, and Learn Rate Schedules affect training success.
The optimizer algorithm contributes to reducing losses by changing weights and learning rates in CNN architecture. In this way, it aims to obtain the most accurate results possible and to increase the model’s success [21, 22]. In this study, stochastic gradient descent with momentum (SGDM), Root Mean Squared Propagation (RMSProp), and Adaptive Moment Estimation (Adam) methods were used as optimizer algorithms.
Mini batch size is the number of subsamples processed on the network in each iteration of the CNN architecture. In each iteration, subsamples with the amount of value specified in this parameter are processed until the end of the CNN. In this way, the error rate of the network is calculated and the weights of the network are updated. When the mini-batch size does not fit into the size of the CPU or GPU memory used in the training of the network, network training cannot be performed due to insufficient memory. Therefore, appropriate MBS values should be selected according to the number of layers of CNN architecture and hardware competence [23]. In the studies, the mini-batch size should be determined as a value that can fit into the GPU memory and should be less than the training dataset. It is usually taken as the power of two (such as 8, 16, 32).
The maximum number of epochs (ME) is the number of times the network runs across the entire network (forward-backpropagation) of the entire data set used in training. It is the updating of the weights by fully processing all of the samples in the determined batch size in the network. Too many epochs cause the network to memorize. Generally, the number of epochs ranges between 10 and 150. In this study, the maximum number of epochs was 10, 25, 50, 100, and 150.
Learning Rate is the update rate model weights during backpropagation. A large learning rate parameter allows the algorithm to learn quickly in case the learning rate parameter is large. However, if the network tries to learn in large steps, it is generally improbable that the conditions for finding the most relevant result will be met. It causes the weight values at which the architecture will produce high accuracy to be missed. If the LR parameter is too small, it is possible to find the optimum result since the weights of the network will be updated in small steps. This can lead to such problems as a long architectural training period and not reaching the optimum result by lodging in a local solution. Therefore, finding the appropriate LR is important for the success of CNN architecture. Generally, the LR parameter is assigned the value starting at 10e-1 and its multiples (such as 10e-2, 10e-3, 10e-4).
Finally, the Learning Rate Schedule parameter determines whether the LR parameter remains constant throughout the training of the network. It takes two values as none and piecewise. If it is set as none, it remains constant throughout the training. When it is piecewise, it is reduced at a certain rate (LearnRateDropFactor) in certain periods (LearningRateDropPeriod). In this way, the initial weight change rate of the architecture is reduced. Towards the end of the training, smaller changes (fine-tuning) are provided.
In this paper, the classification performances of AlexNet CNN architecture were examined on the diabetic and pressure wound images data set collected from patients with the help of an expert physician. The optimization of training parameters used in AlexNet architecture is discussed. The parameters examined are given in Table 1.
A computer with the technical specifications of Xeon Silver 4114 2.2GHz processor, 32 GB RAM, and NVIDIA Quadro P5000 (x2) GPU was used to get the experimental results in the training and testing processes. All the experiments were performed using the Matlab platform. The wound image data set used in the experiments is divided into training (80%) and test (20%) data.
In order to measure the performance of the classification models, the actual image value on a pixel basis is compared with the result values predicted by the model. TP, TN, FP, and FN used in evaluation metric formulas stand for true positive (correctly validated sample), true negative (correctly rejected sample), false positive (falsely validated sample), and false negative (falsely rejected sample), respectively. Detailed information about the specified evaluation metrics can be found in the study by Fawcett [24]. The evaluation metrics used in this study are given in Table 2. All evaluation metrics are interpreted as a percentage value.
As optimizers, sgdm, rmsprop, and adam optimization methods were used. As the mini-batch size, the values of 8, 16, 32, 64, and 128 were used in the experiments. All parameter combinations (see Table 1) were run at 10, 25, 50, 100 and 150 epochs, which are frequently used in the literature. In addition, 10e-2, 10e-3, 10e-4, 10e-5 and 10e-6 Initial learning Rate parameter values were run in LearnRateSchedule in pairs of none and piecewise. In cases where the LearnRateSchedule parameter is piecewise, the influencing LearnRateDropFactor parameter is kept constant at 0.9 and the LearnRateDropPeriod parameter is kept constant at 5 [25].
A total of 750 (3x5x5x5x2) training were carried out by using the pairs of each parameter given above in the experiments. Measurement metrics in Table 1 were used to compare model classification achievements. The parameter set that is the best in all metrics was selected as the criterion for finding the most successful parameter matches. The best results obtained in all experiments conducted with AlexNet architecture were obtained with the parameter values in Table 3.
As a result of 750 experiments, the parameter values that yielded the best results were discussed. The parameter values used in all experiments were initially considered in terms of standard deviation and mean, taking into account the Accuracy metric. In this way, we examined how much the results differed from the mean. Standard deviation was used to show how homogeneous the results were for each parameter.
Table 1. Parameter values used in the experiments
|
Parameters |
Number of Variable Values |
Variables |
||||
|
Optimizer (O) |
3 |
sgdm |
rmsprop |
adam |
|
|
|
Mini Batch Size (MBS) |
5 |
8 |
16 |
32 |
64 |
128 |
|
Max Epoch (ME) |
5 |
10 |
25 |
50 |
100 |
150 |
|
Learning Rate (LR) |
5 |
10e-2 |
10e-3 |
10e-4 |
10e-5 |
10e-6 |
|
LearnRateSchedule (LRS) |
2 |
none |
piecewise |
|
|
|
Table 2. Evaluation metrics
|
Accuracy |
$A C C=\frac{T P+T N}{T P+T N+F P+F N}$ |
The rate of the accurate estimations to the total number of estimations |
|
Sensitivity (recall) |
$T P R=\frac{T P}{T P+F N}$ |
True Positive Rate: The ratio of TP results to the total number of true positive samples |
|
Specificity |
$T N R=\frac{T N}{F P+T N}$ |
True Negative Rate: Ratio of TN results to the total actual number of negative samples |
|
Precision |
$P P V=\frac{T P}{T P+F P}$ |
Positive Predictive Value: Proportion of positive samples correctly estimated from all samples estimated to be positive |
|
Dice Similarity (F1 Score) |
Dice $=\frac{2 * T P}{2 * T P+F P+F N}$ |
The harmonic mean of precision and sensitivity |
Table 3. Parameters through which optimum results are obtained and evaluation metric
|
Parameter Values that find the best values |
Metric Values Obtained |
|
(O) = Sgdm (MBS) = 16 (ME) = 150 (LR) = 10e-4 (LRS) = none |
Accuracy: 95.48 Sensitivity: 95.09 Specificity: 97.35 Precision: 95.00 F-Score: 95.09 |
The mean accuracy and standard deviation obtained for the different LR values used in the experiments are presented in Table 4.
According to the results in Table 4, when the mean values and standard deviations in the Accuracy metric are evaluated together in terms of LR parameter, the mean accuracy for the value 10e-2, which had the lowest standard deviation, was lower compared to the others. Apart from this, the LR value with the lowest standard deviation was found to be 10e-4. The mean Accuracy metric in this value is seen as the highest value with 80.64%. If the mean Accuracy and standard deviation values in Table 4 are taken together, it can be said that the most optimum results are achieved when the LR parameter is 10e-4.
Table 4. Mean Acc and StdDev according to LR values
|
LR |
Acc Mean |
StdDev |
|
10e-2 |
57.17 |
2.228 |
|
10e-3 |
68.17 |
10.24 |
|
10e-4 |
80.64 |
5.125 |
|
10e-5 |
77.78 |
7.016 |
|
10e-6 |
63.47 |
8.142 |
The mean accuracy and standard deviation values obtained by the LRS, MBS, and ME parameters used in the experiments (see Table 2), are given in Tables 5, 6, and 7, respectively.
Table 5. Mean Acc and StdDev according to LRS values
|
LRS |
Acc Mean |
StdDev |
|
none |
69.75 |
11.413 |
|
piecewise |
69.16 |
11.150 |
Table 6. Mean Acc and StdDev according to MBS values
|
MBS |
Acc Mean |
StdDev |
|
8 |
69.72 |
12.175 |
|
16 |
69.77 |
12.513 |
|
32 |
70.39 |
9.842 |
|
64 |
67.33 |
9.239 |
|
128 |
70.06 |
12.000 |
Table 7. Mean Acc and StdDev according to ME values
|
ME |
Acc Mean |
StdDev |
|
10 |
66.42 |
10.811 |
|
25 |
68.50 |
11.247 |
|
50 |
70.33 |
11.135 |
|
100 |
70.33 |
11.145 |
|
150 |
71.69 |
11.343 |
When the mean accuracy and std. dev. values are examined in terms of the LRS parameter in Table 5, there is no significant difference in none and piecewise values. When evaluated in terms of the MBS parameter in Table 6, it is seen that while MBS is 32, the mean Accuracy value is 70.39%. However, there is no significant difference compared to other mean Accuracy values. Similarly, std. When the mean Accuracy and std. dev. values are examined in terms of the LRS parameter in Table 5, there is no significant difference in none and piecewise values. When evaluated in terms of the MBS parameter in Table 6, it is seen that while MBS is 32, the mean Accuracy value is 70.39%. However, there is no significant difference compared to other mean Accuracy values. Similarly, std. dev. values were found to be partially lower when MBS was 32 and 64. When evaluated in terms of the ME parameter in Table 7, it is seen that while ME is 150, mean Accuracy is in the first place with 71.69%. However, no significant difference was observed between the std. dev. values. Based on the mean Accuracy and std. dev values are given in LRS, MBS, and ME parameters in Tables 5, 6, and 7; no definite conclusion can be reached for these parameters.
When the accuracy metric in parameter optimization experiments was considered, only determination was made in terms of the LR parameter. The parameters used during the training were also evaluated in terms of other evaluation metrics given in Table 1. As in the Accuracy metric, the mean values, and std. dev. of the metrics were found and interpreted. First, for LR values, the mean values and standard deviations of Sensitivity, Specificity, Precision, and F-Score metrics are given in Table 8.
When the results of the four metrics in Table 8 were evaluated together, the mean values of each metric and the mean best results in all metrics were obtained when the LR value was 10e-4. When evaluated according to standard deviations, the lowest values in all metrics were found to be 10e-2. However, while LR is 10e-2, the mean metric values obtained are quite low compared to the others. Therefore, it can be concluded that optimum results can be obtained when LR is 10e-4 in all metrics, as in the case of mean Accuracy.
The mean values and standard deviations of the Sensitivity, Specificity, Precision, and F-Score metrics for LRS values are given in Table 9.
When the LRS results in Table 9 are evaluated, we observed that there is no significant difference in the mean values and standard deviations of none and piecewise parameters in each metric.
The mean values and standard deviations of the Sensitivity, Specificity, Precision, and F-Score metrics for MBS values are given in Table 10.
When the MBS results in Table 10 are evaluated, there is no discriminative difference in the mean values and standard deviations of the parameters 8, 16, 32, 64, and 128 in each metric. In all of the evaluation metrics, partially better mean metric values and standard deviation value were obtained in the MBS 32 parameter compared to the others.
The mean values and standard deviations of the Sensitivity, Specificity, Precision, and F-Score metrics for ME values are given in Table 11.
When the ME results in Table 11 are evaluated, it is seen that there is no significant difference in the mean values and standard deviations of the parameters 10, 25, 50, 100, and 150 in each metric. In all of the evaluation metrics, partially better mean metric values and standard deviation value were obtained in the ME 150 parameter compared to the others.
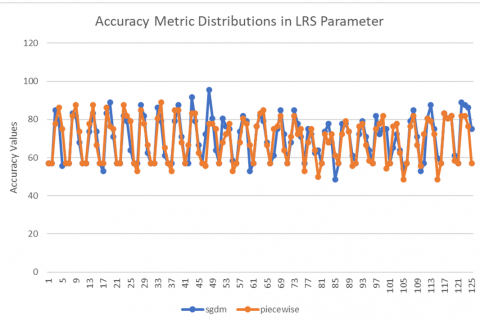
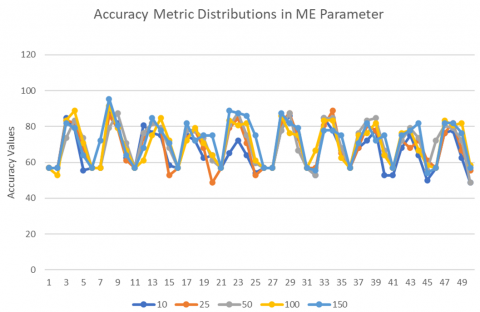
Finally, the distributions of the results obtained in the experiments for LR, LRS, MBS, and ME parameters are shown in Figures 2, 3, 4, and 5, respectively. When Figures 2, 3, 4, and 5 are examined, the metrics that find the best parameter values given in Table 3 can be seen. It can be easily seen that the best Accuracy values are obtained when the LR parameter in Figure 2 is 10e-4 (red line), when the LRS parameter in Figure 3 is sgdm (blue line), when the MBS parameter in Figure 4 is 16 (orange line) and when the ME parameter in Figure 5 is 150 (blue line).
When the tests results were examined in terms of LR parameter value, which shows the amount of update during training in deep learning architecture, 10e-4 was determined as the value at which the best mean values and distributions were the closest to each other in all test scenarios. The mean values were lower in all other LR values, and the differences in the distributions (Standard Deviation) were higher. When considered in terms of the optimizer algorithm, standard deviations and mean values of sgdm, rmsprop, and adam algorithms could not be interpreted as distinguishing parameters since they were very close to each other. Therefore, the results in the sgdm optimizer algorithm, where the best results were obtained, are discussed.
When the results were examined according to the other parameters (MBS, ME, LRS), error rates in standard deviation were high. Therefore, no definite conclusion could be reached when all parameters values except for LR were grouped together. It is thought that the initial weight values of AlexNet architecture are important in finding these parameter values.
Table 8. Mean values and standard deviations of LR for other metrics
|
|
Sensitivity |
Specificity |
Precision |
F-Score |
||||
|
LR |
Mean |
StdDev |
Mean |
StdDev |
Mean |
StdDev |
Mean |
StdDev |
|
10e-2 |
33.84 |
3.549 |
66.91 |
1.669 |
35.29 |
0.875 |
18.32 |
6.519 |
|
10e-3 |
51.71 |
16.154 |
75.65 |
7.918 |
63.53 |
23.427 |
46.06 |
22.75 |
|
10e-4 |
71.20 |
7.797 |
85.27 |
3.931 |
82.97 |
9.576 |
71.04 |
7.831 |
|
10e-5 |
66.43 |
10.683 |
83.05 |
5.348 |
79.12 |
11.822 |
66.27 |
11.339 |
|
10e-6 |
44.92 |
12.257 |
72.34 |
6.073 |
58.01 |
16.022 |
44.48 |
12.816 |
Table 9. Mean values and standard deviations of LRS for other metrics
|
|
Sensitivity |
Specificity |
Precision |
F-Score |
||||
|
LRS |
Mean |
StdDev |
Mean |
StdDev |
Mean |
StdDev |
Mean |
StdDev |
|
none |
54.01 |
17.718 |
76.88 |
8.726 |
64.56 |
22.649 |
49.51 |
23.384 |
|
piecewise |
53.22 |
17.399 |
76.40 |
8.617 |
63.01 |
21.916 |
48.95 |
22.809 |
Table 10. Mean values and standard deviations of MBS for other metrics
|
|
Sensitivity |
Specificity |
Precision |
F-Score |
||||
|
MBS |
Mean |
StdDev |
Mean |
StdDev |
Mean |
StdDev |
Mean |
StdDev |
|
8 |
53.89 |
19.050 |
76.78 |
9.422 |
63.66 |
24.784 |
47.54 |
26.253 |
|
16 |
53.78 |
19.570 |
76.78 |
9.669 |
61.91 |
22.898 |
48.36 |
25.741 |
|
32 |
55.12 |
15.241 |
77.40 |
7.562 |
66.62 |
19.136 |
51.70 |
20.319 |
|
64 |
50.60 |
14.347 |
75.12 |
7.021 |
62.26 |
20.786 |
47.07 |
18.967 |
|
128 |
54.70 |
18.595 |
77.12 |
9.187 |
64.46 |
23.134 |
51.47 |
22.894 |
Table 11. Mean values and standard deviations of ME for other metrics
|
|
Sensitivity |
Specificity |
Precision |
F-Score |
||||
|
ME |
Mean |
StdDev |
Mean |
StdDev |
Mean |
StdDev |
Mean |
StdDev |
|
10 |
49.04 |
16.626 |
74.39 |
8.267 |
60.75 |
22.562 |
43.84 |
21.750 |
|
25 |
52.12 |
17.538 |
75.92 |
8.635 |
60.58 |
21.213 |
47.40 |
22.919 |
|
50 |
54.90 |
17.430 |
77.280 |
8.615 |
64.99 |
23.008 |
51.03 |
23.143 |
|
100 |
55.05 |
17.449 |
77.364 |
8.572 |
65.02 |
22.504 |
50.75 |
23.207 |
|
150 |
56.96 |
17.664 |
78.253 |
8.752 |
67.57 |
21.324 |
53.12 |
23.291 |
Figure 2. LR parameter distributions in the experiments
Figure 3. LRS parameter distributions in the experiments
Figure 4. MBS parameter distributions in the experiments
Figure 5. ME parameter distributions in the experiments
A number of studies address the effect of deep learning architectures used in the classification of images related to a particular problem. In this paper, the extent to which the parameters used in the training of AlexNet architecture used in the classification of medical wound images affect the success was investigated. By interpreting the classification success of AlexNet architecture with evaluation metrics, this study examined how the optimizer algorithm, LR, LRS, MBS, and ME parameters were used to affect the result of classification success with different values.
In the experiments, the performance of AlexNet architecture on the original wound images data set was examined. In this paper, sgdm, rmsprob and adam optimizer methods were used. Mini Batch Size parameter has been chosen as multiples of 2, with a minimum of 8 and a maximum of 128. For Maximum Epoch parameter, trained up to 10,25,50,100 and 150 epoches. 10e-2,10e-3,10e-4,10e-5,10e-6 was used as the Learning Rate value. None and piecewise values are taken as LearningRateSchedule parameter. 750 experiments were conducted to observe which parameter affected the evaluation metrics. In the experiments, the results obtained in the sgdm method, which produces the best results compared to rmsprop and adam optimizer algorithms, which are among the parameters used in the training phase, were discussed. The results obtained with the Sgdm optimizer algorithm were evaluated by grouping LR, LRS, MBS, and ME parameters according to different values. In the interpretations made by calculating the mean values and standard deviations of Accuracy, Sensitivity, Specificity, Precision, and F-Score evaluation metrics, it was determined that significantly better results were found in the LR parameter. According to the results of all parameter optimization experiments, good results were obtained when the LR parameter is at 10e-4. Since there are no significant differences in the results obtained by other parameters, it is thought that similar results are produced due to the initial weight values of the architecture.
In the field of medicine, wound evaluation and follow-up of care processes are a field of study. It is important that wounds are detected with high accuracy with deep learning to contribute to wound care processes. Thanks to this study, appropriate parameter values have been determined for the optimization of the parameters of the AlexNet architecture. The effects of parameter pairs used in the training of the architecture on wound classification were measured and the parameter that increased success most was determined and their effects on datasets were examined. As a result, on our data set, AlexNet architecture yielded the highest accuracy in classification with a rate of 95.48% with the sgdm optimizer algorithm, 16 MBS, 150 ME, and 10e-4 LR parameters. In addition, with all experiments, the study examined how each parameter affects classification success.
Further studies can examine the success rates of different CNN architectures in the classification of wound images. Optimum parameter determination experiments can also be performed using new methods.
This study was supported by the Scientific Research Project at Konya Technical University, Konya, Turkey (No. 231113005).
[1] Gefen, A. (2022). Alternatives and preferences for materials in use for pressure ulcer prevention: An experiment-reinforced literature review. International Wound Journal, 19(7): 1797-1809. https://doi.org/10.1111/iwj.13784
[2] Hultin, L., Gunningberg, L., Coleman, S., Karlsson, A.C. (2022). Pressure ulcer risk assessment—registered nurses experiences of using PURPOSE T: A focus group study. Journal of Clinical Nursing, 31(1-2): 231-239. https://doi.org/10.1111/jocn.15901
[3] Jodheea-Jutton, A., Hindocha, S., Bhaw-Luximon, A. (2022). Health economics of diabetic foot ulcer and recent trends to accelerate treatment. The Foot, 52: 101909. https://doi.org/10.1016/j.foot.2022.101909
[4] Parisod, H., Holopainen, A., Kielo-Viljamaa, E., Puukka, P., Beeckman, D., Haavisto, E. (2022). Attitudes of nursing staff towards pressure ulcer prevention in primary and specialised health care: A correlational cross-sectional study. International Wound Journal, 19(2): 399-410. https://doi.org/10.1111/iwj.13641
[5] Sun, H., Saeedi, P., Karuranga, S., et al. (2022). IDF Diabetes Atlas: Global, regional and country-level diabetes prevalence estimates for 2021 and projections for 2045. Diabetes Research and Clinical Practice, 183: 109119. https://doi.org/10.1016/j.diabres.2021.109119
[6] Sun, Y., Ma, L., Ji, M., Wang, Z. (2022). Evidence map of recommendations on diabetic foot ulcers care: A systematic review of 22 guidelines. Journal of Tissue Viability, 31(2): 294-301. https://doi.org/10.1016/j.jtv.2022.03.001
[7] Alzubaidi, L., Fadhel, M.A., Oleiwi, S.R., Al-Shamma, O., Zhang, J. (2020). DFU_QUTNet: Diabetic foot ulcer classification using novel deep convolutional neural network. Multimedia Tools and Applications, 79(21-22): 15655-15677. https://doi.org/10.1007/s11042-019-07820-w
[8] Das, S.K., Roy, P., Mishra, A.K. (2022). DFU_SPNet: A stacked parallel convolution layers based CNN to improve Diabetic Foot Ulcer classification. ICT Express, 8(2): 271-275. https://doi.org/10.1016/j.icte.2021.08.022
[9] Goyal, M., Reeves, N.D., Davison, A.K., Rajbhandari, S., Spragg, J., Yap, M.H. (2018). Dfunet: Convolutional neural networks for diabetic foot ulcer classification. IEEE Transactions on Emerging Topics in Computational Intelligence, 4(5): 728-739. https://doi.org/10.1109/TETCI.2018.2866254
[10] Goyal, M., Reeves, N.D., Rajbhandari, S., Ahmad, N., Wang, C., Yap, M.H. (2020). Recognition of ischaemia and infection in diabetic foot ulcers: Dataset and techniques. Computers in Biology and Medicine, 117: 103616. https://doi.org/10.1016/j.compbiomed.2020.103616
[11] Rostami, B., Anisuzzaman, D.M., Wang, C., Gopalakrishnan, S., Niezgoda, J., Yu, Z. (2021). Multiclass wound image classification using an ensemble deep CNN-based classifier. Computers in Biology and Medicine, 134: 104536. https://doi.org/10.1016/j.compbiomed.2021.104536
[12] Shenoy, V.N., Foster, E., Aalami, L., Majeed, B., Aalami, O. (2018). Deepwound: Automated postoperative wound assessment and surgical site surveillance through convolutional neural networks. In 2018 IEEE International Conference on Bioinformatics and Biomedicine (BIBM), Madrid, Spain, pp. 1017-1021. https://doi.org/10.1109/BIBM.2018.8621130
[13] Lu, Y., Huo, Y., Yang, Z., Niu, Y., Zhao, M., Bosiakov, S., Li, L. (2022). Influence of the parameters of the convolutional neural network model in predicting the effective compressive modulus of porous structure. https://doi.org/10.3389/fbioe.2022.985688
[14] Nguyen, H.N., Lee, C. (2018). Effects of Hyper-parameters and Dataset on CNN Training. Journal of IKEEE, 22(1): 14-20. https://doi.org/10.7471/ikeee.2018.22.1.14
[15] Nazir, S., Patel, S., Patel, D. (2018). Hyper parameters selection for image classification in convolutional neural networks. In 2018 IEEE 17th International Conference on Cognitive Informatics & Cognitive Computing (ICCI* CC), Berkeley, CA, USA, pp. 401-407. https://doi.org/10.1109/ICCI-CC.2018.8482081
[16] Baydilli, Y., Atila, U. (2018). Understanding effects of hyper-parameters on learning: A comparative analysis. In Proceedings of the International Conference on Advanced Technologies, Computer Engineering and Science, Safranbolu, Turkey, pp. 11-13.
[17] Krizhevsky, A., Sutskever, I., Hinton, G.E. (2012). ImageNet classification with deep convolutional neural networks. Advances in Neural Information Processing Systems, 25.
[18] Zhao, X., Liu, L., Qi, S., Teng, Y., Li, J., Qian, W. (2018). Agile convolutional neural network for pulmonary nodule classification using CT images. International Journal of Computer Assisted Radiology and Surgery, 13: 585-595. https://doi.org/10.1007/s11548-017-1696-0
[19] Alamri, N.M.H., Packianather, M., Bigot, S. (2022). Deep learning: Parameter optimization using proposed novel hybrid bees Bayesian convolutional neural network. Applied Artificial Intelligence, 36(1): 2031815. https://doi.org/10.1080/08839514.2022.2031815
[20] Xu, Y., Wang, Y., Razmjooy, N. (2022). Lung cancer diagnosis in CT images based on Alexnet optimized by modified Bowerbird optimization algorithm. Biomedical Signal Processing and Control, 77: 103791. https://doi.org/10.1016/j.bspc.2022.103791
[21] Haji, S.H., Abdulazeez, A.M. (2021). Comparison of optimization techniques based on gradient descent algorithm: A review. PalArch's Journal of Archaeology of Egypt/Egyptology, 18(4): 2715-2743.
[22] Im, D.J., Tao, M., Branson, K. (2016). An empirical analysis of the optimization of deep network loss surfaces. arXiv preprint arXiv:1612.04010. https://doi.org/10.48550/arXiv.1612.04010
[23] Masters, D., Luschi, C. (2018). Revisiting small batch training for deep neural networks. arXiv preprint arXiv:1804.07612. https://doi.org/10.48550/arXiv.1804.07612
[24] Fawcett, T. (2006). An introduction to ROC analysis. Pattern Recognition Letters, 27(8): 861-874. https://doi.org/10.1016/j.patrec.2005.10.010
[25] Uyar, K., Taşdemir, Ş., Ülker, E., Öztürk, M., Kasap, H. (2021). Multi-class brain normality and abnormality diagnosis using modified Faster R-CNN. International Journal of Medical Informatics, 155: 104576. https://doi.org/10.1016/j.ijmedinf.2021.104576