Yanjun Wang![]()
© 2023 IIETA. This article is published by IIETA and is licensed under the CC BY 4.0 license (http://creativecommons.org/licenses/by/4.0/).
OPEN ACCESS
In order to ensure the safe, stable, and efficient operation of electrical control equipment, the patrol inspection and maintenance are especially important. Research on electrical control equipment patrol inspection method based on high quality image recognition technology is of great significance, because the method replaces traditional manual patrol inspection to some extent and reduces labor costs. The existing methods based on low-illumination image recognition technology meet the patrol inspection requirements in low-illumination environment to a certain extent, but they still have certain limitations. Therefore, this research aimed to study the electrical control equipment patrol inspection method based on high quality image recognition technology. Electrical control equipment patrol inspection images were enhanced based on Deep Curve Estimation Network (DCEN) in order to improve the visibility of equipment anomaly features, which helped reduce the misjudgment and misdetection risks during the patrol inspection process. The patrol inspection image set was reconstructed in super resolution, and was combined with clear images to construct a new image set, which improved the patrol inspection efficiency. The electrical control equipment detection process based on YOLO V3 was elaborated. The experimental results verified that the proposed method and constructed model in this study were effective.
high quality image processing, electrical control equipment, equipment patrol inspection, image enhancement, image reconstruction
With the rapid development of modern industry, electrical control equipment plays an increasingly important role in various fields [1-3]. However, it may malfunction after long-time operation, leading to decreased equipment performance or even shutdown [4-9]. In order to ensure the safe, stable, and efficient operation of electrical control equipment, the patrol inspection and maintenance are particularly important [10-15]. In real life, many electrical equipment often operate in low-illumination environment, which makes the patrol inspection difficult [16-18]. Traditional manual patrol inspection method is prone to misjudgment and misdetection in low-illumination environment, while the method based on high quality image recognition technology effectively improves patrol inspection efficiency. At the same time, certain safety hazards exist in low-illumination patrol inspection, especially in situations with hazardous factors, such as electric arcs and sparks. Therefore, it is of great significance to study the electrical control equipment patrol inspection method based on high quality image recognition technology, which to some extent replaces traditional manual patrol inspection and reduces labor costs.
Video surveillance was introduced into remote monitoring of power equipment operation status a long time ago. Wan et al. [19] proposed that both "remote viewing" and image monitoring of production environment using robots lacked information processing functions, making it difficult to intelligently and proactively identify and analyze the monitored targets. Operators needed to observe and analyze images at any time, which actually increased the burden of dispatchers. Edge service, including electrical equipment intelligent detection in power Internet of Things (IoT), usually used deep neural network (DNN) to accurately identify abnormal devices through image classification and target detection, thus reducing workload on the power cloud. However, due to the limited computing power and storage space of edge devices, the high computational complexity based on neural network model brought great challenges to edge service and application in the real world. Shang et al. [20] proposed an intelligent electrical equipment detection framework based on DNN model compression. Instead of manually setting the compression rate of each layer using any hyperparameter, combined methods were used to automatically prune and quantify DNN in edge service, which processed and analyzed real-time massive data acquired by multiple power equipment, thus reducing the computational complexity and workload of edge computing service. Li and Zhang [21] obtained an intelligent customized operation model for the detection process by introducing automatic planning algorithm. The model was described as Planning Domain Definition Language (PDDL), which provided intelligent decision-making assistance for daily work. Chen et al. [22] proposed an efficient registration method based on quadrilateral features of electrical equipment. The quadrilateral structure information of the monitored target was reconstructed from the original image using contour and line detection techniques. The experimental results showed that the proposed registration method quickly and accurately aligned visible light and infrared images, which was less likely to be affected by image quality or other unrelated targets.
The existing electrical control equipment patrol inspection methods based on low-illumination image recognition technology mainly include several methods, such as the method based on multi-frame fusion, deep learning-based method, and infrared imaging-based method. However, the multi-frame fusion method requires processing a large amount of data and the high computational complexity may affect the real-time patrol inspection. Infrared imaging equipment has high costs and low resolution, which may not meet the needs of high-precision patrol inspection. Therefore, the existing methods meet the patrol inspection requirements in low-illumination environment to a certain extent, but they still have certain limitations, such as unstable image quality. Therefore, this research studied the patrol inspection method based on high quality image recognition technology. Electrical control equipment patrol inspection images were enhanced based on DCEN in order to improve the visibility of equipment abnormal features in Chapter 2, which helped reduce the misjudgment and misdetection risks during the patrol inspection process. The patrol inspection image set was reconstructed in super resolution, and was combined with clear images to construct a new image set in Chapter 3, which improved the patrol inspection efficiency. The electrical control equipment detection process based on YOLO V3 was elaborated in Chapter 4. Finally, the experimental results verified that the method and model in this study were effective.
During the patrol inspection process, the original electrical control equipment images in low-illumination environment, such as computer rooms, distribution rooms, and tunnels, are likely to have some problems, such as loss of dark details, low contrast, and poor visual effects. Moreover, it may be difficult to accurately identify the equipment fault symptoms in low-illumination environment, such as temperature anomaly, local arcs, and insulation damage. Image enhancement effectively improves image quality, and enhances the brightness, contrast and color balance of images, which make the images more in line with the needs of human eye observation and computer processing. At the same time, the visibility of equipment anomaly features can be improved, which helps reduce the misjudgment and misdetection risks during the patrol inspection process.
In practical application scenarios of patrol inspection, DCEN has some irreplaceable advantages compared with Retinex-Net used for low-illumination image enhancement. As an end-to-end deep learning method, DCEN directly learns the mapping relationships between the output images from the input images, without additional preprocessing or post-processing steps. In contrast, Retinex-Net uses Retinex theory for image decomposition, which may require some preprocessing and post-processing steps, increasing implementation complexity. DCEN has strong adaptability by automatically learning the local curve adjustment strategies of images, thus achieving good enhancement effects in different low-illumination environments. However, possibly limited by the Retinex theory, the performance of Retinex-Net in different scenarios may depend more on parameter adjustment.
DCEN aimed to estimate the best fit light enhancement curves in order to enhance low-illumination images. When estimating the light enhancement curves, DCEN needed to meet several requirements, such as maintaining the naturalness of images, enhancing the visibility of details, reducing noises and artifacts, as well as maintaining the color characteristics, real-time performance and computational efficiency of original images. By meeting the above requirements, the DCEN effectively enhanced low-illumination images and provided high quality image data for electrical control equipment patrol inspection tasks. Figure 1 shows the workflow diagram of DCEN.
Figure 1. Workflow diagram of DCEN
Let b be the number of iterations, Sb be the b-th iteration parameter, and ZQb be the enhanced image obtained after the b-th iteration. To meet the goal of the best fit light enhancement curves, the following formula provided the quadratic curve expression used in DCEN:
$Z Q_b(z)=Z Q_{b-1}(z)+S_b Z Q_{b-1}(z)\left(1-Z Q_{b-1}(z)\right)$ (1)
The loss function of DCEN consisted of four parts, namely, loss of spatial consistency, exposure control, color constancy, and illuminance smoothness. Let QCO and QTVS be the loss weights, then the loss function was expressed as follows:
${{M}_{TO}}={{M}_{SP}}+{{M}_{EX}}+{{Q}_{CO}}{{M}_{CO}}+{{Q}_{T{{V}_{S}}}}{{M}_{T{{V}_{S}}}}$ (2)
MSP setting aimed to promote the spatial coherence of the enhanced image, mainly by preserving the difference of adjacent regions between the input patrol inspection image and the enhanced image. Let J be the number of local regions, Ψ(u) be the above, below, left and right four adjacent regions centered around region u, T be the average value of local regions in the enhanced image, and U be the average value of local regions in the input image, then:
${{M}_{SP}}=\frac{1}{J}{{\sum\limits_{u=1}^{J}{\sum\limits_{k\in \Psi \left( u \right)}{\left( |\left( {{T}_{u}}-{{T}_{k}} \right)|-|\left( {{U}_{u}}-{{U}_{k}} \right)| \right)}}}^{2}}$ (3)
MEX setting aimed to limit underexposed or overexposed image regions, mainly by calculating the distance between the average intensity value of local regions of the patrol inspection image and the exposure level R. Let L be the number of non-overlapping local regions, and T be the average intensity value of local regions in the enhanced image, then:
${{M}_{EX}}=\frac{1}{L}\sum\limits_{j=1}^{L}{|{{T}_{j}}-R|}$ (4)
Let Ko be the average intensity value of P channel in the enhanced image, and (w,o) be a pair of channels. By following the Gray-World assumption of color constancy, the expression of color constancy loss MCO was given as follows:
${{M}_{CO}}={{\sum\nolimits_{\forall \left( o,w \right)\in \gamma }{\left( {{K}^{o}}-{{K}^{w}} \right)}}^{2}},\text{ }\gamma =\left\{ \left( E,H \right),\left( E,N \right),\left( H,N \right) \right\}$ (5)
MTVS setting aimed to maintain the monotonic relationships between adjacent pixels in the image. Let $\nabla_z$ and $\nabla_t$ be finding the gradients along the x and y directions, respectively, and B be the number of parameter diagrams, then:
${{M}_{T{{V}_{S}}}}=\frac{1}{B}\sum\limits_{b=1}^{B}{\sum\limits_{v\in \varsigma }{\left( |{{\nabla }_{z}}S_{b}^{v}+{{\nabla }_{t}}S_{b}^{v}{{|}^{2}} \right)}},\varsigma =\left\{ E,H,N \right\}$ (6)
DCEN adjusted the brightness, contrast and color balance of the input low-illuminance image, which made the dark details more visible, thus outputting an enhanced image. By learning the local light enhancement curves adaptively, the network not only made the output image maintain the overall brightness and color balance, but also better enhanced the local details and improved the image contrast. The DCEN adopted in this study used multi-layer convolutional neural network as the basic framework, and realized the feature extraction and representation of the input image through convolution layer, activation function, pooling layer and other components. In terms of structural design, multi-scale feature extraction was taken into consideration, and multi-scale representation of image features was achieved through different sizes of convolutional kernels and pooling layers, which improved the accuracy of light enhancement curve estimation.
During the patrol inspection process of electrical control equipment, low-resolution blurred images may result in the difficulty in accurately identifying equipment anomalies. Meanwhile, due to the limitations of factors, such as costs and installation space, it may not be possible to use high-resolution camera equipment for patrol inspection. In this case, super-resolution reconstruction of low-resolution blurred images provides higher quality image data, which compensates for the limitations of the device. Moreover, after the super-resolution reconstruction, the blurred image set is combined with clear images to construct a new patrol inspection image set, which improves the patrol inspection efficiency, because high quality image data reduces the misidentification and misdetection risks, which reduces the time spent by patrol inspectors in reviewing and handling misinformation.
Super-Resolution Convolutional Neural Network (SRCNN) is a super-resolution reconstruction method based on deep convolutional neural network, which learns the features of high-resolution images from low-resolution images, thus achieving super-resolution reconstruction of images. SRCNN consists of three convolutional layers, which are used for image feature extraction, nonlinear mapping, and high-resolution image reconstruction. Rectified Linear Unit (ReLU) is used as the activation function, which effectively improves the nonlinear expression ability of the network. An end-to-end training strategy directly learns the mapping relationships between low- and high-resolution images, which improves training and inference efficiency. Figure 2 shows the network structure of SRCNN.
Figure 2. Network structure of SRCNN
Figure 3. Flowchart of super-resolution reconstruction of low-resolution images
Low-resolution electrical control equipment patrol inspection images were reconstructed in super resolution based on SRCNN. The original images were first divided into two categories: one was a qualified clear image set used as a train set, and the other was a low-resolution blurred image set used as pending images. The blurred images were preprocessed, including image scaling, normalization and other operations, in order to make them suitable for SRCNN network input. The SRCNN model was trained using a clear image set and corresponding low-resolution image pairs in order to learn the mapping relationships between low- and high-resolution images. The trained model was applied to the pending low-resolution blurred images, thus achieving super-resolution image reconstruction. Then the reconstructed images were post-processed, such as adjusting brightness, contrast and other parameters, in order to better meet patrol inspection requirements. Finally, the processed high-resolution images were combined with the clear image set in order to construct a new image set, which was used for subsequent electrical control equipment patrol inspection tasks. Low-resolution images were effectively processed through the above steps, which improved the image quality. Figure 3 shows the super-resolution reconstruction flowchart of low-resolution images.
In order to obtain the mapping function D(T) between high-resolution images, network parameters, such as ϕ={Q1,Q2,Q3,n1,n2,n3}, needed to be learned when training the super-resolution reconstruction network. Let Z be the original image, and D(T;ϕ) be the reconstructed image, that is, the parameters ϕ were learned using the error between D(T;ϕ) and Z. The mean square error (MSE) was selected as the loss function in the model. Let b be the number of training samples, Zu be the original high-resolution patrol inspection image, and Tu be the input low-resolution image, then the expression of loss function was as follows:
$M(\varphi)=\frac{1}{b} \sum_{u=1}^b\left\|D\left(T_u ; \varphi\right)-Z_u\right\|^2$ (7)
When the corresponding MSE between D(Tu;ϕ) and Zu was the smallest, and the peak signal-to-noise ratio was the highest, making it easier to obtain the optimal parameters. In order to obtain a small MSE, the weight Q and the bias n were optimized based on the Adam optimization algorithm. Let io(T)=T$\otimes$1b×b be the upsampling operation realized by Kronecker product, σmk be the k-th feature map of the m-th layer, αm+1k be the trainable parameters, and $\circ$ be the multiplication of each element, then the calculation formula of residual σ was as follows:
$\sigma _{k}^{m}=\alpha _{k}^{m+1}\left[ M{A}'\left( 0,T_{k}^{m} \right)\circ {{i}_{o}}\left( \sigma _{k}^{m+1} \right) \right]$ (8)
Since the result of multiplying zm-1u with each weight during convolution was om-1u, let λ be the learning rate, then the parameters were updated using the following formulas based on the chain rule:
$\frac{\beta M}{\beta Q_{uk}^{m}}=\sum\limits_{i,t}{{{\left( \sigma _{k}^{m} \right)}_{i,c}}{{\left( o_{k}^{m-1} \right)}_{i,c}}},\frac{\beta M}{\beta {{n}_{k}}}=\sum\limits_{i,c}{{{\left( \sigma _{k}^{m} \right)}_{i,c}}}$ (9)
${{Q}_{k}}={{Q}_{k}}-\lambda \frac{\beta M}{\beta Q_{uk}^{m}},{{n}_{k}}={{n}_{k}}-\lambda \frac{\beta M}{\beta {{n}_{k}}}$ (10)
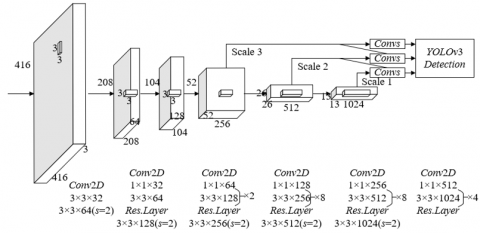
Due to the fast detection speed, YOLO V3 achieves real-time target detection, and is suitable for real-time patrol inspection scenarios for efficiency improvement. In addition, it has high detection accuracy, which helps accurately detect abnormal equipment components. YOLO V3 makes predictions at multiple scales through the Feature Pyramid Network (FPN), thus detecting targets in images of different scales. Based on the above advantages, YOLO V3 was selected in this study for electrical control equipment detection. Figure 4 shows the network structure of YOLO V3.
Prediction results of YOLO V3 included bounding box parameters, target score parameters, and category prediction parameters. The position, size, category and other information of the target object was obtained based on these parameters. The detection steps were as follows:
1. Data preprocessing: the new patrol inspection image set was preprocessed, and the images were adjusted to 416×416 resolution to meet the network input requirements.
2. Feature extraction: the preprocessed images were input into the Darknet-53 network to extract image features.
3. Target detection: the feature output was delivered to FPN for target detection prediction at three different scales.
4. Result filtering: the bounding boxes, whose Intersection overUnion (IoU) with ground truth exceeded the selected threshold, were filtered based on the predicted results.
5. Detection result output: the classification and corresponding positioning of each filtered bounding box were output to obtain the detection results of electrical control equipment patrol inspection.
Figure 4. Network structure of YOLO V3
Figure 5. Electrical control equipment detection flowchart
Figure 5 shows the detection flowchart of electrical control equipment. Let yz, yt, yq and yg be the four coordinate values of differences in abscissa, ordinate, box width and height between center points of the predicted box and the anchor box in YOLO V3 network prediction. It’s assumed that the deviation between the upper left corners of the grid and the image was (vz,vt) grids, and the values of yz and yt were normalized to [0,1]. Let δ(·) be the sigmoid function, oq and og be the width and height of the prior bounding box, then the four coordinate values of the final prediction box were nz, nt, nq and ng obtained through calculation. The calculation formulas were as follows:
${{n}_{z}}=\delta \left( {{y}_{z}} \right)+{{v}_{z}},\text{ }{{n}_{t}}=\delta \left( {{y}_{t}} \right)+{{v}_{t}}$
${{n}_{q}}={{o}_{q}}{{r}^{{{y}_{q}}}},\text{ }{{n}_{g}}={{o}_{g}}{{r}^{{{y}_{g}}}}$ (11)
The YOLO V3 network training for electrical control equipment detection had the following seven steps:
(1). Data preparation: a large amount of equipment image data was collected, including images of normal and abnormal equipment. The original patrol inspection image set was preprocessed, including low-illumination image enhancement and super-resolution reconstruction. The processed images were combined with a clear image set to construct a new patrol inspection image set.
(2). Data labeling: the new image set was labeled. For the equipment components in each image, the bounding boxes were drawn and category labels were assigned to them. The labeled data set was divided into train set, validation set, and test set.
(3). Data preprocessing: images in the train, validation and test sets were preprocessed, including 416×416 resolution adjustment and normalization, in order to adapt to the input requirements of the YOLO V3 network. The label data was converted into a format, which was understood by the network.
(4). Model configuration: YOLO V3 network was selected as the basic model, and the network output layer was adjusted based on the category number of electrical control equipment detection tasks. Model hyperparameters were configurated, such as loss function, optimizer, learning rate and so on.
(5). Model training: the preprocessed train set data was input into the YOLO V3 network for training. In the training process, model performance was regularly evaluated using the validation set data. In addition, hyperparameters were adjusted using monitoring indexes, such as mean average precision (mAP) and IoU, to optimize the model performance. The model was trained until it converged or met the preset performance indexes.
(6). Model evaluation and tuning: the trained YOLOV3 model was evaluated using test set data, and its performance in equipment detection tasks was analyzed. According to the evaluation results, the model was further optimized, such as network structure modification and hyperparameter adjustment.
(7). Model deployment: the trained YOLOV3 model was applied to actual electrical control equipment patrol inspection scenarios for detecting and locating abnormal equipment components in real time.
Figure 6. Electrical control equipment detection model
Figure 6 shows the detection model of electrical control equipment. Let $a_b \in[0,1]$ be the target scores of network prediction, and $h_b \in\{0,1\}$ be whether the b-th sample belongs to the target category, then the expression of loss function used in YOLO V3 parameter training was given as follows:
$M\left( {{a}_{b}} \right)=\left\{ \begin{align} & -LO\left( {{a}_{b}} \right);{{h}_{b}}=1 \\ & -LO\left( 1-{{a}_{b}} \right);{{h}_{b}}=0 \\ \end{align} \right.$ (12)
YOLO V3 network parameters were trained by minimizing ∑M(Ab), the loss of all samples.
Batch Group Normalization (BGN) combines Batch Normalization (BN) with Group Normalization (GN), which has better performance by combining advantages of the two methods. In practical application scenarios of electrical control equipment patrol inspection, the mean value and variance on each channel are calculated and normalized in order for BGN-based batch processing of the constructed YOLOV3 network, which reduces internal covariate deviation, thus improving the training process stability and helping train the network to converge to a good solution more rapidly. Compared with BN, the BGN relies less on batch size, indicating that BGN still has good performance even in small batch size. This is particularly useful in patrol inspection scenarios, because these scenarios may not be able to train with large batch size, such as hardware limitations or small amount of data.
Let $h \in[1, H]$, B be the batch size, H be the hyperparameter dividing the number of new dimension arrays, and A=L/H be the number of instances in each divided feature group. The formulas of calculating mean value ωh and variance σh along the batch and the new dimension were provided as follows:
${{\omega }_{h}}=\frac{1}{B\times A}\sum\limits_{b=1}^{B}{\sum\limits_{f=\left( h-1 \right)\cdot A+1}^{h\cdot A}{{{d}_{b.f}}}}$ (13)
$\sigma _{h}^{2}=\frac{1}{B\times A}\sum\limits_{b=1}^{B}{\sum\limits_{f=\left( h-1 \right)\cdot A+1}^{h\cdot A}{{{\left( {{d}_{b.f}}-{{\omega }_{h}} \right)}^{2}}}}$ (14)
The Adam optimization algorithm assigned independent learning rate to each parameter, and the learning rate was automatically adjusted based on first and second moment estimations. This meant that the network adaptively adjusted the learning rate for different parameters during the training process, thus better adapting to various complex scenarios in patrol inspection tasks. Meanwhile, the Adam algorithm estimated the first and second moments of the gradient using the exponential weighted moving average technology, which enabled the gradient to converge faster during the training process. This led to high performance of the YOLO V3 network in a short period of time, thus more effectively responding to the actual patrol inspection needs. The Adam optimization algorithm had strong robustness for parameter updating and overcame several problems during the training process, such as gradient sparsity and noises, which was particularly important in patrol inspection tasks, because the data in these tasks may contain noises or other irregular features. The YOLO V3 network better adapted to these problems using the Adam optimization algorithm, thus improving the accuracy and robustness of detection.
The mathematical expressions of the Adam optimization algorithm were provided as follows:
$\left\{ \begin{align} & {{\left( {{l}_{u}} \right)}_{u}}={{\alpha }_{1}}{{\left( {{l}_{u-1}} \right)}_{u}}+\left( 1-{{\alpha }_{1}} \right){{\left( \frac{\beta K}{\beta {{Q}_{u}}} \right)}_{u}} \\ & {{\left( {{c}_{y}} \right)}_{u}}={{\alpha }_{2}}{{\left( {{c}_{y-1}} \right)}_{u}}+\left( 1-{{\alpha }_{2}} \right)\left( \frac{\beta K}{\beta {{Q}_{y}}} \right)_{u}^{2} \\ & {{\left( {{Q}_{y+1}} \right)}_{u}}={{\left( {{Q}_{y}} \right)}_{u}}-\beta \frac{\sqrt{1-\left( {{\alpha }_{2}} \right)_{u}^{y}}}{1-\left( {{\alpha }_{2}} \right)_{u}^{y}}\frac{{{\left( {{l}_{y}} \right)}_{u}}}{\sqrt{{{\left( {{c}_{y}} \right)}_{u}}+\gamma }} \\ \end{align} \right.$ (15)
where, the default settings are α1=0.9, α1=0.999, and γ=10-8.
Figure 7 shows the loss variation curve graphs of Retinex-Net and DCEN enhanced network. According to the loss variation curves, it can be observed that the DCEN enhanced network loss converges at 1.5×10⁻², while the Retinex-Net loss converges at around 0.12, indicating that the DCEN enhanced network has superior performance compared with Retinex-Net because it has lower loss and faster convergence during the training process. Based on previous analysis, it was understood that DCEN had the ability to adaptively learn the optimal light enhancement curves, thus better processing low-illumination patrol inspection images. In contrast, Retinex-Net decomposed images based on a fixed model, which may not achieve the desired enhancement effects in all cases. Therefore, DCEN was more effective in enhancing low-illumination patrol inspection images, thus providing clearer and more accurate images in patrol inspection tasks, thus helping improve the effectiveness and accuracy.
(1)
(2)
Figure 7. Loss variation curve graphs of Retinex-Net and DCEN enhanced network
Table 1. Model performance comparison before and after enhancement and reconstruction processing
|
Training model |
AP (%) |
Training time (hour) |
FPS (frames/second) |
|
Before enhancement processing |
72.8 |
2.1 |
25 |
|
After enhancement processing |
70.6 |
2.6 |
22 |
|
Before reconstruction |
85.9 |
5 |
9 |
|
After reconstruction |
80.5 |
8 |
1 |
|
Enhancement + reconstruction |
88.2 |
9 |
4 |
Table 1 presents the model performance comparison results before and after enhancement and reconstruction processing. According to the above table, the average accuracy (AP) is 72.8% and 70.6% before and after enhancement processing, which has slightly decreased. The training time is 2.1 and 2.6 hours before and after enhancement treatment, which has slightly increased. Frame Per Second (FPS) is 25 and 22 before and after enhancement, which has slightly decreased. AP is 85.9% and 80.5% before and after reconstruction, which has decreased. The training time is 5 and 8 hours before and after reconstruction, which has significantly increased after reconstruction. FPS is 9 and 1 before and after reconstruction, which has significantly decreased. AP is 88.2% in "enhancement+reconstruction" situation, with better performance than other situations. The training time is 9 hours in "enhancement+reconstruction" situation, which is the longest. FPS is 4 in "enhancement+reconstruction" situation, which is relatively low. It can be seen that the enhanced model slightly decreases in AP, but maintains high training time and FPS. Although the reconstructed model decreases in AP, it significantly decreases in the training time and FPS. Overall, the impact of enhancement processing on model performance was slightly small in the "enhancement+reconstruction" processing. However, AP reached the highest value (88.2%) in the "enhancement+reconstruction" processing, though the training time was the longest and the FPS was lower. Therefore, model performance and real-time performance needed to be balanced in practical applications. If the goal was to achieve the highest detection accuracy, the "enhancement+reconstruction" processing needed to be chosen.
Figure 8. Comparison of P-R curves before and after BGN and BN processing
Figure 8 shows the comparison of P-R curves before and after BGN and BN processing. In the figure, the horizontal axis represents recall and the vertical axis represents precision. By comparing the P-R curve data of BGN and BN, it can be observed that both BGN and BN have basically the same precision and perform well in the higher recall range (0-0.4). The precision of BGN is slightly higher than that of BN in the medium recall range (0.4~0.6), and is significantly higher than that of BN in the lower recall range (0.6~1). Comparative analysis showed that the model processed by BGN generally had higher precision in the entire recall range than the one processed by BN, which indicated that BGN processing in patrol inspection tasks improved the model performance more effectively, especially in the lower recall range. Therefore, BGN processing was beneficial for improving the precision of electrical control equipment detection model in practical applications.
Figure 9. Comparison of P-R curves before and after Adam processing
Figure 9 shows the comparison of P-R curves before and after Adam processing. By comparing the P-R curve data after and before Adam optimization, it can be observed that the precision after Adam optimization is significantly higher than that before optimization in the higher recall range (0-0.4). After Adam optimization, the precision is still higher than before optimization in the moderate recall range (0.4~0.6), and is significantly higher than before optimization in the lower recall range (0.6~1). Comparative analysis showed that the model processed by the Adam optimization algorithm generally had higher precision in the entire recall range that the one not processed by the algorithm, which indicated that the algorithm improved the model performance more effectively in electrical control equipment patrol inspection tasks. Therefore, the algorithm was beneficial for improving the precision of electrical control equipment detection model in practical applications.
Table 2 presents the precision comparison results of different electrical control equipment detection models. According to the above table, it can be observed that the accuracy of the model constructed in this study (75.62%) is better than that of Faster R-CNN (63.48%) and ProtoNet (61.01%) at 400 iterations, indicating that the constructed model has already shown good performance in the early training stage. The accuracy of the constructed model is 81.37% and 92.85% at 800 and 1200 iterations, respectively. Although the precision of the constructed model is slightly inferior to that of ProtoNet (85.69%) at 800 iterations, it is significantly better than that of Faster R-CNN (84.15%) and ProtoNet (80.96%) at 1200 iterations. The accuracy of the constructed model is 94.16% at 1,600 iterations, which is slightly lower than that of Faster R-CNN (97.46%) but higher than that of ProtoNet (90.51%). The constructed model has 23.74 hours of training time, which is significantly shorter than that of Faster R-CNN (25.41 hours) and ProtoNet (28.69 hours). In summary, the electrical control equipment detection model constructed in this study showed good performance in terms of precision and training time, which converged faster and obtained higher accuracy in practical applications, thus making the electrical control equipment patrol inspection tasks more effective.
Table 2. Precision comparison of different electrical control equipment detection models
|
Training model |
Training sample |
Accuracy of 400 iterations (%) |
Accuracy of 800 iterations (%) |
Accuracy of 1,200 iterations (%) |
Accuracy of 1,600 iterations (%) |
Training time (hour) |
|
Faster R-CNN |
6,528 |
63.48 |
75.42 |
84.15 |
97.46 |
25.41 |
|
ProtoNet |
6,192 |
61.01 |
85.69 |
80.96 |
90.51 |
28.69 |
|
Model in this study |
6,374 |
75.62 |
81.37 |
92.85 |
94.16 |
23.74 |
Table 3. Performance comparison of different electrical control equipment detection models
|
Training model |
Testing sample |
Testing precision (%) |
FPS (frames/second) |
mAP |
|
Faster R-CNN |
1,528 |
95.68 |
13.62 |
0.815 |
|
ProtoNet |
1,635 |
91.42 |
21.59 |
0.942 |
|
Model in this study |
1,041 |
90.57 |
28.37 |
0.905 |
Table 3 shows performance comparison of different electrical control equipment detection models. According to the above table, it can be observed that Faster R-CNN has 95.68% testing precision, which is the best, while the ProtoNet and the model constructed in this study have 91.42% and 90.57% testing precision, respectively. Although the testing accuracy of the constructed model is slightly lower than that of the other two models, the difference is not significant. The constructed model has significant advantages with 28.37 FPS, which is significantly faster than the FPS of Faster R-CNN (13.62) and ProtoNet (21.59), indicating that the constructed model has significant advantages in real-time performance, because it processes and analyzes images faster. ProtoNet has 0.942 mAP, which is the best. However, the mAP of the constructed model is 0.905, which is slightly lower than that of ProtoNet but higher than that of Faster R-CNN (0.815). In summary, the constructed model had slightly lower testing precision than Faster R-CNN and ProtoNet, though it showed significant advantages in real-time performance (FPS) and had high mAP value. Therefore, the constructed model could provide ideal performance in practical application scenarios of electrical control equipment detection, and was especially suitable for scenarios with high real-time performance requirements.
Based on definition and resolution, the electrical control equipment patrol inspection images were classified, and high- and low-resolution image data sets were constructed. When constructing the image sets, the number of images in each category should be relatively balanced to avoid model bias caused by category imbalance. A series of data enhancement techniques, such as rotation, scaling, flipping, color transformation and so on, were applied to the original images in order to increase the diversity of data sets and improve the generalization ability of the model. At the same time, each image in the image set should have accurate and detailed labeling information, including device type and status and so on, which helped improve the detection and recognition accuracy of the model.
Table 4. Comparison of experimental results on high-resolution data sets
|
Training model |
5-Way 1-Shot |
Training strategy in this study |
|
Traditional YOLO V3 |
52.41% |
52.38% |
|
Traditional YOLO V3+BGN |
69.58% |
74.61% |
|
Traditional YOLO V3+Adam |
73.61% |
92.85% |
|
Model in this study |
70.96% |
96.38% |
Table 5. Comparison of experimental results on low-resolution data sets
|
Training model |
5-Way 1-Shot |
Training strategy in this study |
|
Traditional YOLO V3 |
45.62% |
68.49% |
|
Traditional YOLO V3+BGN |
59.48% |
73.51% |
|
Traditional YOLO V3+Adam |
63.55% |
85.47% |
|
Model in this study |
66.81% |
88.16% |
Tables 4 and 5 show the comparison of experimental results on high- and low-resolution data sets, respectively. According to the above table, it can be observed that the traditional YOLOV3 model has 52.41% accuracy on the 5-Way 1-Shot task, and its accuracy has increased to 52.38% after using the training strategy proposed in this study, indicating that the proposed training strategy has limited improvement effects on the traditional YOLO V3 model. After introducing BGN, the accuracy of the traditional YOLO V3+BGN model has significantly improved and reached 69.58%, and has further increased to 74.61% after adopting the proposed training strategy, demonstrating the effectiveness of BGN in model performance improvement. After introducing the Adam optimization algorithm, the accuracy of the traditional YOLO V3+Adam model has reached 73.61%, and has significantly increased to 92.85% after adopting the proposed training strategy, indicating the important role of the algorithm in model performance improvement. The accuracy of the model constructed in this study is 70.96% on the 5-Way 1-Shot task, and has significantly improved to 96.38% after adopting the proposed training strategy, proving significant model performance improvement of the proposed training strategy. In summary, the proposed training strategy improved the performance of different models to some extent, and especially significantly improved the accuracy of the traditional YOLOV3+Adam and the constructed model. Therefore, the training strategy proposed in this study had good optimization effects on high-resolution data sets, which helped improve the performance of the electrical control equipment detection model.
According to the above table, it can be observed that the accuracy of the traditional YOLOV3 model is 45.62% on the 5-Way 1-Shot task, and has significantly improved to 68.49% after using the training strategy proposed in this study, indicating that the proposed training strategy enables the traditional YOLO V3 model to have good optimization effects on the low-resolution data sets. After introducing BGN, the accuracy of the traditional YOLO V3+BGN model has improved to 59.48%, and has further improved to 73.51% after adopting the proposed training strategy, demonstrating the effectiveness of BGN in model performance improvement. After introducing the Adam optimization algorithm, the accuracy of the traditional YOLO V3+Adam model has reached 63.55%, and has significantly improved to 85.47% after adopting the proposed training strategy, indicating the important role of the algorithm in model performance improvement. The accuracy of the model constructed in this study is 66.81% on the 5-Way 1-Shot task, and has significantly improved to 88.16% after adopting the proposed training strategy, demonstrating the significant model performance improvement using the proposed training strategy. In summary, the training strategy proposed in this study improved the performance of different models, and especially significantly improved the accuracy of the traditional YOLOV3+Adam and the model constructed in this study. Therefore, the training strategy proposed in this study also had good optimization effects on low-resolution datasets, which helped improve the performance of the electrical control equipment detection model.
This research studied the electrical control equipment patrol inspection method based on high quality image recognition technology. Electrical control equipment patrol inspection images were enhanced based on DCEN in order to improve the visibility of equipment anomaly features, which helped reduce the misjudgment and misdetection risks during the patrol inspection process. The patrol inspection image set was reconstructed in super resolution, and was combined with clear images to construct a new image set, which improved the patrol inspection efficiency. The electrical control equipment detection process based on YOLO V3 was elaborated. Combined with experiments, the loss variation curve graphs of Retinex-Net and DCEN enhanced network were presented, which demonstrated that DCEN enhanced the low-illumination patrol inspection images more effectively. Model performance before and after the enhancement and reconstruction processing was compared, which verified the need to balance model performance and real-time performance in practical applications. If the goal was to achieve the highest detection precision, the "enhancement+reconstruction" processing should be chosen. In addition, P-R curves before and after BGN and Adam processing were compared, which verified that BGN and Adam optimization algorithm were beneficial for improving the precision of the electrical control equipment detection model. The accuracy and performance of different equipment detection models were compared, which verified that the electrical control equipment detection model constructed in this study had good performance in terms of precision and training time. Then the experimental results on high- and low-resolution data sets were compared, which verified that the training strategy proposed in this study had good optimization effects on both data sets, which helped improve the performance of the electrical control equipment detection model.
[1] Park, J., Shin, U., Shim, G., Joo, K., Rameau, F., Kim, J., Choi, D.G., Kweon, I.S. (2019). Vehicular multi-camera sensor system for automated visual inspection of electric power distribution equipment. In 2019 IEEE/RSJ International Conference on Intelligent Robots and Systems (IROS), Macau, China, pp. 281-288. https://doi.org/10.1109/IROS40897.2019.8968085
[2] Xia, Y., Lu, J., Li, H., Xu, H. (2018). A deep learning based image recognition and processing model for electric equipment inspection. In 2018 2nd IEEE Conference on Energy Internet and Energy System Integration (EI2), Beijing, China, pp. 1-6. https://doi.org/10.1109/EI2.2018.8582593
[3] Li, D., Chen, N., Xiao, C., Gong, J. (2017). An RFID and sensor web-enabled smart electric power equipment inspection system. In 2017 25th International Conference on Geoinformatics, Buffalo, NY, USA, pp. 1-4. https://doi.org/10.1109/GEOINFORMATICS.2017.8090921
[4] Ryabtsev, G.G., Zheltov, K.S. (2015). Functional inspection of subway car electric equipment. Russian Electrical Engineering, 86: 524-526. https://doi.org/10.3103/S1068371215090084
[5] Liu, C.A., Dong, R.F., Wu, H. (2014). Flying robot based viewpoint selection for the electricity transmission equipment inspection. Mathematical Problems in Engineering, 2014: 783810. https://doi.org/10.1155/2014/783810
[6] Dong, L., Chen, N., Liang, J., Li, T., Yan, Z., Zhang, B. (2023). A review of indoor-orbital electrical inspection robots in substations. Industrial Robot: The International Journal of Robotics Research and Application, 50(2): 337-352. https://doi.org/10.1108/IR-06-2022-0162
[7] Falekas, G., Verginadis, D., Karlis, A., Antonino-Daviu, J.A. (2022). Data mining visual inspection information in electrical machine maintenance reports. In 2022 International Conference on Electrical Machines (ICEM), Valencia, Spain, pp. 1842-1848. https://doi.org/10.1109/ICEM51905.2022.9910720
[8] Ning, Z., Chen, H., Wang, X., Wang, S., Guo, L. (2021). Blockchain-enabled electrical fault inspection and secure transmission in 5G smart grids. IEEE Journal of Selected Topics in Signal Processing, 16(1): 82-96. https://doi.org/10.1109/JSTSP.2021.3120872
[9] Cheng, Z.Q., He, J., Zhou, L., et al. (2022). Smart handheld device with flexible wrist and electrical bioimpedance sensor for tissue inspection. Proceedings of the Institution of Mechanical Engineers, Part H: Journal of Engineering in Medicine, 236(3): 416-426. https://doi.org/10.1177/09544119211060100
[10] Dandurand, P., Beaudry, J., Hébert, C., Mongenot, P., Bourque, J., Hovington, S. (2022). All-weather autonomous inspection robot for electrical substations. In 2022 IEEE/SICE International Symposium on System Integration (SII), Narvik, Norway, pp. 303-308. https://doi.org/10.1109/SII52469.2022.9708835
[11] Panagiotou, P.A., Lambourne, A., Jewell, G.W. (2022). Survey of insulation in electrical machines for aerospace: Systems, materials & inspection. In 2022 International Conference on Electrical Machines (ICEM), Valencia, Spain, pp. 2318-2324. https://doi.org/10.1109/ICEM51905.2022.9910857
[12] Cardinale-Villalobos, L., Meza, C., Méndez-Porras, A., Murillo-Soto, L.D. (2022). Quantitative comparison of infrared thermography, visual inspection, and electrical analysis techniques on photovoltaic modules: A case study. Energies, 15(5): 1841. https://doi.org/10.3390/en15051841
[13] Xia, W. (2022). Discussion on the integrated design of electrical internet of things system for inspection robots. In Proceedings of the 11th International Conference on Computer Engineering and Networks, pp. 1116-1124. https://doi.org/10.1007/978-981-16-6554-7_123
[14] Zhao, H., Hu, S., Chen, Q., Tao, J., Dai, J. (2022). A novel framework for automation technology based on machine vision and robotics in electrical power inspection processing. Applied Bionics and Biomechanics, 2022: 9158936. https://doi.org/10.1155/2022/9158936
[15] Coetzer, C.J., West, N. (2022). Radiometric calibration and measurement algorithm for electrical inspection solar-blind ultraviolet cameras. Opto-Electronics Review, 30(1): e140128. http://dx.doi.org/10.24425/opelre.2022.140128
[16] Song, P., Liu, J., Wang, F., Sun, X. (2021). The study of inspection on thin film resistance strain gauge contact failure by electrical excitation thermal-wave imaging. IEEE Transactions on Industrial Electronics, 69(6): 6288-6297. https://doi.org/10.1109/TIE.2021.3088368
[17] Ardito, C., Deldjoo, Y., Di Noia, T., Di Sciascio, E., Nazary, F. (2022). Visual inspection of fault type and zone prediction in electrical grids using interpretable spectrogram-based CNN modeling. Expert Systems with Applications, 210: 118368. https://doi.org/10.1016/j.eswa.2022.118368
[18] Cheng, Z., Dall’Alba, D., Fiorini, P., Savarimuthu, T.R. (2021). Robot-assisted electrical impedance scanning system for 2D electrical impedance tomography tissue inspection. In 2021 43rd Annual International Conference of the IEEE Engineering in Medicine & Biology Society (EMBC), Mexico, pp. 3729-3733. https://doi.org/10.1109/EMBC46164.2021.9629590
[19] Wan, H., Liu, G., Wu, J., Zhang, Z., Yang, Y. (2021). Design of intelligent inspection robot system for electrical equipment based on visual recognition. In 2021 IEEE 4th International Conference on Automation, Electronics and Electrical Engineering (AUTEEE), Shenyang, China, pp. 409-413. https://doi.org/10.1109/AUTEEE52864.2021.9668826
[20] Shang, F., Lai, J., Chen, J., Xia, W., Liu, H. (2021). A model compression based framework for electrical equipment intelligent inspection on edge computing environment. In 2021 IEEE 6th International Conference on Cloud Computing and Big Data Analytics (ICCCBDA), Chengdu, China, pp. 406-410. https://doi.org/10.1109/ICCCBDA51879.2021.9442600
[21] Li, J., Zhang, C. (2019). Electrical equipment inspection process intelligently tailoring based on graph planning. In 2019 IEEE Innovative Smart Grid Technologies-Asia (ISGT Asia), Chengdu, China, pp. 3479-3484.
[22] Chen, Y., Dai, J., Mao, X., Liu, Y., Jiang, X. (2017). Image registration between visible and infrared images for electrical equipment inspection robots based on quadrilateral features. In 2017 2nd International Conference on Robotics and Automation Engineering (ICRAE), Shanghai, China, pp. 126-130.