Ramaswamy Sivaraman![]() | Ming-Hung Lin* | Marcia Iliana Criollo Vargas
| Ming-Hung Lin* | Marcia Iliana Criollo Vargas![]() | Sulieman Ibraheem Shelash Al-Hawary
| Sulieman Ibraheem Shelash Al-Hawary![]() | Untung Rahardja
| Untung Rahardja![]() | Forqan Ali Hussein Al-Khafaji | Ekaterina Vladimirovna Golubtsova
| Forqan Ali Hussein Al-Khafaji | Ekaterina Vladimirovna Golubtsova![]() | Liguang Li
| Liguang Li![]()
© 2024 The authors. This article is published by IIETA and is licensed under the CC BY 4.0 license (http://creativecommons.org/licenses/by/4.0/).
(This article is part of the Special Issue Hybrid Renewable Energy Systems and Integration)
OPEN ACCESS
With the increase in energy consumption and in view of the reduction of fossil fuels and their destructive effects on the environment, the use of renewable energy systems has been considered. The hybrid system consists of several different sources, which increases the overall efficiency of the system. In this article, a hybrid system connected to the grid has been designed, the purpose of which is to increase performance in order to utilize energy sources, inject power into the grid, and reduce greenhouse gas emissions. For this purpose, different scenarios have been carried out and evaluated. For this purpose, an advanced optimization method based on Non-dominated Sorting Genetic Algorithm II (NSGA-II) has been used. the dimensions of energy resources are estimated for the cost price of 220 dollars, the annual profit in the purchase and sale prices of energy is 275, 310 and 344 dollars, respectively 20, 35 and 50 billion dollars. to evaluate the behavior of the proposed resource model, three scenarios have been arranged. the STD power quality index in the third scenario is lower than the base case.
hybrid system, optimizing energy resources, sorting genetic algorithm, power quality index
Today, with the increase in energy consumption, increase in costs, the exhaustible nature of fossil fuels and the need to reduce CO2 emissions, the use of renewable energy systems in the network has been widely considered [1]. Among all renewable systems, PV array and WT wind turbine have received more attention because they generate energy from sunlight and wind. In addition, they are silent and require less maintenance [2, 3] However, the energy produced by the mentioned system strongly depends on weather conditions. The fluctuation rate of the production power of the mentioned system is based on the rate of change in wind speed and sunlight. To solve these problems, PV and WT sources can be combined with other power sources using hybrid topology [4]. The hybrid system consists of several different sources of production, which overcomes the limitations and increases the overall efficiency of the system [5-7]. Coordination between multiple generators and power management is one of the main challenges in the performance of combined systems. Many studies have been done in this field for the control and coordination of integrated systems. Some of these studies are about different power control strategies of hybrid systems [8-10]. and some other methods of controlling electronic power converters in a combined system have been discussed [11, 12]. Ahlstrom et al. presented [13] a strong controller has been used to stabilize the frequency in a micro turbine and electrolyzer. The use of electrolyzer to reduce power fluctuations in a small independent network based on the optimized fuzzy PID controller is discussed [14]. In order to create harmony in a combined system, the physical and dynamic characteristics of each power source should be investigated. In this article, the dynamic model of the desired renewable energy sources has been fully investigated.
The mentioned combined system is connected to a network by a DC/DC boost converter and a three-phase PWM pulse width modulation inverter. Various methods have been presented to determine the optimal dimensions of hybrid electric energy generation systems in connected and disconnected state. In the state connected to the network, the problem is defined as an optimization problem with objectives such as the reliability of meeting the joint demand, the annual cost and the emission rate of polluting gases, and with the help of optimization methods such as linear programming, iteration algorithms and meta-discovery methods such as genetics, the optimal solution is obtained [15, 16]. During the optimization research, the optimal values of the variables that the system designer has control over are determined. These variables include the composition of the components that make up the system as well as the size or amount of each individual component. In the state of being connected to the grid, the power grid is usually considered as a backup source of energy for the system, and minimizing the energy purchased from the grid has been the main goal of the research [17, 18]. In case of full utilization of the energy sources in the hybrid system, the rate of fluctuations of the output power decreases and the capacity of the batteries and their charge and discharge cycle also decreases. This issue has been ignored in all past studies and the effect of hybrid system output power fluctuations on network power quality has also been neglected. The system costs are defined as an objective function, regardless of the energy purchase and sale price, and are optimized along with other functions.
In many areas of research, such as engineering, economics, and logistics, where optimal decisions need to be made despite the presence of trade-offs between two or more competing objectives, multi-objective optimization has been employed. Multi-objective optimization issues have more than one goal, such as reducing the value of one parameter while increasing the value of another. In this research, a new method for determining the optimal dimensions of the hybrid system in the state connected to the network has been proposed. The full utilization of energy resources, the fluctuation rate of power injection into the grid and the emission of polluting gases of greenhouses are defined as objective functions and each of them are optimized using the improved version of the optimization method called Non-dominated Sorting Genetic Algorithm II (NSGA-II) for short.
2.1 Wind turbine system model
Wind turbine systems, designed by aerodynamic blades, convert wind into electricity by mechanical rotation [19, 20]. The energy and current of the wind turbine generator at any moment depends on the local weather conditions and the weight of the turbine blades. Using this method, the induction machine can be considered as state equations with terms of phase angle, electromagnetic torque and electric power. In this article, a 5 kW turbine is connected to a 5 kW induction generator. The mechanical power of the rotor produced by the wind turbine is a function of the rotor speed under different wind speeds.
2.2 Photovoltaic array
A photovoltaic cell generally consists of a parallel current source with a diode [21]. A detailed model of the solar cell is presented in the simelectronics toolbox in MATLAB software.
2.3 Fuel cell model
Fuel cells are electrochemical devices that directly convert chemical energy into electrical energy. The main structure of a fuel cell consists of an electrolyte layer in contact with a porous anode and cathode [22].
2.4 DC/DC boost converter
The role of the DC/DC boost converter is to deliver power to the consumer in a suitable form with high efficiency. Electronic power converters are used in WT and FC systems to convert voltage into DC form in required amounts [23].
3.1 Wind turbine control system
When the wind turbine operates at the maximum power point, maximum energy is taken from it. The operating point of the WT wind turbine can be changed by adjusting the switch link of the DC/DC converter.
3.2 Fuel cell control system
The fuel cell power is the difference between the load power and the total production power of the wind turbine and the solar system. In this article, the fuzzy controller is used to regulate the fuel cell converter. According to the reference current of the fuel cell, this controller produces a suitable control voltage for the PWM modulation block. Finally, according to the control signal, the PWM block adjusts the boost converter to supply the desired load in any condition.
Fuzzy controller is one of the methods of controlling non-linear systems. Its main feature is the use of linguistic variables (more, less, etc.) instead of numerical variables [24, 25]. Fuzzy controllers, unlike classic controllers, control the system without the need for a mathematical model of the system, using the experiences of experts expressed in the form of if-then rules. In a fuzzy set, each member can belong to more than one set. In fuzzy sets, to determine the degree of belonging of each member to that set, a quantity should be introduced as the degree of membership or the degree of membership MA. The membership function MA changes between zero and one. The membership degree of zero indicates that the member does not belong to that set. The degree of membership of one shows that the membership of the member to the desired collection is definite and 100% relative, and it can change from zero to 100% for different elements.
$M A: x \rightarrow[0,1]$ (1)
The above membership function indicates that the set A belongs to a global set determined for a specific problem. Fuzzy control generally includes three parts, input, output and sets of control rules (Table 1). Fuzzy controller laws in this article based on expert knowledge achieved. Genetic algorithm has been used to determine the appropriate range of all input and output membership functions of the controller [26].
At first, two strings of code are determined for input or output. The first string contains μ(i,j), which is the true value of the center of the fuzzy set. In fact, μ(i,j) represents the center point of the j-th fuzzy set of the i-th input or output. The second string contains binary numbers l(i,j) that indicate whether the corresponding fuzzy set is active or inactive. In other words, if l(i,j) is equal to 1, the fuzzy set (i,j) is considered. If l(i,j) is equal to 0, the corresponding set is disabled and not considered. In the genetic algorithm, two related strands are considered as a chromosome. Then, the population of chromosomes is generated randomly. Finally, the parameters related to the fuzzy controller are specified based on the relevant population and are used in each step of the algorithm execution. The quality of each pair is determined in the following proportionality function.
$f=\int_{0}^{T_s}|e(t)| d t$ (2)
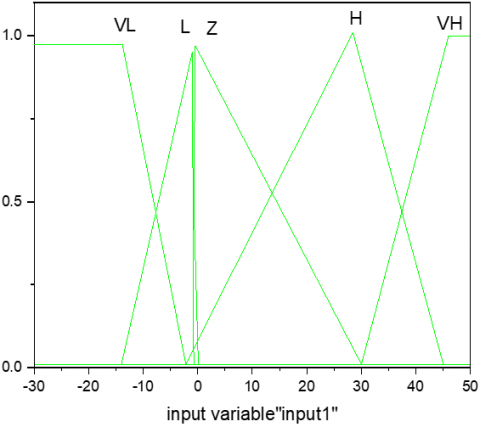
Figure 1. The membership function of the first input
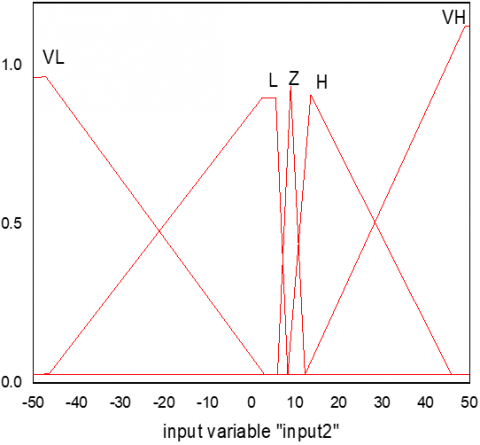
Figure 2. The membership function of the second input
TS is the total simulation time and e(t) is the error time. The algorithm ends when the repetition criterion is reached. Table 2 shows the genetic algorithm parameters.
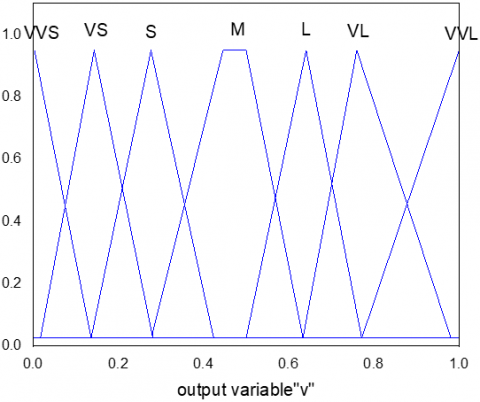
Figures 1 and 2 show the functions of the first input member e(t) and the second input de / dt of the phase controller which is the result of the genetic algorithm. Figure 3 is related to the output of the phase controller obtained by the genetic algorithm.
Figure 3. Controller output membership function
Table 1. Fuzzy rule
|
Input 1 (e(t)) |
||||||
|
Input2 (de/dt) |
VL |
L |
Z |
H |
VH |
|
|
VL |
VVS |
VVS |
VVS |
VVS |
VS |
|
|
L |
VVS |
VS |
VS |
VS |
VS |
|
|
Z |
VS |
S |
M |
L |
VL |
|
|
H |
VL |
VL |
L |
VL |
VVL |
|
|
VH |
VL |
VL |
VL |
VVL |
VVL |
|
Table 2. Genetic algorithm parameters
|
Amount |
Specifications |
|
55 |
Population (P) |
|
75 |
Repeat (N) |
|
55 |
Upper bound (µH) |
|
-45 |
Lower bound (µL) |
In order to achieve the maximum power from the photovoltaic array, in this article, the phase controller is used to track the maximum power. According to Figure 4, dp/dv and its slope are the two inputs of the fuzzy controller. When the dp/dv ratio becomes zero, the maximum power is obtained from the photovoltaic array.
Figure 4. Maximum power control of the solar array
Three indicators are proposed to evaluate the optimal performance of the hybrid system be: full utilization of energy resources, environmental pollution, fluctuations of power injected into the network.
The annual uniform cost is the limitation of the problem. The cost consists of the total costs of the five main parts of the system, including photovoltaic arrays, diesel generators, wind turbines, batteries, and other system equipment such as controllers, inverters, and rectifiers. The second limitation is the limitation of the dimensions of resources. The dimensions of each energy source is an integer, the minimum of which is zero and the maximum of which is 100 for all sources. The minimum and maximum charging capacity of batteries is considered as the third limitation.
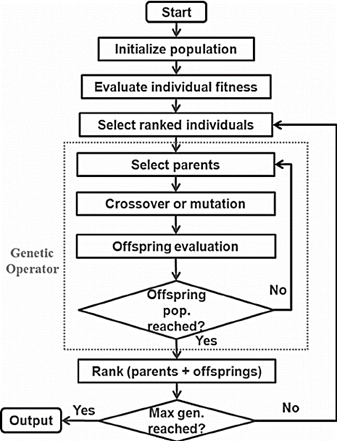
In this article, this algorithm, which is based on the concepts of dominance and ortho optimality, has been used to optimize the objective functions. The general chart of how to calculate the fitting function and the steps of this algorithm is available from the study of Mohammadnezami et al. [7], and the steps of this algorithm are briefly described below (Figure 5):
Figure 5. NSGA-II algorithm flowchart
The initial population P is randomly generated and the archive set P and zero are generated, and the value of the fitting function is calculated for each member of the initial population and the archive. All members that are not dominated by the primary population are moved into the archive, and if the archive set is still empty, the dominated members of the primary population are used to complete the archive. will find with the help of the binary tournament method along with the replacement of the archive members, a new population is generated and placed in the new archive set by applying the mating and mutation operators of the genetic algorithm. Finally, if the number of iterations of the algorithm exceeds the maximum number of iterations, the optimal solution is set equal to a group of non-dominated members who are members of the new archive, and the algorithm is stopped, otherwise, the archive population is considered as the initial population and the algorithm continues.
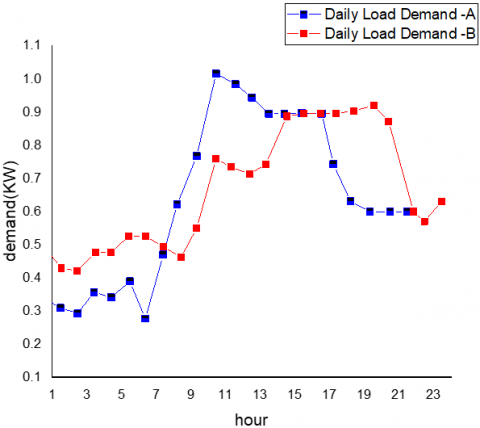
The proposed algorithm has been used to design a hybrid system for providing power to an industrial subscriber. Figure 6 shows two common load demand curves. The joint demand is assumed to be the same every day of the year. In order to calculate the amount of energy production of solar and wind sources from the data of temperature, wind speed and radiation of a city available in the study [10]. The dimensions of the population and archive in the algorithm are 200 and 50, respectively, and the probability of mating and mutation of genetic operators is 70 and 20%.
Figure 6. Industrial common load demand
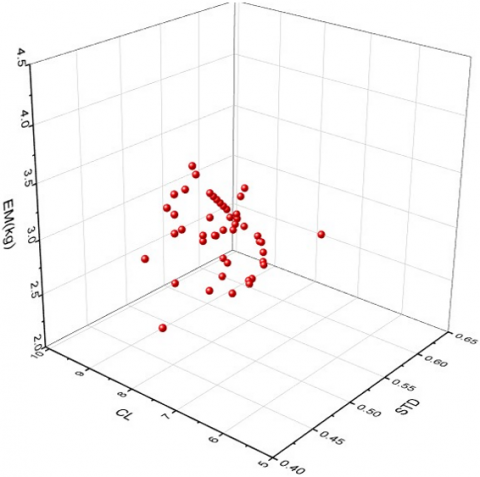
In the form of two scenarios, with and without considering the objective functions, the proposed algorithm calculates the optimal dimensions of each of the resources for two hybrid wind/photovoltaic/battery and diesel/photovoltaic wind/battery systems at the energy purchase and sale price of $220 per kilowatt hour and for load demand A doing. It is noteworthy that every time the algorithm was executed for both scenarios, only one optimal solution was found, which is included in Table 3. It indicates that there is no single solution that is superior to all others for all objectives; therefore, changing the vector of design variables in a Pareto front of non-dominated solutions cannot simultaneously improve all objectives. This change will undermine at least one objective. Consequently, each Pareto solution in that set is inferior to the others, but both are superior. Figure 7 shows the answers available in the NSGA-II archive for the diesel/photovoltaic/wind/battery hybrid system in the second scenario. As it is known, only one optimal answer is found.
Table 3. Optimal dimensions of each resource for two hybrid systems in each scenario
|
Hybrid System |
Wind/Photovoltaic/Battery |
Diesel/Wind/Photovoltaic/Battery |
||
|
Scenario |
Without Objective Function |
With Objective Function |
Without Objective Function |
With Objective Function |
|
NDiesel, NPV |
0; 33 |
0; 63 |
1; 72 |
1; 84 |
|
NWind, NESS |
78; 77 |
58; 72 |
100; 88 |
100; 77 |
|
DL, Em |
4.64; 0 |
3.3; 0 |
6.1; 3.17 |
5.9; 3.17 |
|
STD |
0.76 |
0.60 |
0.36 |
0.32 |
|
ACS (million $) |
3062 |
3061 |
275600 |
275600 |
|
PDiesel, PWind |
0; 131.3 |
0; 114 |
4.3; 210.4 |
4.3; 230.3 |
|
PPV, PESS |
39.6; 108.6 |
57.9; 105.1 |
41.7; 151.8 |
152.4; 43.7 |
|
Pgs (MWh) |
279.55 |
275.53 |
440.9 |
432.9 |
Figure 7. Answers from the diesel/photovoltaic/wind/battery hybrid system archive
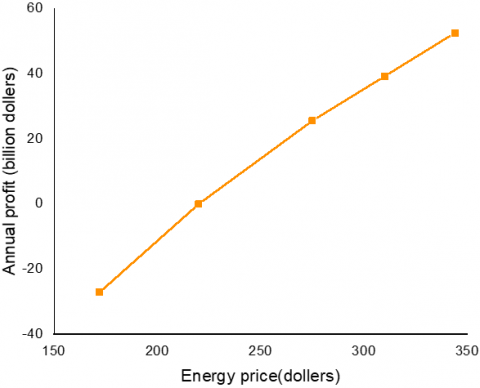
Figure 8. Annual profit of the hybrid system at LCOE 220 dollars per year
As can be seen in Table 2, the dimensions of each source are different in two scenarios, and in the second scenario, the value of each objective function is smaller than the first scenario. Despite the Em pollution index for the diesel/photovoltaic/wind/battery hybrid system, for both scenarios, the algorithm suggests only one diesel source, and the majority of the shared load demand is provided by renewable sources. For both hybrid systems, in both scenarios, the number of batteries has also decreased with the decrease in the DL index. The STD power quality index for diesel/photovoltaic/wind/battery hybrid system is lower than wind/photovoltaic/battery system in two scenarios, and the power injected into the grid has also increased. DL and STD index are related to the indicator in such a way that when one of them decreases, the other one also decreases.
In Figure 8, the graph of the common annual profit in the purchase and sale prices of different energy for the diesel/photovoltaic/wind/battery hybrid system is drawn. As it is known, if the dimensions of energy resources are estimated for the cost price of 225 dollars, the energy price reach the break-even point of the hybrid system. The annual profit in the purchase and sale prices of energy is 275, 320 and 340 dollars, respectively 20, 35 and 50 billion dollars. If the price of energy decreases to 172 dollars, the hybrid system will not be economical and will result in a loss of about 24 billion dollars per year.
In order to evaluate the behavior of the proposed resource model, three scenarios have been arranged. In the first and second scenario, the amount of wind speed and radiation has been increased by 30%, and in the third scenario, the demand of load B in Figure 7 has replaced the demand of load A. The dimensions of each source for the diesel/photovoltaic/wind/battery hybrid system are calculated considering the objective functions and included in Table 4.
Table 4. Optimal dimensions of each source in three scenarios
|
Scenario |
Base Mode |
Increased Wind |
Increased Radiation |
Load |
|
NDiesel, NPV |
1, 84 |
1, 1100 |
1, 83 |
1, 84 |
|
NWind, NESS |
100, 77 |
72, 100 |
100, 100 |
100, 75 |
|
DL, Em |
5.9, 3.18 |
7.04, 3.18 |
8.2, 3.17 |
5.6, 3.18 |
|
STD |
0.59 |
0.85 |
0.58 |
0.55 |
|
ACS (million \$) |
275600 |
275600 |
275600 |
275600 |
|
PDiesel, PWind |
4.3, 240.4 |
4.3, 215.5 |
4.3, 235.5 |
4.3, 210.5 |
|
PPV, PESS |
43.7, 152.4 |
43.6, 175.1 |
43.7, 175.1 |
43.7, 175.1 |
|
Pgs (MWh) |
433.9 |
502.2 |
448.5 |
430.7 |
As can be seen in Table 5, the number of wind and photovoltaic sources has decreased in the second and third scenarios as a result of an increase in wind speed and radiation intensity as a result of an increase in the production energy of wind turbines and photovoltaic arrays. This is due to the fact that the number of wind turbines and photovoltaic arrays has increased. Because of the part that the Em pollution index plays, the proposed algorithm has only identified a single diesel source across all of the different situations.
Table 5. Technical and economic parameters
|
Parameter |
Amount |
Parameter |
Amount |
|
$P_N^D$ |
0.4KW |
Pricefuel |
0.9\$ per liter |
|
PMPREF |
0.130KW |
ηDA,ηoth |
0.99%, 99% |
|
γPV |
-0.2%℃ |
ηdis,ηch |
100%, 86% |
|
DOD |
0.9 |
Vci,Vco,Vr |
2.5, 14, and 12 $\frac{m}{s}$ |
|
Pwt-r |
1Kw |
Battery life |
5 years |
|
$C_{\text {capital }}^{P V}$ |
1800\$ |
$C_{\text {maintenance }}^{P V}$ |
0$ |
|
$C_{\text {capital }}^{\text {Diesel }}$ |
1713\$ |
$C_{\text {maintenance }}^{\text {Diesel }}$ |
0.2$ per hour |
|
$C_{\text {replacment }}^{\text {ESS }}$ |
42\$ |
$C_{\text {maintenance }}^{\text {ESS }}$ |
42\$ |
|
$C_{\text {capital }}^{\text {Wind }}$ |
3100\$ |
$C_{\text {maintenance }}^{\text {Wind }}$ |
100\$ |
|
ƒ, i |
1.6%, 3.85% |
n |
20\$ |
The STD power quality index in the third scenario is lower than the base case because the load demand curve of B is more uniform than that of A. This results in a poorer overall power quality. Scenarios 1 and 2 are the most economically feasible.
In this research, a new method was proposed to determine the optimal dimensions of resources in a hybrid system connected to the network. Unlike other articles, this time the balance between the system's finished price and the price of buying and selling energy was considered as a constraint. Three objective functions were mathematically defined in order to evaluate the system in terms of full utilization of resource capacity, fluctuations of electricity injected into the network and emission rate of polluting greenhouse gases. The problem was defined as a multi-objective optimization problem and solved with the help of NSGA-II. The following results can be obtained from technical and economic analysis and sensitivity analysis:
A smaller Dl indicates a better use of the potential of the resources in the hybrid system, so that the fluctuations of the output power of the resources are less and of course, a smaller number of batteries are needed for energy storage.
The proposed model behaves well for each of the sources and the dimensions of each of the sources change correctly with the change in the condition of wind speed, radiation and load demand.
The NSGA-II is capable of solving the optimization problem and offers only one optimal solution in each scenario.
With the help of the proposed method and with the certainty of the expected annual profit and the purchase and sale price of energy to the grid, the LCOE value of the hybrid system can be calculated and then the economic dimensions of each resource with and without objective functions.
[1] Ikeda, S., Nagai, T. (2021). A novel optimization method combining metaheuristics and machine learning for daily optimal operations in building energy and storage systems. Applied Energy, 289: 116716. https://doi.org/10.1016/j.apenergy.2021.116716
[2] Siddaiah, R., Saini, R.P. (2016). A review on planning, configurations, modeling and optimization techniques of hybrid renewable energy systems for off grid applications. Renewable and Sustainable Energy Reviews, 58: 376-396. https://doi.org/10.1016/j.rser.2015.12.281
[3] Lyu, B., Ramezani, P., Hoang, D.T., Gong, S., Yang, Z., Jamalipour, A. (2021). Optimized energy and information relaying in self-sustainable IRS-empowered WPCN. IEEE Transactions on Communications, 69(1): 619-633. https://doi.org/10.1109/TCOMM.2020.3028875
[4] Akhavan Shams, S., Ahmadi, R. (2021). Dynamic optimization of solar-wind hybrid system connected to electrical battery or hydrogen as an energy storage system. International Journal of Energy Research, 45(7): 10630-10654. https://doi.org/10.1002/er.6549
[5] Kusakana, K. (2016). Optimal scheduling for distributed hybrid system with pumped hydro storage. Energy Conversion and Management, 111: 253-260. https://doi.org/10.1016/j.enconman.2015.12.081
[6] Açıkkalp, E., Chen, L., Ahmadi, M.H. (2020). Comparative performance analyses of molten carbonate fuel cell-alkali metal thermal to electric converter and molten carbonate fuel cell-thermo-electric generator hybrid systems. Energy Reports, 6: 10-16. https://doi.org/10.1016/j.egyr.2019.11.108
[7] Mohammadnezami, M.H., Ehyaei, M.A., Rosen, M.A., Ahmadi, M.H. (2015). Meeting the electrical energy needs of a residential building with a wind-photovoltaic hybrid system. Sustainability (Switzerland), 7(3): 2554-2569. https://doi.org/10.3390/su7032554
[8] Chi, C., Ji, K., Song, P., Marahatta, A., Zhang, S., Zhang, F., Qiu, D., Liu, Z. (2021). Cooperatively improving data center energy efficiency based on multi-agent deep reinforcement learning. Energies, 14(8): 2071. https://doi.org/10.3390/en14082071
[9] García-Vera, Y.E., Dufo-López, R., Bernal-Agustín, J.L. (2020). Techno-economic feasibility analysis through optimization strategies and load shifting in isolated hybrid microgrids with renewable energy for the non-interconnected zone (NIZ) of Colombia. Energies, 13(22): 6146. https://doi.org/10.3390/en13226146
[10] Salkuti, S.R. (2020). Risk-based optimal operation of hybrid power system using multiobjective optimization. International Journal of Green Energy, 17(13): 853-863. https://doi.org/10.1080/15435075.2020.1809424
[11] Ren, F., Wang, J., Zhu, S., Chen, Y. (2019). Multi-objective optimization of combined cooling, heating and power system integrated with solar and geothermal energies. Energy Conversion and Management, 197: 111866. https://doi.org/10.1016/j.enconman.2019.111866
[12] Satapathy, P., Dhar, S., Dash, P.K. (2016). A mutated hybrid firefly approach to mitigate dynamic oscillations of second order PLL based PV-battery system for microgrid applications. Sustainable Energy Technologies and Assessments, 16: 69-83. https://doi.org/10.1016/j.seta.2016.05.004
[13] Ahlstrom, M., Mays, J., Gimon, E., et al. (2021). Hybrid resources: Challenges, implications, opportunities, and innovation. IEEE Power and Energy Magazine, 19(6): 37-44. https://doi.org/10.1109/MPE.2021.3104077
[14] Özgirgin, E., Devrim, Y., Albostan, A. (2015). Modeling and simulation of a hybrid photovoltaic (PV) module-electrolyzer-PEM fuel cell system for micro-cogeneration applications. International Journal of Hydrogen Energy, 40(44): 15336-15342. https://doi.org/10.1016/j.ijhydene.2015.06.122
[15] Sathishkumar, D., Karthikeyan, C. (2020). Adaptive power management strategy-based optimization and estimation of a renewable energy storage system in stand-alone microgrid with machine learning and data monitoring. International Journal of Wavelets, Multiresolution and Information Processing, 18(1): 1941023. https://doi.org/10.1142/S0219691319410236
[16] Miyake, S., Kudtongngam, J., Iwamura, K., Nakanishi, Y. (2019). Optimizing the facility planning in BEMS using HOMER for expandable micro-grids clusters. In 2019 IEEE Power & Energy Society Innovative Smart Grid Technologies Conference (ISGT), Washington, DC, USA, pp. 1-5. https://doi.org/10.1109/ISGT.2019.8791665
[17] Qayyum, F., Jamil, F., Ahmad, S., Kim, D.H. (2022). Hybrid renewable energy resources management for optimal energy operation in nano-grid. Computers, Materials and Continua, 71(2): 2091-2105. https://doi.org/10.32604/cmc.2022.019898
[18] Praveen Kumar, T., Subrahmanyam, N., Maheswarapu, S. (2021). Genetic algorithm based power control strategies of a grid integrated hybrid distributed generation system. Technology and Economics of Smart Grids and Sustainable Energy, 6(1): 13. https://doi.org/10.1007/s40866-021-00109-8
[19] Mandal, S., Mandal, K.K., Tudu, B. (2015). Optimal design of a hybrid power system using a new improved particle swarm optimization technique. IET Conference Publications, 2015: 494-499.
[20] Derewonko, P., Pearce, J.M. (2009). Optimizing design of household scale hybrid solar photovoltaic + combined heat and power systems for Ontario. In 2009 34th IEEE Photovoltaic Specialists Conference (PVSC), Philadelphia, PA, USA, pp. 001274-001279. https://doi.org/10.1109/PVSC.2009.5411247
[21] Mohammed, A., Pasupuleti, J., Khatib, T., Elmenreich, W. (2015). A review of process and operational system control of hybrid photovoltaic/diesel generator systems. Renewable and Sustainable Energy Reviews, 44: 436-446. https://doi.org/10.1016/j.rser.2014.12.035
[22] Salkuti, S.R. (2020). Optimal day-ahead renewable power generation scheduling of hybrid electrical power system. In: Ray, P., Biswal, M. (eds) Microgrid: Operation, Control, Monitoring and Protection. Lecture Notes in Electrical Engineering, vol. 625. Springer, Singapore. https://doi.org/10.1007/978-981-15-1781-5_2
[23] Ghavidel, B.Z., Babaei, E., Hosseini, S.H. (2019). An improved three-input DC-DC boost converter for hybrid PV/FC/Battery and bidirectional load as backup system for smart home. In 2019 10th International Power Electronics, Drive Systems and Technologies Conference (PEDSTC), Shiraz, Iran, pp. 533-538. https://doi.org/10.1109/PEDSTC.2019.8697731
[24] De, A.R., Musgrove, L. (1988). The optimization of hybrid energy conversion systems using the dynamic programming model-Rapsody. International Journal of Energy Research, 12(3): 447-457. https://doi.org/10.1002/er.4440120309
[25] Aziz, A.S. (2017). Techno-economic analysis using different types of hybrid energy generation for desert safari camps in UAE. Turkish Journal of Electrical Engineering and Computer Sciences, 25(3): 2122-2135. https://doi.org/10.3906/elk-1602-159
[26] Haghi, E., Farshidian, B., Saboohi, Y. (2017). Developing a model for optimal sizing of a small hydropower/PV hybrid system for electrification. In 2017 IEEE International Conference on Smart Energy Grid Engineering (SEGE), Oshawa, ON, Canada, pp. 170-176. https://doi.org/10.1109/SEGE.2017.8052794