Harshal Patil*![]() | Snehal Bhosale
| Snehal Bhosale![]()
© 2023 IIETA. This article is published by IIETA and is licensed under the CC BY 4.0 license (http://creativecommons.org/licenses/by/4.0/).
OPEN ACCESS
The accurate prediction of tropical cyclone severity is of paramount importance in mitigating the potential damages arising from such catastrophic events. Constant monitoring and precise forecasting of tropical cyclones using remote satellite imagery from the Meteorological and Oceanographic Satellite Data Archival Centre (MOSDAC) are crucial. However, the challenge encountered with the current deep learning approach to image classification is its reliance on extensive labelled data and its limitations in few-shot learning. This study proposes a novel few-shot learning (FSL) approach for the prediction of tropical cyclone severity. In conjunction with FSL, the earth mover's distance (EMD) metric is employed to compute the distance between dense regions, thereby determining the relevance of an image. The methodology harnesses a remote satellite dataset provided by MOSDAC. The proposed approach is underpinned by the human capacity to identify novel classes from a limited number of samples, leveraging previously acquired knowledge. The FSL methodology adopts a meta-learning mechanism, enabling enhanced understanding of the data and facilitating the generalization of a new class of data. The results indicate that the FSL+EMD-based models outperform other state-of-the-art models, achieving a prediction accuracy of 85.8% in forecasting tropical cyclone severity from remote satellite imagery.
tropical cyclone, remote satellite images, few-shot learning, deep learning, image classification
Annually, an average of four to five cyclones are observed, with the deadliest often originating from the Indian Ocean basins [1]. These regions are particularly vulnerable due to high coastal population densities, unique coastal configurations, and shallow bottom topography [2]. Though cyclones formed in these areas are typically weaker compared to those in other regions, the associated death toll is disproportionately higher. For instance, in 1970, a tropical cyclone in Bangladesh was responsible for an estimated three million deaths [3]. Examples of remote satellite images of tropical cyclones are provided in Figure 1.
Given the potential for substantial loss of life, advanced prediction of cyclone intensity and tracking of cyclone movements are of paramount importance. Timely forecasting can facilitate actioning of preventive measures, including possible evacuation, thus aiding in preserving human life. Traditionally, tropical cyclones have been forecasted based on satellite observations generated from ground-based radar networks, particularly as they approach land [4].
In recent years, accuracy in forecasting has seen significant improvement, thanks to advancements in numerical prediction models and satellite surveillance [5]. Over the last few decades, further classifications of tropical cyclones have been introduced, such as depressions, cyclone storms, and deep depression observations.
Beyond mere damage prevention, the importance of accurate predictions from remote satellite images of tropical cyclone intensity extends to several areas. Timely and precise warnings, underpinned by accurate predictions, can enable affected populations to take necessary precautions or evacuate in advance of the cyclone's arrival. Such predictions assist governments and relief organizations in effective resource allocation. The knowledge of an expected cyclone's strength can guide the preparation and mobilization of appropriate manpower, equipment, and supplies for aid and support in affected areas.
Moreover, accurate predictions can help to protect critical infrastructure, including roads, bridges, and buildings. Timely warnings allow authorities to undertake measures to reinforce infrastructure and minimize damage. The economic implications of cyclones can be severe, particularly in regions heavily reliant on agriculture and tourism. Accurate predictions allow businesses and governments to plan for potential disruptions and minimize economic losses.
The Indian National Satellite (INSAT-3D dataset), made accessible through the Meteorological and Oceanographic Satellite Data Archival Centre (MOSDAC), provides a wealth of historical data that is invaluable for tropical cyclone prediction. This dataset comprises extensive meteorological information, such as temperature, humidity, cloud characteristics, and atmospheric motion vectors, obtained from the geostationary satellite. This information is critical for monitoring and forecasting tropical cyclones in the Indian Ocean region.
The INSAT-3D provides real-time, high-resolution, multi-dimensional data, enabling meteorologists to closely track cyclone formation, evolution, and movement. This information, in conjunction with advanced modelling techniques, allows forecasters to issue timely and accurate predictions, thereby enhancing disaster preparedness and response efforts, protecting lives and limiting the socio-economic impact of tropical cyclones in vulnerable coastal areas.
However, challenges persist in cyclone prediction from remote satellite images. High false positive rates, variations in image resolution and size, and the inherent difficulty in predicting alterations in cloud patterns over time in tropical cyclones, all contribute to these challenges. Determining a tropical cyclone's intensity and rate of growth or decay necessitates repeated measurements. Despite these advanced techniques, satellite observation-based cyclone intensity level prediction remains a demanding task [6].
Figure 1. Sample tropical cyclone remote satellite images
In this work, the main objective is to analyse the remote satellite images from MOSDAC and predict the cyclone type based on the intensity level. According to the MOSDAC reports, the area under the cyclone can be classified as ‘depression’ when the pressure is low compared with the and severe cyclonic storms between 1924 and 1988 [7]. Later in 1988, the intensity level changed and introduced two categories: severe cyclonic storms and super cyclonic storms with core hurricane winds. The iBeaufort scale [8] associated with wind speed in knots is presented in Table 1. It presents categorizing a cyclonic system based on the wind speed ranges as instructed by the Indian Meteorological Department.
Table 1. Categorization of the cyclonic system
|
System |
Wind Speed (Knots) |
|
Low-Pressure Zone |
<17 |
|
Depression |
17-27 |
|
Deep Depression |
28-33 |
|
Cyclonic Storm |
34-47 |
|
Severe Cyclonic Storm (SCS) |
48-63 |
|
Very SCS |
64-85 |
|
Extremely SCS |
86-119 |
|
Super Cyclonic Storm |
>119 |
In the study, we focused on recent cyclones from 2012-2021. Some of the recent tropical cyclones reported by MOSDAC are Roanu, Vardah, Ockhi, Mekunu, Titli, Fani, Hikaa, Amphan, Tauktae, and Yaas. Figure 2(a) shows the Roanu-related information from the combined typhoon warning center (JTWC). Roanu occurred in 2016, causing severe floods near Sri Lanka and Bangladesh [9]. It formed in a low-pressure area on 14th May2016, slowly drifted north. Then it increased into a cyclonic storm on 19th May. The term Roanu was devised by India Meteorological Department (IMD).
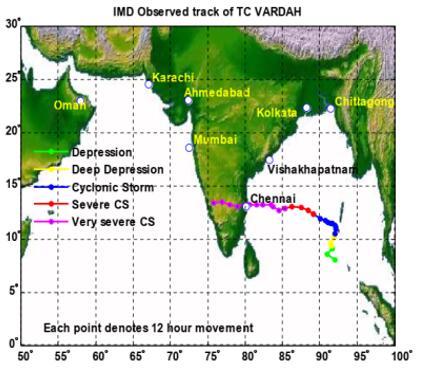
Figure 2(b) shows another tropical cyclone named Vardah which means ‘rose’ in Arabic, given by Pakistan from the nomenclature list of the Arabian Sea and Bay of Bengal cyclone [10].
It declined into a severe cyclone storm on 12th Dec 2016 from the eastern coast of India near Chennai with a wind speed of 65 mph. Figure 2(c) displays the best path of cyclone OCKHI with its intensity categories presented by IMD, and Figure 2(d) shows the most fitted track of cyclone Mekunu with its intensity categories [11].
Figure 2. Identified path and intensity of different cyclones with their intensity categories by Indian Meteorological Department: (a) Roanu (JTWC); (b) Vardah; (c) OCKHI; (d) Mekenu
Few-shot learning for image classification is a machine learning paradigm where the model is trained to recognize and classify objects or patterns in images when provided with only a very limited number of examples per class. Unlike traditional image classification, which often requires a large dataset for each class, few-shot learning seeks to generalize from a small, scarce set of examples. This challenging task requires models to learn to identify common features, characteristics, or relationships shared among classes, enabling them to make accurate predictions for new, unseen categories with only a handful of training samples. Few-shot learning holds significant potential for applications where obtaining extensive labeled data is impractical or expensive, such as in medical imaging, robotics, and fine-grained object recognition
Earth mover's distance (EMD), also known as Wasserstein distance, is a mathematical metric used in image classification to quantify the dissimilarity between two probability distributions represented as images. In the context of image classification, EMD measures how much "work" is needed to transform one image distribution into another. It computes the optimal way to redistribute mass from one image to match the other while minimizing the cost of transportation. EMD is particularly valuable for comparing complex image representations, such as histograms or dense feature maps, allowing for a more nuanced assessment of image similarity and dissimilarity. In image classification, EMD can be employed to measure structural differences between image representations, enabling more robust and fine-grained classification tasks.
The proposed solution provides a combining the few shots learning and earth mover distance techniques. In order to determine the significance of a satellite image, we calculated a structural distance between dense image representations using the earth mover's distance (EMD) as a metric. When representing the image as distance for classification, the EMD creates the best matching flows between structural parts with the lowest possible matching cost. In order to determine the significant weights of the individual components that make up the EMD formulation, a cross-reference mechanism was developed. This mechanism can successfully reduce the effects of the crowded background and significant intra-class intensity variations Few-Shot Learning is a kind of meta-learning in which a learner is given practice on a variety of related tasks within the meta-training phase in order to successfully generalize to new (but related) activities with a limited number of cases during the meta-testing phase. During this type of meta-learning, the number of instances is restricted. N-way-K-shot classification is used in few-shot learning to distinguish between N classes using K examples. The significant contribution of the study is presented as follows:
·The INSAT3D dataset was obtained for our study by accessing the MOSDAC server.
·Subsequently, the outcomes of the analysis are depicted through the utilization of data visualization techniques.
·The thereby generated dataset underwent data augmentation. Subsequently, we embarked on the development of multiple cyclone prediction algorithms.
·A novel unified model few-shot learning and earth movers distance algorithm is developed and applied to predict the cyclone, and accuracy the outcomes are compared with current deep learning models.
The rest of the segments of the study are ordered as following. Section 2 briefs the recent research on cyclone prediction, section 3 describes the projected methodology, section 4 explains the results obtained, and lastly, section 5 completes the paper.
The literature reveals a diverse set of methodologies employed for tropical cyclone prediction and tracking. Piñeros et al. [12] proposed a method to empirically differentiate expanding cloud clusters from non-developing ones at the onset of cyclogenesis. A statistical testing mechanism was utilized to examine the axisymmetry of a cloud configuration within a defined radius. The center of a tropical cyclone was automatically detected by Jaiswal et al. [13] through a unique approach using a spiral pattern derived from infrared (IR) satellite images.
Fiolleau et al. [14] developed a method known as the tracking of the organized convection, which utilized a three-dimensional localization technique. This methodology employed a temporal sequence of infrared imagery from a geostationary satellite for the detection and tracking of mesoscale convective systems (MCS). Their findings suggested that MCSs could be identified during early and later stages of their life cycles, as well as during their dispersion phases.
Highlighting the importance of the storm's eye for reliable cyclone forecasting, Jaiswal and Kishtawal [15] introduced a pragmatic strategy to locate regions in a type of tropical cyclone (TC) similar to others. A semi-automated computing methodology was deployed to analyze the pattern of cyclone storm intensity growth using pre-processed visible and enhanced infrared (EIR) satellite imagery [16], employing elliptical fourier descriptors (EFD) and principal component analysis (PCA) techniques.
Kar et al. [17] suggested a methodology for determining a zone focusing on the distance from the image's center and other features. This involved calculating the center of mass and the average distance between significant points using Euclidean and Manhattan distance measures. Contrasting traditional machine learning (ML) techniques with linear discriminant analysis (LDA), Kim et al. [18] asserted the superiority of conventional ML techniques for cyclone identification.
Introducing a novel deep-learning model, Lian et al. [19] offered predictions for tropical cyclone paths by considering geographic locations and multiple meteorological parameters. Composed of convolutional neural network (CNN) and gated recurrent unit (GRU) layers, the model was trained on a dataset of actual tropical cyclones occurring between 1945 and 2017.
Alessandrini et al. [20] proposed an analogue ensemble method for TC intensity forecasting. This method generated a set of analogue forecasts by scanning an HWRF library for previous forecasts with similar significant characteristics to the latest HWRF estimates. Song et al. [21] introduced a new deep learning (DL) method for predicting the path of tropical cyclones. This method utilized a bidirectional gated recurrent unit network (BiGRU) in conjunction with a specially designed attention function for path forecasting.
Utilizing a comprehensive dataset of intensity and trajectory information for tropical cyclones detected in the Western North Pacific since 1949, Pan et al. [22] developed a recurrent neural network (RNN) approach to forecast tropical cyclone intensity. Wu et al. [23] employed a modified generative adversarial network for predictive model design to make accurate forecasts of tropical cyclone spatial information. They leveraged two distinct deep neural networks in the estimation module, enabling them to glean placement and intensities from forecast-generated data.
The literature review indicates that current methods grapple with the challenge of determining the similarity score, crucial for predicting cyclones in remote satellite images. Few-shot learning, however, presents several advantages over traditional deep learning for image classification, notably its proficiency with limited labelled data. This makes it more adaptable to real-world scenarios where the collection of extensive datasets may be impractical or costly. Few-shot learning exploits the valuable knowledge encoded in a few examples per class and generalizes effectively to unseen categories. Moreover, it promotes better model generalization by encouraging the discovery of common features and relationships across classes, leading to enhanced robustness and adaptability. This approach is particularly beneficial in fields such as medical imaging, where acquiring large datasets is challenging and offers a promising avenue to address data scarcity issues in various image classification applications.
Figure 3 presents the workflow of the whole methodology of this study. The proposed predictive model design begins with the data collection from the MOSDAC site and pre-processing of the images according to the model requirements. As the data size is not huge enough, data augmentation is implemented. Then, model development starts after checking with the exploratory data analysis.
Figure 3. Work flow of the proposed methodology
3.1 Data collection
The utilized dataset comprises INSAT-3D Infrared and Raw Cyclone Imagery spanning from 2012 to 2021. The dataset comprises all infrared and raw cyclone images captured by INSAT3D within the Indian Ocean, Bay of Bengal, and Arabian Sea regions between 2012 and 2021. Additionally, the dataset provides the intensity for every cyclone picture frame measured in Knots. The primary source of information was obtained from the MOSDAC server. Examples of raw and Infrared images can be seen in Figures 4(a) and 4(b), which are taken from the INSAT-3D TIR1 Dataset.
Figure 4. INSAT-3D TIR1 sample image data: (a) Set of raw images; (b) Set of infrared images
3.2 Data augmentation
In this work, data augmentation is applied to prevent overfitting. Data extension is made while retrieving the images in batches. The images are randomly rotated from training in the -30 to +30 degrees range and flipped with 50% vertical and horizontal, respectively. The contract and darkness are adjusted randomly with -5 to +5%. The zoom and shear ranges are set to 0.3 and 0.2, respectively.
3.2.1 Pre-processing
In few-shot learning for tropical cyclone prediction through image classification, pre-processing is a critical step to prepare the data for effective model training and prediction. It typically involves several key tasks, including data augmentation and feature extraction. Data augmentation techniques, such as rotation, scaling, cropping, and flipping, are applied to the limited available cyclone images to artificially expand the dataset and enhance model generalization. Additionally, images may be normalized to ensure consistent brightness and contrast. Feature extraction is vital to extract meaningful representations from the cyclone images. convolutional neural networks (CNNs) are commonly employed to automatically extract relevant features from the images, capturing important patterns and structures. These pre-processed features serve as the input for Few-shot learning models, enabling them to better understand the relationships between different cyclones and make accurate predictions, even when provided with only a few examples per class.
3.3 Exploratory data analysis
To predict the cyclone, we collected KALPANA-1 satellite images. Every single satellite image was labelled through determining the timestamp and its proper coordinates in each cyclone type’s intensity level time plot. The infrared images contained within the dataset were utilized for the purpose of predicting cyclone categories. Figure 5 shows the distribution of satellite image data based on wind speed. From Exploratory data analysis, it is observed that data in each class is not proportionally distributed.
Figure 5. Distribution of satellite image data based on wind speed (Knots)
3.4 Model development
After the data augmentation and exploratory data analysis, the data is prepared to give input to the built deep learning models. Initially, we tried with Long-Short Term Memory (LSTM). LSTM is an algorithm that learns from remembering the dependencies from the long term without neglecting the gradient descent values. It consists of three gates and a memory cell state. The cell of LSTM is calculated as follows:
$Y=\frac{h_{t-1}}{y_t}$ (1)
ft=σ(Wf.Y+bf) (2)
it=σ(Wi.Y+bi) (3)
ot=σ(Wo.Y+bo) (4)
ct=(ftʘct-1)+itʘ tanh(Wc.Y+bc) (5)
ht=otʘtanh(ct) (6)
In the above equations it, ft, and ot represents the input, forget, and output gate, respectively, ct defines the cell state. The weighted matrices Wi, Wf, Wo $\in$ Rdx2d are mapped with hidden layer input with three gates and cell input. The biases are given by bf, bi, bo $\in$ Rdand σ represents the sigmoid function, and multiplication is represented by ʘ. yt and ht denotes the input and hidden vector of LSTM bidirectional. LSTM includes forward and backward LSTM layers. The forward LSTM layer captures the historical information, and the future sequence is captured by the backward LSTM [24].
After the LSTM, a convolutional neural network (CNN) model is built to predict tropical cyclones. In CNN, the kernel was responsible for producing a feature map that was passed on to the subsequent convolutional layers. This map was based on the input matrix. In order to bring down the dimensionality, the max pooling algorithm takes the mean and builds an input matrix for the subsequent convolutional layer. The categorization of reviews is derived using the information that is supplied into the fully connected layers from the outputs of the max pooling layers. Since the collected image samples are fewer, applying deep CNN may be adequate. Hence, we tried a new approach called a few-shot learning (FSL) model. Few-shot learning is the problem of predicting based on a few data samples. It is a supervised learning algorithm [24]. The model’s objective is to identify the images in the train data and then generalize with the given test images dataset.
To apply few-shot learning and earth mover's distance (EMD) for tropical cyclone prediction through image classification, a multi-step process can be devised. Firstly, you need to gather a diverse dataset of tropical cyclone images captured by remote satellites over time, ensuring that it includes a broad spectrum of cyclone intensities, sizes, and features. For Few-shot learning, select a subset of these images as your support set, which represents a few examples from different cyclone categories (e.g., categories like "weak," "moderate," and "severe"). The remainder of the images forms the query set, representing the new, unseen cyclones that need prediction.
Next, utilize deep learning models, such as convolutional neural networks (CNNs), to extract rich features from the images in both the support set and the query set. Apply few-shot learning techniques, such as Siamese networks or prototypical networks, to understand the similarities and differences between cyclones in the support set. Earth mover's distance can then be employed to measure the structural dissimilarity between the features of query cyclones and those in the support set. The cyclones in the support set that are most similar to the query cyclone, based on their EMD distances, can serve as prototypes for classification. By transferring the knowledge from the support set to classify cyclones in the query set, this approach enables accurate and efficient tropical cyclone prediction based on their intensity and other characteristics, even when provided with limited training examples. This methodology showcases the potential of Few-shot learning and EMD as a powerful tool for enhancing tropical cyclone prediction through image classification, particularly when dealing with data scarcity.
A support and query set make up FSL. The support set consists of a few labelled data on each new category of data, which is trained to generalize the new class. The query set is made up of new and old data classes on which the model has to generalize the knowledge gained from the support set. In this work, earth mover distance (EMD) is integrated to compute the similarity score. Figure 6 shows the integrated architecture of the FSL and EMD for cyclone prediction.
The earth mover’s distance [25] is determined by separating two groups of loaded items or dispersions, with the foundation being the separation between each object. It takes the shape of the renowned transportation issue from the field of linear programming. Especially assumed that a set of sources S={si|i=1, 2, ..., m} are needed to transfer things to a set of destinations D={dj|j=1, 2, ..., k} where "si" stands for "source elements," "dj" stands for "provider," and "I" represents "request" from "jth required people". The price per component transferred from provider i to demander j is signified by cij, and the number of units moved is symbolized by xij. The aim of the carriage issue is then to discover the lowest priced flow of things X˜={x˜ij|i=1, ..., m, j=1, ..., k} from the providers to the requests:
$\begin{aligned} & \underset{x_{\tilde{j}}}{\operatorname{minimize}} \sum_{i=1}^m \sum_{j=1}^k c_{i j} x_{i j} \\ & \text { subject to } x_{i j} \geq 0, i=1, . . m, j=1, . ., k \\ & \sum_{j=1}^k x_{i j}=s_i, i=1, \ldots m \\ & \sum_{i=1}^m x_{i j}=d_j, i=1, \ldots m \\ & \end{aligned}$ (7)
It is important to keep in mind that the positions of providers and consumers can be reversed without causing any change to the overall transport cost. The total number of corresponding flows produced by each node is controlled by si and dj, also referred to as the weights of the nodes. In order to reduce the total cost of matching, EMD prioritizes the creation of the best possible match, denoted by the symbol X~, between providers and demanders. Finding a solution to the linear programming problem can allow one to attain the ideal worldwide matching flows X~. In accordance with the initial definition of EMD shown in Eq. (8), the price per unit can be calculated by determining the pairwise proximity between the embedded nodes ui and vj using the following two picture attributes:
$c_{i j}=1-\frac{u_i^T v_j}{\left\|u_i\right\|\left\|v_j\right\|}$ (8)
where, related depictions lead to lower comparing costs across nodes when we have the best matching flows X~. At this stage, we can calculate the similarity measures between picture depictions by using Eq. (9):
$s(U, V)=\sum_{i=1}^{H W} \sum_{j=1}^{H W}\left(1-c_{i j}\right) \tilde{x}_{i j}$ (9)
here, H and W stand for the attribute map's spatial measure, and C stands for the attribute dimension. Figure 6 shows the architecture of the few-shot learning model.
Figure 6. Integration of few shots learning+EMD model architecture for cyclone prediction
3.5 Model training and validation
Initially, a subset of the available tropical cyclone images is selected as the training set, containing a limited number of examples per cyclone category [26]. The training process involves extracting deep features from these images using a convolutional neural network (CNN) and then computing the EMD distances between these feature representations. These distances help establish relationships among cyclone categories in the training set. During validation, a separate subset of images, distinct from the training set, is used to assess the model's performance. The EMD distances between the query cyclones in the validation set and prototype cyclones from the training set are computed. The model's predictions are based on the nearest prototypes in EMD space. This validation process ensures that the model can accurately generalize from the training examples and make reliable predictions for new cyclones, demonstrating the efficacy of Few-shot learning and EMD for tropical cyclone prediction through image classification, even with minimal training data.
The concept of precision in statistics involves the computation of the ratio between the number of precise forecasts produced by an algorithm and the total number of forecasts made. In order to calculate the recall rate, simply divide the total number of true positives and false negatives by the number of true positives. The utilization of precision and recall metrics can provide valuable insights into the effectiveness of a given methodology and guarantee that the output conforms to predetermined specifications. Nevertheless, the task of selecting the most appropriate technique that suits the information while assessing multiple techniques trained on the same data sets is arduous when relying solely on these metrics for comparison. The significance of the F1score is paramount. The F1 score is a metric that represents the harmonic mean of the precision and recall scores. The subsequent equations, specifically Eqs. (10)-(13), represent the mathematical expressions for precision, recall, F1-score, and accuracy.
precision $=\frac{T P}{T P+F P}$ (10)
recall $=\frac{T P}{T P+F N}$ (11)
F1 - score $=\frac{2 \times { precision } \times { recall }}{ { precision }+ { recall }}$ (12)
accuracy $=\frac{T P+T N}{T P+T N+F P+F N}$ (13)
3.6 Finding the best model
In order to find the best model from five different models (LSTM, CNN and combination models CNN+LSTM, CNN+RF and the FSL+EMD), each model is evaluated with precision, recall and f1-score metrics. The best accuracy score is considered the best factor in selecting the best model for this predictive task.
3.7 Predicting the cyclone
After all the above steps are done, the best-fitting model predicts the tropical cyclone based on its severity. This severity can be of four types. They are as follows:
·Depression
·Cyclone Storm
·Severe Cyclone
·Super Cyclone Storm
We used a computer set-up with a hardware configuration of 16 GB RAM, 8-10 GB graphics, and a CPU of 24-corefor this work which is implemented in a Jupyter notebook with GPU enabled system. Python language is used for coding the few-shot learning models. TensorFlow and Keras libraries are imported to build the convolutional neural network models in python. We conducted experiments with INSAT 3D open-source dataset available in MOSDAC. In the initial implementation designed the learning model version that is entirely based on the cross-reference mechanism without EMD to check the model performance is solely driven by this mechanism. We calculate the cosine distance between each pair of vectors, and then we add the node weights produced by the cross-reference process to create a weighted sum of these distances. But the cosine technique found to be ineffective to enhance the performance in the few shot learning model scenario the intensity was varying. A blend of the cross-reference mechanism and the EMD can produce a significant performance enhancement, which again validates the benefits of using the EMD as the metric and the efficiency of the cross-reference method.
The result of simple average operation can only be slightly improved by the model variant that relies specially on the cross-reference method as an attention. The outcomes from the various machine learning build models are displayed in Table 2. Figure 7 shows the comparison of overall accuracy obtained from each model.
Table 2. The outcomes from the various machine learning build models
|
Built Machine Learning Models |
Class |
Precision |
Recall |
F1-Score |
Overall Accuracy (%) |
|
LSTM |
1 |
0.77 |
0.52 |
0.62 |
56.32 |
|
2 |
0.52 |
0.52 |
0.52 |
||
|
3 |
0.54 |
0.59 |
0.56 |
||
|
4 |
0.47 |
0.64 |
0.54 |
||
|
CNN |
1 |
0.61 |
0.46 |
0.52 |
61.56 |
|
2 |
0.72 |
0.70 |
0.71 |
||
|
3 |
0.53 |
0.61 |
0.57 |
||
|
4 |
0.47 |
0.64 |
0.54 |
||
|
CNN+ LSTM |
1 |
0.78 |
0.66 |
0.71 |
75.03 |
|
2 |
0.78 |
0.65 |
0.71 |
||
|
3 |
0.67 |
0.81 |
0.73 |
||
|
4 |
0.78 |
0.91 |
0.84 |
||
|
CNN+ RF |
1 |
0.67 |
0.51 |
0.58 |
70.35 |
|
2 |
0.72 |
0.70 |
0.71 |
||
|
3 |
0.76 |
0.81 |
0.79 |
||
|
4 |
0.60 |
0.75 |
0.67 |
||
|
FSL+ EMD (Proposed) |
1 |
0.81 |
0.86 |
0.83 |
85.81 |
|
2 |
0.87 |
0.87 |
0.86 |
||
|
3 |
0.85 |
0.87 |
0.87 |
||
|
4 |
0.91 |
0.85 |
0.88 |
We employed five distinct approaches for the designing of predictive models. We started with CNN and LSTM approaches. CNN reached an accuracy of 61.56%, whereas the LSTM approach reached a 5.26% lower overall accuracy than the CNN one. The issue with both models is that the class 4 recognization precision score was low for both cases. Although the LSTM model has a lower overall accuracy than CNN, LSTM could recognize class 1 type tropical cyclones with a precision score of 0.77. Due to this reason, we tried a hybrid model, which was generated using the fusion of CNN and LSTM methods. This particular approach reached an overall accuracy of 75.03%. This model overcame some of the weaknesses of the individual approaches. It can recognize classes 1, 2 and 4 far better than the other two models.
The precision score (0.67) for class 3 shows that this model lacks the capability of identifying class 3 a bit. We also tried another hybrid model created using CNN and the random forest technique. This CNN+RF approach showed a lower accuracy (70.35%). The precision and recall scores were lower than the CNN+LSTM hybrid method. We employed a few-shot learning-based model to overcome the accuracy and recognization issues. This model combines with EMD data for the distance measuring feature in this framework. This hybrid model reached a way higher accuracy value (85.81%) than the other four predictive models. It indicates that this is a far better model than the state-of-the-art approaches. We checked the precision, recall and F1-score of each tropical cyclone class for further analysis of the model evaluation. All four classes have a precision score in the range of [0.82,0.85], which indicates that this model is capable of recognizing all four classes of tropical cyclones. Figure 7 shows the comparative bar-chart depiction of the designed and implemented models.
Figure 7. Comparison of build ML models
Figure 8. Comparison of the latest benchmark papers with the proposed model for cyclone prediction
Training and inference of EMD-based models require more computational resources than the standard models because a linear programming issue must be addressed for every forwarding phase. But, involving EMD in the model designing significantly increases the model performance for class prediction. The hybrid model with a performance accuracy of 85.81% indicates the advantage of using EMD and a few-shot learning approach. Figure 8 displays the comparison of the latest benchmark papers with the proposed model for cyclone prediction. Compare to the latest work.
Tropical cyclone intensity is studied and predicted in this work. The work predicts storm intensity. The experimental studies use INSAT 3D satellite data and the MOSDAC web portal dataset. Registering and ordering photos is required to access cyclone information. The scholar will then receive download links. Data can be downloaded from those links. Exploratory data analysis helps extract insights from data. Data augmentation for feature extraction was followed by LSTM, CNN, CNN+LSTM, CNN+RF, and proposed FSL with EDM functionality to improve cyclone forecasting. The suggested FSL+EMD framework had 85.81% accuracy. A novel unified model of a few-shot learning and earth mover's distance algorithm predicts cyclones and compares accuracy to deep learning models. This accuracy exceeds state-of-the-art models. This can be extended to deeper distance functions, match functions, and other few-shot learning methods.
The proposed work requires diverse and representative training support. Capturing a wide range of cyclone variations makes this set difficult to build. Few-shot learning methods may also struggle with extreme cyclone categories that deviate significantly from the support set. This study suggests expanding the application beyond the Indian Ocean to improve global cyclone monitoring. Adding temporal data like cyclone movement trajectories can also improve prediction accuracy. Meta-learning and attention mechanisms can improve model performance with limited training data. Optimizations and parallel processing can also speed up EMD predictions. Finally, ensemble methods and fusion with weather satellite data and atmospheric conditions can help predict and manage cyclones holistically.
The data used in this study were obtained from the Meteorological & Oceanographic Satellite Data Archival Centre (MOSDAC).
[1] Bousquet, O., Barbary, D., Bielli, S., Kebir, S., Raynaud, L., Malardel, S., Faure, G. (2020). An evaluation of tropical cyclone forecast in the Southwest Indian Ocean basin with AROME-Indian Ocean convection-permitting numerical weather predicting system. Atmospheric Science Letters, 21(3): e950. https://doi.org/10.1002/asl.950
[2] Gayathri, R., Murty, P.L.N., Bhaskaran, P.K., Srinivasa Kumar, T. (2016). A numerical study of hypothetical storm surge and coastal inundation for AILA cyclone in the Bay of Bengal. Environmental Fluid Mechanics, 16: 429-452. https://doi.org/10.1007/s10652-015-9434-z
[3] Islam, M.T., Charlesworth, M., Aurangojeb, M., Hemstock, S., Sikder, S.K., Hassan, M.S., Dev, P.K., Hossain, M.Z. (2021). Revisiting disaster preparedness in coastal communities since 1970s in Bangladesh with an emphasis on the case of tropical cyclone Amphan in May 2020. International Journal of Disaster Risk Reduction, 58: 102175. https://doi.org/10.1016/j.ijdrr.2021.102175
[4] Lu, X.Q., Yu, H., Ying, M., Zhao, B.K., Zhang, S., Lin, L.M., Bai, L., Wan, R.J. (2021). Western North Pacific tropical cyclone database created by the China Meteorological Administration. Advances in Atmospheric Sciences, 38: 690-699. https://doi.org/10.1007/s00376-020-0211-7
[5] Hurley, J.V., Boos, W.R. (2015). A global climatology of monsoon low-pressure systems. Quarterly Journal of the Royal Meteorological Society, 141(689): 1049-1064. https://doi.org/10.1002/qj.2447
[6] Long, T., Fu, J., Tong, B., Chan, P., He, Y. (2022). Identification of tropical cyclone centre based on satellite images via deep learning techniques. International Journal of Climatology, 42(16): 10373-10386. https://doi.org/10.1002/joc.7909
[7] Mohapatra, M., Bandyopadhyay, B.K., Tyagi, A. (2012). Best track parameters of tropical cyclones over the North Indian Ocean: A review. Natural Hazards, 63: 1285-1317. https://doi.org/10.1007/s11069-011-9935-0
[8] Weaver, I.S., Williams, H.T., Arthur, R. (2021). A social Beaufort scale to detect high winds using language in social media posts. Scientific Reports, 11(1): 3647. https://doi.org/10.1038/s41598-021-82808-x
[9] Liu, Y., Lü, H., Zhang, H., Cui, Y., Xing, X. (2021). Effects of ocean eddies on the tropical storm Roanu intensity in the Bay of Bengal. Plos one, 16(3): e0247521. https://doi.org/10.1371/journal.pone.0247521
[10] Ayyappan, K., Thiruvenkatasamy, K., Arumugam, T. (2017). Impact assessment study of cyclone Vardah on Chennai, on east coast of Tamil Nadu, India. TERI Information Digest on Energy and Environment, 16(1): 13-20.
[11] Shoja, F., Khosravi, M., Shamsipour, A.A. (2020). Analyzing the synoptic conditions of Sagar and Mekunu tropical cyclones in the Arabian Sea in 2018. Scientific-Research Quarterly of Geographical Data (SEPEHR), 29(113): 93-112.
[12] Piñeros, M.F., Ritchie, E.A., Tyo, J.S. (2010). Detecting tropical cyclone genesis from remotely sensed infrared image data. IEEE Geoscience and Remote Sensing Letters, 7(4): 826-830. https://doi.org/10.1109/LGRS.2010.2048694
[13] Jaiswal, N., Kishtawal, C.M. (2010). Automatic determination of center of tropical cyclone in satellite-generated IR images. IEEE Geoscience and Remote Sensing Letters, 8(3): 460-463. https://doi.org/10.1109/LGRS.2010.2085418
[14] Fiolleau, T., Roca, R. (2013). An algorithm for the detection and tracking of tropical mesoscale convective systems using infrared images from geostationary satellite. IEEE Transactions on Geoscience and Remote Sensing, 51(7): 4302-4315. https://doi.org/10.1109/TGRS.2012.2227762
[15] Jaiswal, N., Kishtawal, C.M. (2013). Objective detection of center of tropical cyclone in remotely sensed infrared images. IEEE Journal of Selected Topics in Applied Earth Observations and Remote Sensing, 6(2): 1031-1035. https://doi.org/10.1109/JSTARS.2012.2215016
[16] Dutta, I., Banerjee, S. (2013). Elliptic fourier descriptors in the study of cyclone cloud intensity patterns. International Journal of Image Processing, 7(4): 402-417.
[17] Kar, C., Kumar, A., Konar, D., Banerjee, S. (2019). Automatic region of interest detection of tropical cyclone image by center of gravity and distance metrics. In 2019 Fifth International Conference on Image Information Processing (ICIIP), Shimla, India, pp. 141-145. https://doi.org/10.1109/ICIIP47207.2019.8985860
[18] Kim, M., Park, M.S., Im, J., Park, S., Lee, M.I. (2019). Machine learning approaches for detecting tropical cyclone formation using satellite data. Remote Sensing, 11(10): 1195. https://doi.org/10.3390/rs11101195
[19] Lian, J., Dong, P., Zhang, Y., Pan, J., Liu, K. (2020). A novel data-driven tropical cyclone track prediction model based on CNN and GRU with multi-dimensional feature selection. IEEE Access, 8: 97114-97128. https://doi.org/10.1109/ACCESS.2020.2992083
[20] Alessandrini, S., Delle Monache, L., Rozoff, C.M., Lewis, W.E. (2018). Probabilistic prediction of tropical cyclone intensity with an analog ensemble. Monthly Weather Review, 146(6): 1723-1744. https://doi.org/10.1175/MWR-D-17-0314.1
[21] Song, T., Li, Y., Meng, F., Xie, P., Xu, D. (2022). A novel deep learning model by Bigru with attention mechanism for tropical cyclone track prediction in the Northwest Pacific. Journal of Applied Meteorology and Climatology, 61(1): 3-12. https://doi.org/10.1175/JAMC-D-20-0291.1
[22] Pan, B., Xu, X., Shi, Z. (2019). Tropical cyclone intensity prediction based on recurrent neural networks. Electronics Letters, 55(7): 413-415. https://doi.org/10.1049/el.2018.8178
[23] Wu, Y., Geng, X., Liu, Z., Shi, Z. (2021). Tropical cyclone forecast using multitask deep learning framework. IEEE Geoscience and Remote Sensing Letters, 19: 1-5. https://doi.org/10.1109/LGRS.2021.3132395
[24] Zhang, C., Cai, Y.J., Lin, G.S., Shen, C.H. (2020). Deepemd: Few-shot image classification with differentiable earth mover's distance and structured classifiers. In Proceedings of the IEEE/CVF conference on computer vision and pattern recognition, Seattle, WA, USA, pp. 12203-12213. https://doi.org/10.1109/CVPR42600.2020.01222
[25] Kar, C., Banerjee, S. (2018). An image processing approach for intensity detection of tropical cyclone using feature vector analysis. International Journal of Image and Data Fusion, 9(4): 338-348. https://doi.org/10.1080/19479832.2018.1491896
[26] Dutta, I., Banerjee, S., De, M. (2013). An algorithm for pre-processing of satellite images of cyclone clouds. International Journal of Computer Applications, 78(15): 13-17.