Ayman Z. Abdulhameed*![]() | Mazin A. Ahmed
| Mazin A. Ahmed![]() | Abdulamir A. Karim
| Abdulamir A. Karim![]()
© 2023 IIETA. This article is published by IIETA and is licensed under the CC BY 4.0 license (http://creativecommons.org/licenses/by/4.0/).
OPEN ACCESS
This study employed the ETABS v16 program to design a multi-story steel building subjected to gravity load. Nine variations of bracing systems were subsequently integrated in both the X and Y planes, utilizing different types of braces such as mega-braced frames (MBFs), inverted V-bracing, and X-bracing in various locations and distribution configurations. The intention was to enhance the structural performance, gauged by parameters including maximum roof displacement, base shear, base moments, and drift ratio. To isolate the impact of bracing location and distribution pattern on seismic force resistance, the weight of the bracing at each story was held constant across all models. A non-linear time-history analysis was performed on the models in both the X and Y directions using SAP2000 V20, incorporating the El-Centro earthquake. The analyses revealed that Model 9 outperformed the others, reducing the maximum roof displacement and drift ratio in both directions by averages of 46.1% and 41%, respectively. Moreover, in relation to base shear, Model 9 demonstrated superior performance compared to the other models.
non-linear time history analysis, inverted v-bracing, SAP 2000 V 20, Mega brace frame (MBFs), X-brace
Earthquakes are ground vibrations encompassing a wide spectrum of frequencies, triggered by various phenomena such as tectonic shifts, volcanic activity, landslides, rock bursts, and human-induced explosions. Among these, tectonic-induced earthquakes are the most prevalent and impactful, resulting from the fracturing and shifting of rocks along faults within the Earth's crust [1].
In the era preceding modern engineering, traditional materials like timber, clay brick, and stone dominated architecture. However, these materials proved to be highly susceptible to damage in earthquake-prone regions. The recognition of steel's resilient behavior during several earthquakes led to its emergence as a promising structural material, especially for buildings in seismic zones. This preference was predicated on two factors: firstly, steel's inherent properties of exceptional strength and ductility—specifically, its ability to endure substantial inelastic deformation without significant loss of strength, and secondly, the successful performance of steel structures in numerous earthquakes throughout the past century, during which the principles of seismic design were entrenched [2].
In terms of strength, steel buildings have typically exhibited commendable performance during earthquakes. Yield strength and elastic stiffness—two inherent properties of steel—contribute to the elastic resistance of steel structures during moderate earthquakes. However, during more substantial seismic events, a structure may undergo inelastic deformations and rely on its ductility and hysteresis energy dissipation capacity to prevent collapse. Steel, being a ductile material equally strong in tension and compression, is superbly suited for earthquake-resistant structures. Its ductility allows the structure to experience large plastic deformations with minimal loss of strength [3].
Damage to steel buildings observed in previous earthquakes has predominantly been induced by ground movements. This includes damage to beam-to-column connections caused by severe ground motion, buckling of diagonal braces, cracking of the concrete at the column base, and yielding and fracturing of anchor bolts. Nonstructural damage was also extensive in buildings with large open sections, such as gymnasiums and industrial facilities, particularly in ceilings and claddings. Additionally, widespread damage was observed in external finishes composed of mortar over light-gauge metal lath [4].
In this study, the focus will be on the bracing system, one of the various strategies employed to enhance the seismic performance of steel buildings, alongside shear walls and dampers [5]. The concentrically braced frame is a preferred type of bracing system due to its high elastic stiffness and is extensively used as a lateral force-resisting system. This setup comprises horizontal and vertical framing elements interconnected by a diagonal brace member, with intersecting axes. The concentric brace is available in several configurations, including the X-brace, multistory X-brace, inverted V-brace, V-brace, and multibay X-brace [6].
Previous research on the bracing system has been extensive. For instance, Tafheem and Khusru [7] modeled a six-story steel building and assessed its response to wind, earthquake, dead, and live loads using various types of bracing, such as X-bracing and V-bracing with HSS bracing. They analyzed the building's lateral story displacement, story drift, axial force, and bending moment at different levels. Their study showed that X-bracing significantly reduces lateral and inter-story displacement while increasing lateral stiffness.
In their study, Di Sarno and Elnashai [8] scrutinized the seismic behavior of steel moment-resisting frames (MRFs) initially designed with inadequate lateral stiffness but later retrofitted with various bracing systems. The study's focus was on three bracing systems: buckling-restrained braces (BRBFs), special concentric braces (SCBFs), and mega-braces (MBFs). The researchers used non-linear time-history analysis to evaluate these systems' structural performance during earthquake-induced ground motions. The study found that the MBFs exhibited 70% less maximum story drift than the MRFs and about 50% less than the SCBFs. Furthermore, the quantity of steel used for structural parts and connections in the mega-brace configurations was 20% less than that in the SCBFs. This reduction could potentially lower construction costs, making the MBFs an appealing choice for seismic retrofitting applications. Consequently, the results suggest that retrofitting with MBFs can considerably enhance the seismic performance of existing MRFs while also reducing construction costs.
Nassani et al. [9] undertook a comparative study on the seismic response of steel frames featuring different types of bracing systems. The systems under investigation were X-braced frames, V-braced frames, inverted V-braced frames, knee-braced frames, and zipper-braced frames. The study employed nonlinear static and dynamic analyses to evaluate the structural response of the frames, considering parameters like capacity curve, drift ratio, global damage index, base shear, story displacements, roof displacement time history, and plastification. The findings revealed that the bracing systems significantly curtailed inter-story drifts, with an average reduction of 58% compared to unbraced frames. Moreover, the incorporation of steel braces substantially decreased the global damage index of the frames.
The objective of this research is to explore the influence of bracing distribution and forms on a building's seismic performance. This study sets itself apart from previous research by considering various patterns of bracing and distribution, while standardizing the weight of the bracing on each floor across all models.
2.1 Design by ETABS program
ETABS v16 [10] is used to design three-dimensional steel structures by the ASCE 7-16 Code [11] for live and dead loads as describe in Table 1 and the AISC 360-10 Code [12] for steel design and section selection. This building is designed for gravity loads only, with columns arranged in such a pattern that every four stories have the same section to reduce the cost of cutting and welding different sections and to reduce the number of sections used in the structure.
Table 1. Loads [11]
|
No. of Floor |
Live Load ($\frac{K n}{m^2}$) |
Super Dead Loads ($\frac{K n}{m^2}$) |
|
1st |
5 |
3 |
|
2nd-16th |
4 |
3 |
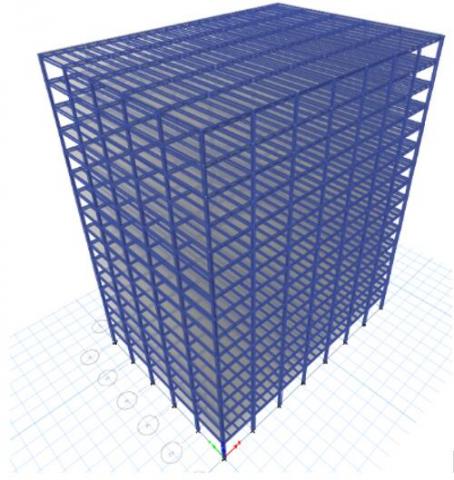
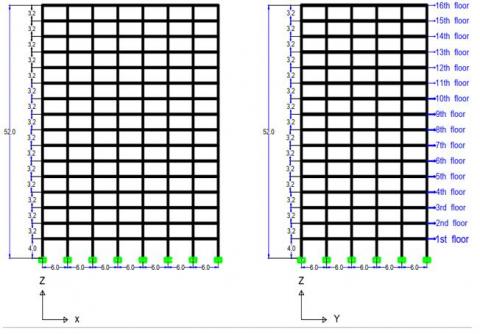
The designed building consists of 16 stories with a typical story height is 3.2 m for all floors unless the ground floor has a 4 m height, seven bays in the x-direction, and 5 bays in the y-direction; Each bay consists of a solid deck slab with a length of 6 meters and a thickness of 10 centimeters, supported by steel beams and columns. The properties of the deck slab are described in Table 2, while the properties of the steel beams and columns are described in Table 3. The types of columns and beams used are listed in Table 4. The loads on the slabs are a combination of live and super-dead loads.
Table 2. Properties of the deck slabs
|
Properties |
Value |
Unit |
|
Depth of deck slabs |
10 |
cm |
|
Unit weight |
24 |
Mpa |
|
Modulus of elasticity (E) |
24856 |
Mpa |
|
Poison’s ratio (υ) |
0.2 |
- |
|
Coefficient of thermal expansion |
0.0000099 |
- |
|
Shear modulus(G) |
10356 |
Mpa |
Table 3. Properties of steel material (A992fy50)
|
Properties |
Value |
Unit |
|
Unit weight |
77 |
$\frac{k n}{m^3}$ |
|
Modulus of elasticity (E) |
200000 |
Mpa |
|
Poison’s ratio (U) |
0.3 |
- |
|
Coefficient of thermal expansion |
0.0000117 |
- |
|
Shear modulus (G) |
76903 |
Mpa |
|
Minimum yield stress (Fy) |
345 |
Mpa |
|
Minimum tensile strength (Fu) |
448 |
Mpa |
|
Effective yield strength (Fye) |
379 |
Mpa |
|
Effective tensile strength (Fue) |
493 |
Mpa |
Table 4. Locations and types of the columns and beams in the building
|
No. of Floor |
Column |
External Beam |
Internal Beam |
Secondary Beam |
|
1-4 |
W14×176 |
W18×35 |
W16×45 |
W12×19 |
|
4-8 |
W14×120 |
|||
|
8-12 |
W14×90 |
|||
|
12-16 |
W14×61 |
Details of the designed building are described in Figure 1 for the plan view, Figure 2 for the 3D view, and Figure 3 for the side view.
Figure 1. Plan view of the building
Figure 2. 3D view of the building
Figure 3. X-Z and Y-Z Plan of the building
2.2 Arrangement of bracing
There are many types of bracing systems such as x bracing, mega braced frames (MBFs), v bracing, inverted v bracing, and eccentricity bracing. In this research, we will focus on how to find the best location for bracing that meets the cost and architectural requirements.
It is assumed that the weight of bracing is constant for all patterns and models at each story of the building. HSS bracing sections are selected at the perimeter of the building as shown in Figure 4, It has been confirmed that the weight remains the same, as per formula 1, which provides a new area resulting from changes in the Bracing length, type, or duplication of the area when two Bracing are replaced with a single one in the story(when replacing 2 x-brace by single x-brace at each story), resulting in double the area of the previous bracing that replaced by a new one. It is assumed that the inner diameter of the Bracing remains the same as the previous one, and formula 2 is used to determine the thickness of the new support that is equivalent to the previous one in weight but different by outer diameter. The weight values for all models are summarized in Table 5. The bracing is assumed to resist earthquake loads in both tension and compression to mimic real-life conditions. The material used for the bracing is ASTM A36, which has properties specified in Table 6.
Figure 4. Plan view of building with perimeter bracing system
Table 5. The sections and weight of each model
|
No. of Model |
No. of Floor |
Sections |
Weight (Kn) |
Total Weight (Kn) |
|
1 |
- |
- |
- |
- |
|
2 |
1-4 |
HSS 177.8×9.5 |
78.72 |
208.854 |
|
4-8 |
HSS 168.3×7.1 |
56.108 |
||
|
8-12 |
HSS 152×6.4 |
45.556 |
||
|
12-16 |
HSS 127×4.8 |
28.47 |
||
|
3 |
1-4 |
HSS186×13.4 |
78.86 |
208.42 |
|
4-8 |
HSS173.8×10 |
55.6 |
||
|
8-12 |
HSS157.4×9.05 |
45.52 |
||
|
12-16 |
HSS130.9×6.75 |
28.44 |
||
|
4 |
1-4 |
HSS193×17 |
78.72 |
208.854 |
|
4-8 |
HSS179.4×12.8 |
56.108 |
||
|
8-12 |
HSS162.3×11.5 |
45.556 |
||
|
12-16 |
HSS134.6×8.59 |
28.47 |
||
|
5 |
1-4 |
HSS209.3×25.2 |
78.84 |
208.96 |
|
4-8 |
HSS192×19.1 |
56.16 |
||
|
8-12 |
HSS173.6×17.2 |
45.64 |
||
|
12-16 |
HSS143.2x12.8 |
28.32 |
||
|
6 |
1-4 |
HSS193X17 |
78.72 |
208.854 |
|
4-8 |
HSS179.4x12.8 |
56.108 |
||
|
8-12 |
HSS162.3x11.5 |
45.556 |
||
|
12-16 |
HSS134.6x8.59 |
28.47 |
||
|
7 |
1-3 |
HSS193×17 |
59.04 |
208.888 |
|
4 |
HSS209.3×25.2 |
19.71 |
||
|
5-6-7 |
HSS179.4×12.8 |
42.081 |
||
|
8 |
HSS192×19.1 |
14.04 |
||
|
9-10-11 |
HSS162.3×11.5 |
34.167 |
||
|
12 |
HSS173.6×17.2 |
11.41 |
||
|
13-14-15 |
HSS134.6×8.59 |
21.36 |
||
|
16 |
HSS143.2×12.8 |
7.08 |
||
|
8 |
1-3 |
HSS 177.8×9.5 |
59.04 |
208.857 |
|
4 |
HSS193×17 |
19.68 |
||
|
5-6-7-8 |
HSS 168.3×7.1 |
56.108 |
||
|
9 |
HSS 152×6.4 |
11.389 |
||
|
10 |
HSS162.3×11.5 |
11.389 |
||
|
11-12 |
HSS 152×6.4 |
22.778 |
||
|
13-14-15 |
HSS127×4.8 |
21.355 |
||
|
16 |
HSS134.6×8.59 |
7.1184 |
||
|
9 |
1 |
HSS193×17 |
19.68 |
208.845 |
|
2-3-4 |
HSS 177.8×9.5 |
59.04 |
||
|
5-6 |
HSS 168.3×7.1 |
28.054 |
||
|
7 |
HSS179.4×12.8 |
14.027 |
||
|
8 |
HSS 168.3×7.1 |
14.027 |
||
|
9-10-11-12 |
HSS 152×6.4 |
45.544 |
||
|
13 |
HSS134.6×8.59 |
7.1184 |
||
|
14-15-16 |
HSS127×4.8 |
21.355 |
||
|
10 |
1-2-3-4 |
HSS193×17 |
78.72 |
208.854 |
|
5-6-7-8 |
HSS179.4×12.8 |
56.108 |
||
|
7-10-11-12 |
HSS162.3×11.5 |
45.556 |
||
|
13-14-15-16 |
HSS134.6×8.59 |
28.47 |
Table 6. The properties of A36
|
Properties |
Value |
Unit |
|
Unit weight |
77 |
$\frac{k n}{m^3}$ |
|
Modulus of elasticity (E) |
200000 |
Mpa |
|
Poison’s ratio (υ) |
0.3 |
- |
|
Coefficient of thermal expansion |
0.0000117 |
- |
|
Shear modulus (G) |
76903 |
Mpa |
|
Minimum yield stress (Fy) |
250 |
Mpa |
|
Minimum tensile strength (Fu) |
400 |
Mpa |
|
Effective yield strength (Fye) |
379 |
Mpa |
|
Effective tensile strength (Fue) |
493 |
Mpa |
The models used in this research in two directions are:
Two formulas have been used to make sure that the weight is the same for all patterns, the first one is to find the area of new bracing dependent on the area of x-bracing that is assumed arbitrary after many analyses, the area of bracing is small enough to avoid the failure of columns and beams under the seismic effect, the second formula is to find the outer diameter and thickness of new bracing, in the second formula, the inner diameter is assumed to be the same in all cases (x-bracing, double x-bracing, inverted v-bracing, and double inverted v-bracing) and the change will be in the thickness and outer diameter to find a new section.
$A_{\text {new } \text { bracing }}$=$A_{\text {reference } \text { brace }} * \frac{L_{\text {reference }}}{L_{\text {new }}}$ (1)
For example, when the x-brace is replaced by an inverted v-bracing the Lnew will be the length of inverted v-brace.
$\begin{aligned} & A_{\text {new } \text { bracing }}=\frac{\pi}{4}\left(D_{\text {outer }}{ }^2-D_{\text {inner }}{ }^2\right) \\ & A_{\text {new } \text { bracing }}=\frac{\pi}{4}\left(\left(D_{\text {inner }}+2 t\right)^2-D_{\text {inner }}{ }^2\right) \\ & \mathrm{t}=\frac{\sqrt{\left(\frac{4}{\pi} * A_{\text {new bracing} }\right)+D_{\text {inner }}{ }^2}-D_{\text {inner }}}{2} \\ & \end{aligned}$(2)
After finding the thickness of the brace, the outer diameter (Douter) can be found by the formula:
$D_{\text {outer }}=D_{\text {inner }}+2 \mathrm{t}$
For example, how the formulas have been used, the area of x-bracing assumed in the second model was ($A_{\text {brace reference }}$=0.0047m2) for stories 1-4 and the outer diameter (Douter=0.1778 m) so Dinner=0.1778-2*0.0095=0.1588 m (constant), if we need to find the sections of double x-bracing(one X-bracing at each story instead of two X-bracing) the (Anew bracing=2*0.0047=0.0094 m2) and Dinner is the same.
So
$\mathrm{t}=\frac{\sqrt{\left(\frac{4}{\pi} * 0.0094\right)+0.1588^2}-0.1588}{2}=0.017 \mathrm{m}=17 \mathrm{mm}$
Douter=0.1588+2*0.017=0.193 m=193 mm
Therefore, the section would be HSS 193×17.
For inverted v- bracing or double inverted v- bracing we need to find the length of inverted v-bracing by phitagors theory or by angel formulas like Sin (x) and Cos (x) formulas by knowing the half-length of the bay and the floor height, for example, by phitagors:
$\begin{gathered}L_{\text {new }}=\sqrt{\left(\frac{6}{2}\right)^2+(3.2)^2}=4.386 \mathrm{~m} \\ A_{\text {new } \text { bracing }}=0.0047 * \frac{6.8}{4.386}=0.0073 \mathrm{~m} \\ \mathrm{t}=\frac{\sqrt{\left(\frac{4}{\pi} * 0.0073\right)+0.1588^2}-0.1588}{2}=0.0134 \mathrm{m}=13.4 \mathrm{~mm} \\ D_{\text {outer }}=0.1588+2 * 0.0134=0.186=186 \mathrm{~mm}\end{gathered}$
The section is HSS 186×13.4
Table 6 provides details on the weight and sections used for each model. From Table 6 it is concluded that the weight is almost the same in all models.
2.3 Models
Model 1: Building without bracing.
|
x-direction |
y-direction |
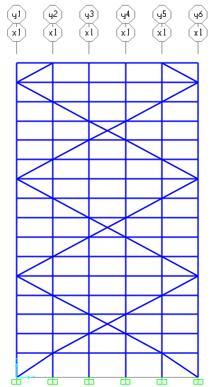
Model 2: X-bracing at the corner.
|
x-direction |
y-direction |
Model 3: Inverted V-bracing at the corner.
|
x-direction |
y-direction |
Model 4: X-bracing at the centere.
|
x-direction |
y-direction |
Model 5: Inverted v bracing at the center.
|
x-direction |
y-direction |
Model 6: Mega X-bracing.
|
x-direction |
y-direction |
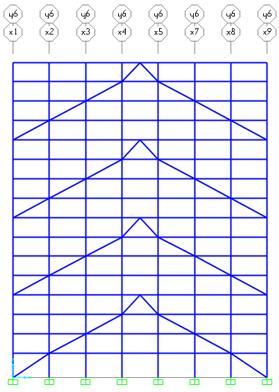
Model 7: Mega-inverted V-bracing.
|
x-direction |
y-direction |
Model 8: Mega x-pattern with X-bracing in each Bayes.
|
x-direction |
y-direction |
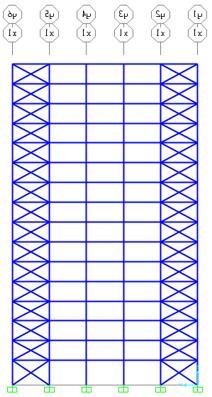
Model 9: Mega X-bracing with a diamond pattern.
|
x-direction |
y-direction |
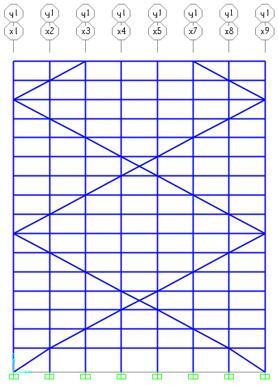
Model 10: Mega diamond pattern.
|
x-direction |
y-direction |
3.1 Effective seismic weight
According to (ASCE 7-16), the load considered in the seismic analysis is defined as a mass, equal to all dead load (including self-weight) above the building's foundation plus 25% of the live load (dead load+0.25*live load) [11].
3.2 Free vibration analysis
The established methods of mechanics are used to perform an undamped free-vibration analysis of the entire building. This analysis utilizes the appropriate masses and elastic stiffness of the structural system to determine the natural periods (Tn) and mode shapes (ɸ) of the relevant vibration modes that must be considered [13].
The research employs free-vibration analysis to determine the natural periods (Tn) for the first and second modes of each model. Tn has various applications; firstly, it can be used to identify whether a building is rigid or flexible, where a small Tn indicates a rigid building and a large Tn indicates a flexible building. Secondly, in non-linear time history analysis, it is necessary to determine the first and second natural periods for each model.
The results of free-vibration analysis by SAP 2000 v20 are summarized in Table 7.
Table 7. Free vibration result
|
Number of Model |
First Period (T1) (sec) |
Second Period (T2) (sec) |
|
1 |
3.871 |
3.792 |
|
2 |
2.861 |
2.821 |
|
3 |
2.836 |
2.797 |
|
4 |
3.127 |
3.075 |
|
5 |
3.083 |
3.033 |
|
6 |
2.338 |
2.285 |
|
7 |
2.36 |
2.29 |
|
8 |
2.356 |
2.283 |
|
9 |
2.208 |
2.13 |
|
10 |
2.229 |
2.147 |
3.3 Non-linear time history analysis by SAP 2000 v20
Non-linear time history analysis by program sap2000 v20 is used to investigate the response of steel structures under the El-Centro earthquake with a duration of 12.1 sec and time step equal to 0.02 sec, with a damping ratio equal to 0.02 for steel structure [14].
The most intricate method for the dynamic analysis of buildings is the Time History Analysis (THA) technique. This approach involves subjecting the mathematical model of the building to accelerations from earthquake records that simulate the anticipated earthquake at the base of the structure. The technique involves a sequential direct integration over a time period and can be used for both elastic and inelastic analysis. However, in the case of inelastic analysis, the stiffness is presumed to be constant only during each incremental time [13].
There are many parameters to compare between different models such as max roof displacement, max inter-story drift ratio, max base shear, and max base bending moment.
3.3.1 Maximum roof displacement
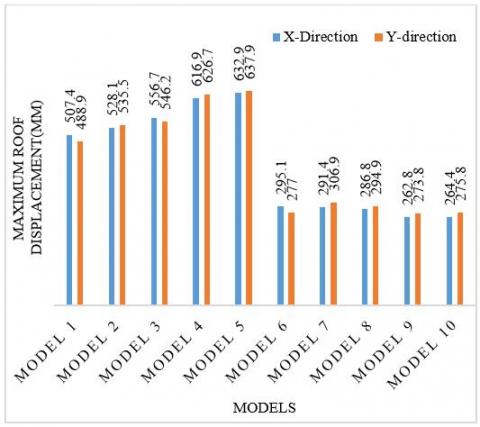
In the x-direction, a non-linear time history analysis of a sixteen-story steel building indicates that the maximum roof displacement of Model 1 (without bracing) is exceeded by Model 2, Model 3, Model 4, and Model 5 by 4.08%, 9.7%, 21.6%, and 24.73%, respectively. Conversely, for Model 6, Model 7, Model 8, Model 9, and Model 10, the roof displacements are less than Model 1 by 41.84%, 42.57%, 43.48%, 48.2%, and 47.9%, respectively.
In the Y-direction, the maximum roof displacement for Model 1 is surpassed by Model 2, Model 3, Model 4, and Model 5 by 9.5%, 11.72%, 28.2%, and 30.5%, respectively. Conversely, for Model 6, Model 7, Model 8, Model 9, and Model 10, the roof displacements are less than Model 1 by 43.34%, 37.22%, 39.7%, 44%, and 43.6%, respectively. These results suggest that Model 9 and Model 10 perform better in improving the steel building's performance than the other models. Table 8 and Figure 5 show the results of maximum roof displacement.
Table 8. Maximum roof displacement
|
Number of Model |
Max-Roof Displacement X-Direction(mm) |
Max-Roof Displacement Y-Direction(mm) |
|
1 |
507.4 |
488.9 |
|
2 |
528.1 |
535.5 |
|
3 |
556.7 |
546.2 |
|
4 |
616.92 |
626.7 |
|
5 |
632.9 |
637.9 |
|
6 |
295.1 |
277 |
|
7 |
291.4 |
306.9 |
|
8 |
286.8 |
294.9 |
|
9 |
262.8 |
273.8 |
|
10 |
264.4 |
275.8 |
Figure 5. Max. roof displacement
3.3.2 Max-inter story drift ratio
The drift ratio is the ratio of the horizontal displacement at vertically aligned points between the top and bottom of a story, divided by the story height [11].
During an earthquake, a base shear force is generated at the base of a building. This force is distributed in the vertical direction at each level, taking into account the weight and height of each story in relation to the other stories. The shear force is then transferred to story shear at each story, which causes displacement in each story. The amount of displacement is dependent on the stiffness of the element designed to withstand seismic forces [11].
According to ASCE 7-16 there is a limit for drift ratio depending on the risk category of the building describe in Table 9.
Table 9. Allowable drift [11]
|
Structure |
Risk Category |
||
|
I or II |
III |
IV |
|
|
Structures, other than masonry shear wall structures, four stories or less above the base as defined in Section 11.2, with interior walls, partitions, ceilings, and exterior wall systems that have been designed to accommodate the story drifts |
0.025 hsx |
0.020 hsx |
0.015 hsx |
|
Masonry cantilever shear wall structures |
0.01 hsx |
0.01 hsx |
0.01 hsx |
|
Other masonry shear wall structures |
0.007 hsx |
0.007 hsx |
0.007 hsx |
|
All other structures |
0.02 hsx |
0.015 hsx |
0.01 hsx |
*hsx is the story height below level x
For this research, the risk category of the building is assumed to be IV.
In this research, the maximum inter-story drift ratio (max IDR) was determined by calculating the drift ratio of each story every 0.02 seconds during the earthquake duration. The maximum drift ratio was then selected from among the other drift ratios recorded during the entire duration of the earthquake.
The results of the analysis for ten models in two directions are summarized as follows:
In the Y-direction, as described in Figure 6 and Figure 7 maximum inter-story drift ratio increases in Model 2, Model 3, Model 4, and Model 5 concerning Model 1 by 10.2%, 20.47%, 30.77%, and 36.25% respectively, while for Model 6, Model 7, Model 8, Model 9 and Model 10 the maximum inter-story drift decreases by 34%, 35.5%, 34.54%, 41.15%, and 39% respectively.
Figure 6. Max. drift ratio in Y-direction
In the X-direction, as described in Figure 8 and Figure 9 maximum inter-story drift ratio increased in Model 2, Model 3, Model 4, and Model 5 concerning Model 1 by 6.76%, 15.56%, 24.1%, and 31.2% respectively, while for Model 6, Model 7, Model 8, Model 9 and Model 10 the maximum inter-story drift decreases by 35.07%, 35.21%, 37.25%, 44.01%, and 43.73%, respectively.
Figure 7. Max. drift ratio in Y-direction
Figure 8. Max. drift ratio in X-direction
Figure 9. Max. drift ratio in X-direction
Based on the results, it appears that Model 9 outperforms the other models in terms of improving performance. Specifically, it reduces the maximum inter-story drift by 41.15% for the Y-direction and 44.01% for the X-direction, which is within the code limit as indicated in Table 9.
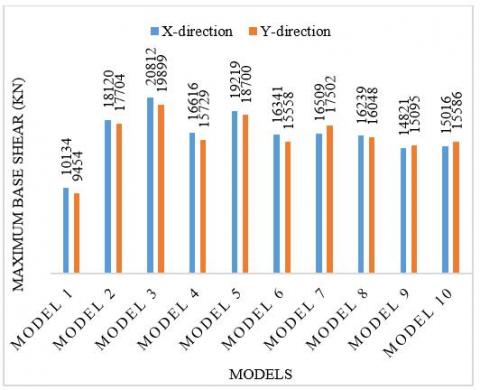
3.3.3 Maximum base shear and maximum base moments
It is the maximum lateral force that acts at the level at which the horizontal seismic ground motion is considered to be transported to the structure [11].
Figure 10. Maximum base shear (KN)
Figure 11. Maximum base moment (KN.m)
The results of the analysis as described in Figure 10 for maximum base shear and Figure 11 for maximum base moments show that Model 9 has the minimum value for max base shear and max base moments in the X-direction and y-direction concerning other models. And the maximum base shear at Model 3 and Model 5 is the worst, so the best model among the nine suggested models is Model 9 because it has the minimum base shear to reduce possible damage to the structure.
During the occurrence of an earthquake, the acceleration of the earthquake is transformed into a shearing force that affects the base of the structure. By using relationships from the Pseudo-acceleration, principle as mentioned below we can conclude some facts from the analysis [14].
$V_{\text {peak }}=\stackrel{\mathrm{A}}{g} * W$ (3)
$\mathrm{A}=\left(\frac{2 \pi}{T_n}\right)^2 * \mathrm{D}$ (4)
$T_n=2 \pi * \sqrt{\frac{m}{k}}$ (5)
By adding bracing to the structure, the natural period of the structure is reduced. This indicates that the structure becomes more rigid, and the stiffness increases as well. According to formula (5), the acceleration at the base will increase when the natural period (Tn) is reduced, as per formula (4). This results in a greater base shear than the case without bracing.
4.1 Conclusion
This study evaluated a variety of bracing models within buildings and yielded the following findings:
1) Distributing the bracing perpendicular to identical bays or at the center of the building facade with double the area resulted in suboptimal responses and outcomes.
2) Dispersing the bracing across different bays as mega X-bracing or mega inverted V-bracing enhanced the building's performance concerning maximum roof displacement and inter-story drift ratio.
3) Model 9 surpassed the other models in terms of maximum roof displacement, inter-story drift ratio, maximum base shear, and maximum base moment. It achieved a 48.2% reduction in maximum roof displacement in the X direction, and a 44.3% reduction in the Y direction. Moreover, it reduced the maximum inter-story drift by 44.01% in the X direction, and by 41.15% in the Y direction. Furthermore, Model 9 exhibited lower maximum base shear force and base moments compared to the other models. However, Model 10 was deemed preferable for architectural considerations. The study suggests that Mega Brace Frame Systems (MBFs) offer a promising avenue to enhance both the safety and aesthetics of buildings in earthquake-prone areas.
4.2 Limitations
This research was subject to several significant limitations, including:
1) The use of a single-building model.
2) The implementation of certain forms of the bracing system.
3) The omission of modeling the soil effect beneath the structure.
4.3 Future directions
Recommended future research opportunities in this area include:
1) Utilizing alternative analysis programs such as ANSYS or ABAQUS and comparing the results.
2) Future work will involve modeling the soil beneath the building and investigating how the soil type affects the structural response. Additionally, the study will explore how soil modeling influences the implementation of a bracing system.
3) Future studies will incorporate different earthquake resistance systems, such as Knee bracing, buckling restrained brace (BRB), zipper brace, or dampers, using the same distribution as the current system. The results will be compared to ascertain their efficacy in providing seismic resistance.
|
E |
modulus of elasticity, Mpa |
|
G |
shear modulus, Mpa |
|
Fy |
yield stress, Mpa |
|
Fu |
tensile strength, Mpa |
|
Anew bracing |
area of the replacement brace required to substitute for the reference bracing |
|
Abrace reference |
area of the brace in the model to be replaced |
|
Lreference |
length of the reference brace, m |
|
Lnew |
length of the new brace, m |
|
t |
the thickness of a new brace, mm |
|
Dinner |
the inner diameter of a brace, mm |
|
Douter |
the outer diameter of the brace, mm |
|
hsx |
the story height below level x, m |
|
HSS |
hollow structural section |
|
Vpeak |
peak base shear, KN |
|
A |
acceleration, m/sec2 |
|
W |
weight of the structure, KN |
|
Tn |
the natural period of the structure, sec |
|
m |
mass of the structure, ton |
|
K |
stiffness of the structure, KN. m |
|
Greek symbols |
|
|
υ |
poison’s ratio |
|
ɸ |
mode shape |
[1] Chen, W.F., Lui, E.M. (2005). Earthquake Engineering for Structural Design. CRC Press. http://doi.org/10.1201/9781420037142
[2] Gioncu, V., Mazzolani, F. (2013). Seismic Design of Steel Structures. CRC Press. http://doi.org/10.1201/b16053
[3] Duggal, S.K. (2007). Earthquake Resistant Design of Structures. New Delhi: Oxford University Press.
[4] Midorikawa, M., Okazaki, T. (2012). Earthquake and tsunami damage to steel structures. Structures Congress. 2012. http://doi.org/10.1061/9780784412367.093
[5] Alataby, E.K., Kadhim, J.A., Ahmed, M.A. (2021). Study on the effect of distribution of viscous damper for steel frame structure. Journal of Physics: Conference Series, 1973(1). http://doi.org/10.1088/1742-6596/1973/1/012220
[6] Tamboli, A. (2010). Handbook of Structural Steel Connection Design and Details. McGraw-Hill Education.
[7] Tafheem, Z., Khusru, S. (2019). Structural behavior of steel building with concentric and eccentric bracing: A comparative study. International Journal of Civil & Structural Engineering, 5(2): 56-63.
[8] Di Sarno, L., Elnashai, A.S. (2009). Bracing systems for seismic retrofitting of steel frames. Journal of Constructional Steel Research, 65(2): 452-465. http://doi.org/10.1016/j.jcsr.2008.02.013
[9] Nassani, D.E., Hussein, A.K., Mohammed, A.H. (2017). Comparative response assessment of steel frames with different bracing systems under seismic effect. Structures, 11: 229-242. http://doi.org/10.1016/j.istruc.2017.06.006
[10] CSI. (2015). Analysis reference manual for sap2000, ETABS, SAFE and CSI Bridge. Computers and Structures, Inc., Berkeley, CA, USA.
[11] American Society of Civil Engineers. (2017). Minimum design loads and associated criteria for buildings and other structures. American Society of Civil Engineers. http://doi.org/10.1061/9780784414248.err
[12] Ansi, B. (2016). AISC 360-16, specification for structural steel buildings. Chicago AISC.
[13] Chopra, A.K. (2014). Dynamics of Structures Theory and Applications to Earthquake Engineering. Prentice Hall.
[14] Chowdhury, I., Dasgupta, S.P. (2009). Dynamics of Structure and Foundation-a Unified Approach: 2. Application. CRC Press. http://doi.org/10.1201/9781439832721