Timothy Kayode Samson*![]() | Christian Elendu Onwukwe
| Christian Elendu Onwukwe![]() | Adedoyin Isola Lawal
| Adedoyin Isola Lawal![]()
© 2023 IIETA. This article is published by IIETA and is licensed under the CC BY 4.0 license (http://creativecommons.org/licenses/by/4.0/).
OPEN ACCESS
With escalating public interest in the cryptocurrency market, largely driven by its perceived potential for rapid wealth accumulation and various advantages over traditional currencies, there is an imperative to understand its inherent volatility. This study addresses the dynamic behaviour of cryptocurrencies by utilizing skewed error innovation distributions to model the volatility of five key cryptocurrencies. Data was sourced from Yahoo Finance, encompassing daily closing prices from September 11, 2017, to April 8, 2022. The significance of the skewness parameter in all optimal volatility models (p<.05) substantiates the application of skewed error innovation distributions. Notably, the observed influence of past negative events on volatility was consistently greater than that of positive events across most examined cryptocurrencies. While Value at Risk (VaR) models are frequently used for risk measurement in this domain, this study's findings suggest that their reliability is not universal across all cryptocurrency cases. Consequently, caution is advised when employing VaR models for risk assessment associated with cryptocurrencies.
cryptocurrencies, distribution, GARCH, volatility
Cryptocurrency, a decentralized digital currency, functions as a peer-to-peer exchange medium predicated on blockchain technology [1]. Serving as a financial asset, it facilitates the purchase of goods and services independently of financial institutions, often at a lower transaction cost compared to traditional payment methods. Cryptocurrency transcends national borders, becoming a prevalent medium for everyday payments, speculation, non-expensive cross-border money transfers, and other monetary applications [2].
The advent of cryptocurrencies has significantly increased access to financial services [3], enhanced financial inclusion, improved fund traceability, and reduced poverty, particularly in developing countries [4]. Another salient feature of cryptocurrency is its immunity to government control and geographic restrictions, facilitating global trade without the need for intermediary institutions [5].
The genesis of cryptocurrencies and blockchain technology dates back to 2008, with the introduction of Bitcoin by the pseudonymous Satoshi Nakamoto. Following the establishment and successful transactions of Bitcoin, other cryptocurrencies emerged, totaling over 18,000 by March 2022. Cryptocurrencies have since become mainstream, attracting extraordinary global attention [6] and serving as a new arena for speculators [2]. They have achieved significant global proliferation [7], evolving from speculative trading to a store of value and a means of payment [8, 9].
Public interest in the cryptocurrency market has surged over the past five years, with its market capitalization escalating from $100 billion in June 2017 to \$1.85 trillion by April 30, 2022. This surge is arguably attributable to the perceived advantages of digital currencies over traditional payment methods, encompassing aspects such as high liquidity, high returns, anonymity, and lower transaction costs [10]. The public perception of cryptocurrencies as a rapid wealth generation tool has likely further fueled interest.
Despite these strengths, cryptocurrencies are notoriously volatile, exhibiting larger price jumps and shocks than traditional currencies, rendering them a high-risk investment. This instability could stem from the absence of government control. For example, Bitcoin, valued at over \$64,000 in early 2021, plummeted to \$20,331.28 by September 2022, representing a 68.23% drop in value. This downward trend applies to many other cryptocurrencies, resulting in substantial losses for investors. Consequently, reliable volatility estimates are crucial for risk management and optimal decision-making, which is the primary focus of this study. Volatility, a measure of price variation over time, is a key index for understanding asset risk characteristics, risk management, derivative pricing, and other financial activities. It is often viewed as the cornerstone around which financial markets revolve [11].
Cryptocurrency volatility has piqued the interest of researchers, leading to numerous empirical studies utilizing various volatility models. For instance, Naimy et al. [11] examined the predictive aptitude of GARCH-type models in estimating the volatility of six cryptocurrencies and six global currencies. This research evaluated seven volatility model variants (S-GARCH, EGARCH, GJR-GARCH, APARCH, TGARCH, and CGARCH) under the distributional assumptions of Student-t, Generalized error, and Normal distribution. Although this study estimated the volatility of these digital currencies relative to global currencies to a certain extent, it did not consider any skewed versions of these innovation distributions (Skewed Student-t-distribution, Skewed Generalized error distribution, and Skewed Normal distribution).
Similarly, Yan et al. [12] investigated the impact of COVID-19 on the GARCH and DCC values of 10 cryptocurrencies from 2017 to 2022. Their study focused on GARCH (1,1) and DCC (1,1) models under the Normal distributional assumption for innovation. The research identified volatility clustering in the returns of all selected cryptocurrencies and a strong correlation between the return indices of these cryptocurrencies.
Moreover, Ngunyi et al. [13] employed the GARCH family of models to examine Bitcoin's return volatility with empirical data spanning January 1, 2014, to August 16, 2019. They considered three GARCH model variants (sGARCH, iGARCH, and tGARCH) under three error innovation distribution assumptions (Student-t, Generalized error distribution, and Normal inverse Gaussian (NIG) distributions). The tGARCH-NIG model was found to outperform the other considered GARCH model variants. Additionally, Bergsli et al. [2] explored the pricing of cryptocurrency options, primarily focusing on Bitcoin using a Stochastic Volatility with a Correlated Jump (SVCJ) model.
Recognizing the increasing attention towards cryptocurrencies, Gyamerah [14] modeled the volatility of Bitcoin returns using GARCH models while Ngunyi et al. [13] applied GARCH models to the eight largest cryptocurrencies based on market capitalization, using daily closing price data from August 7, 2015, to August 1, 2018. The cryptocurrencies examined were Ethereum, Bitcoin, Litecoin, Ripple, Moreno, Dash, Stellar, and NEM. Their findings suggested that asymmetric GARCH models with heavy-tailed innovation distributions performed better than other volatility models for all cryptocurrencies. Specifically, the IGARCH model demonstrated superior performance for both in-sample and out-of-sample data compared to other GARCH-type models (GARCH, APARCH, TGARCH, and CGARCH). Notably, many of these studies on cryptocurrency volatility did not consider skewed error innovation distributions.
Sami [15] applied non-parametric GARCH models to the volatility modeling of Bitcoin, demonstrating that these alternative GARCH models outperformed traditional GARCH models based on out-of-sample forecasts. Although this study was innovative in its approach, it did not consider advanced error innovation distributions, instead utilizing conventional normal and student-t distributions without a skewness parameter to account for the stylized properties of cryptocurrency. This highlights the identified research gap in the application of error innovations with a skewness parameter.
In another study, Cheikh et al. [16] explored asymmetric volatility in cryptocurrency markets using a Smooth Transition GARCH (ST-GARCH) model, with empirical evidence from four cryptocurrencies (Bitcoin, Ethereum, Ripple, and Litecoin). The research demonstrated the impact of positive and negative shocks, a critical aspect in the volatility analysis of digital currencies. However, the study did not focus on the flexibility of the error innovation, which is the primary focus of the present study.
Panagiotidis et al. [17] examined cryptocurrency volatility using GARCH models and found evidence of a leverage effect in most of the analyzed cryptocurrencies. Their study concluded that the MS GRACH models outperformed the traditional GARCH models. While this contribution is substantial, it's worth noting that the performance of these volatility models depends on the robustness of the error innovation distribution used. This is one of the principal distinctions between this academic study and the current research.
The asymmetric volatility of cryptocurrencies was also investigated by Panagiotidis et al. [17], which found that positive shocks tended to increase volatility more than negative shocks of the same magnitude. Not only will the current study examine the leverage effect of these currencies as done by Baur and Dimpf [18], but it will also evaluate the performance of these digital currencies across various error innovation distributions.
Ghorbel and Jeribi [19] explored the relationship between the volatilities of five cryptocurrencies and other financial assets, finding evidence of a higher volatility spillover between cryptocurrencies and financial assets. However, the current study focuses solely on cryptocurrencies and their volatility behavior, not on their relationship with other financial assets, marking a clear distinction from the aforementioned study.
The motivation for this study is based on several stylized facts of cryptocurrencies, such as extreme price jumps, clustering, and heavy tails, which error innovations without skewness parameters fail to account for. This necessitates an examination of volatility behavior using innovation distributions with skewness parameters. Literature reviews on financial time series have indicated that GARCH models incorporating skewed distributions of innovation, which account for skewness, kurtosis, and heavy tails, are excellent tools for modeling volatility [20]. The performance of volatility models depends on the robustness of the error innovation distribution used [21]. While this has been demonstrated with other financial series, not much work has been done in the context of cryptocurrency, possibly due to the still evolving nature of crypto markets.
The downward trend in the daily closing prices of these currencies, especially in 2022, further underscores the need to explore more robust error innovations in estimating the risk associated with investing in this notoriously volatile sector. This study is crucial because a reliable estimate of volatility is critical for risk management and optimal decision-making, which can help reduce the substantial losses incurred by investors in the crypto market due to an inability to accurately estimate volatility patterns.
Hence, the primary motivation for this study is to model the volatility of five cryptocurrencies (Binance coin, Bitcoin, Ethereum, Tether, and USD coin) using three skewed error innovation distributions (skewed normal, skewed student-t, and skewed generalized error innovation distributions). The use of these skewed error innovations, which have not been widely used in modeling cryptocurrency volatility despite its infamous volatility behavior, will provide more reliable insights and risk estimates for investors and prospective investors, aiding in optimal investment decision-making.
The findings from this study have revealed the volatility characteristics of each of the selected cryptocurrencies. Binance coin reported the highest mean returns compared with other cryptocurrencies, while Tether returns were more positively skewed than those of Binance coin, Bitcoin, Ethereum, and USD coin. The leverage effect was significant for all cryptocurrencies except Ethereum, where the effect was not significant, implying that positive returns increased volatility more than negative returns. This was more pronounced with Tether than with Binance coin and Bitcoin. For USD coin, negative returns were found to increase volatility more than positive returns, while for Ethereum, the impact of negative and positive returns did not significantly affect volatility. This suggests that investors should anticipate higher risk (volatility) on days with positive returns for Tether, Binance coin, and Bitcoin, and on days with negative returns for USD coin. Additional findings are presented in the results section.
This section presents model specification for GARCH, GJR. EGARCH and APARCH model used in the study. All the volatility models considered in this study, the condition mean equation is expressed in the form:
${{r}_{t}}=\mu +{{\varepsilon }_{t}}$, ${{\varepsilon }_{t}}={{\psi }_{t}}z{}_{t}$ (1)
where, rt is the daily returns, μ is the mean of the returns and εt is the residuals.
Generalized Autoregressive Conditional Heteroscedasticity [GARCH) (p, q)]
${{\psi }_{t}}^{2}=\omega +\sum\limits_{i=1}^{p}{{{\alpha }_{i}}\varepsilon _{t-i}^{2}}+\sum\limits_{j=1}^{q}{{{\beta }_{j}}\psi _{t-j}^{2}}$ (2)
where, $\psi_t^2$ is the conditional variance, ω=constant tern, αi is the ARCH term and βj is the GARCH term, p is the order of ARCH and p is the order of GARCH. ω>0, αi≥0, i=1, …, p-1, βj≥0, j=1, …, q-1.
For GARCH (1,1), p=1, and q=1,
${{\psi }_{t}}^{2}=\omega +{{\beta }_{1}}\psi _{t-1}^{2}+{{\alpha }_{i}}\varepsilon _{t-1}^{2}$ (3)
GJR- Generalized Autoregressive Conditional Heteroscedasticity [GJR-GARCH (p, q)]
${{\psi }_{t}}^{2}=\omega +\sum\limits_{i=1}^{p}{{{\alpha }_{i}}\left( \left( \left| {{\varepsilon }_{t-1}} \right| \right)-{{\gamma }_{i}}{{\varepsilon }_{t-1}} \right)}+\sum\limits_{i=1}^{q}{{{\beta }_{j}}{{\psi }_{t}}^{2}}$ (4)
If p=1, and q=1, we have, GJR-GARCH (1,1).
${{\psi }_{t}}^{2}=\omega +\alpha \left( \left( \left| {{\varepsilon }_{t-1}} \right| \right)-\gamma {{\varepsilon }_{t-1}} \right)+\beta {{\psi }_{t}}^{2}$ (5)
Asymmetric Power Autoregressive Conditional Heteroscedasticity [APARCH (p, q)]
${{\psi }_{t}}^{\delta }=\omega +{{\left( \sum\limits_{i=1}^{p}{{{\alpha }_{i}}\left( \left| {{\varepsilon }_{t-i}} \right| \right)-{{\lambda }_{i}}{{\varepsilon }_{t-i}}} \right)}^{\delta }}+{{\sum\limits_{j=1}^{q}{{{\beta }_{j}}\left( \psi _{t-j}^{2} \right)}}^{\delta }}$ (6)
where, ω>0, αi≥0, i=1, …, p-1, βj≥0, j=1, …, q-1. If p=1, λi is the leverage effect.
For APARCH (1,1):
${{\psi }_{t}}^{\delta }=\omega +\alpha {{\left( \left( \left| {{\varepsilon }_{t-1}} \right| \right)-\lambda {{\varepsilon }_{t-1}} \right)}^{\delta }}+\beta \psi _{t-1}^{2}$ (7)
Exponential Generalized Autoregressive Conditional Heteroscedasticity (EGARCH) model
$\begin{align} & \ln (\psi _{t}^{2})=\omega +\sum\limits_{j}^{q}{{{\beta }_{j}}}\ln (\psi _{t-j}^{2}) & +\sum\limits_{i=1}^{p}{{{\alpha }_{i}}}\left[ \lambda {{\varepsilon }_{t-i}}+\gamma \left\{ \left. \left| \left. {{\varepsilon }_{t-i}} \right|-\sqrt{\frac{2}{\pi }} \right. \right\} \right.\right] \end{align}$ (8)
where, ω is constant term, αi is ARCH term while βj is the GARCH term and, γ is the leverage term and $\psi_t^2$ is the volatility.
Distribution of error innovation
The following error innovations were considered in the paper.
Skewed normal
$f({{z}_{t}})=\frac{1}{\psi \pi }{{e}^{-\frac{{{({{z}_{t}}-\varepsilon )}^{2}}}{2{{\psi }^{2}}}}}\int_{-\infty }^{\alpha }{\frac{{{z}_{t}}-\varepsilon }{\psi }{{e}^{-\frac{{{t}^{2}}}{2}}}}dt,$ $-\infty <{{z}_{t}}<\infty $ (9)
where, ε is the location and ψ is the scale and α denotes the shape parameter.
Skewed student t-distribution
$f\left(z_t, \mu, \sigma, \rho, \lambda\right)=\left\{\begin{array}{l}b c\left[1+\frac{1}{\rho-2}\left(\frac{b\left(\frac{z_t-\mu}{\sigma}\right)+a}{1-\lambda}\right)^2\right]^{\frac{\rho+1}{2}}, z_t<-\frac{a}{b} \\ b c\left[1+\frac{1}{\rho-2}\left(\frac{b\left(\frac{z_t-\mu}{\sigma}\right)+a}{1+\lambda}\right)^2\right]^{\frac{\rho+1}{2}}, z_t \geq-\frac{a}{b}\end{array}\right.$ (10)
where, ρ is the shape parameter with 2<ρ<∞ and λ is the skewness parameters with -1<λ<1, μ and σ2 are the mean and variance of the skewed student t-distribution.
Skewed Generalized Error Distribution (SGED)
$\begin{align} & f({{z}_{t}}/\rho ,\varepsilon ,\theta ,\delta ) & =\frac{\rho }{2\theta \Gamma \left( \frac{1}{\rho } \right)}\exp \left[ -\frac{{{\left| {{z}_{t}}-\delta \right|}^{\rho }}}{{{\left[ 1+sign({{z}_{t}}-\delta )\varepsilon \right]}^{\rho }}{{\theta }^{\rho }}} \right] \\\end{align}$
$\rho >0,$ $\theta >0,$ $-1<\varepsilon <1$, $-\infty <{{z}_{t}}<\infty $ (11)
Model estimation and model selection criteria
Results were generated using the rugarch package in R package and the selection of best models were based Loglikelihood, Akaike Information Criteria (AIC) and Root Mean Square Error (RMSE) defined as:
$AIC=\frac{2k-2\ln \left( LL \right)}{n}$ (12)
where, LL is the log likelihood, n and m are the number of observations and number of parameters respectively.
$RMSE=\sqrt{\frac{1}{n-1}\sum\limits_{t=2}^{n}{{{\left( \hat{\psi }_{t}^{2}-\psi _{t}^{2} \right)}^{2}}}}$ (13)
where, n is the number of observation and $\hat{\psi}_t^2$ and $\psi_t^2$ are the estimated and actual volatility of the cryptocurrencies.
Distribution with least RMSE and AIC was adjudged as the best among the competing models. The forecasting performance of these models were based on 70 days out of sample volatility data (1/29/2022 to 4/8/2022).
Value at risk estimation
Value at Risk denoted as VaR is a very important measure of risk and it represents the maximum loss obtained with given confidence level [14, 15]. The VaR forecast for GARCH family of models makes use of both one-day ahead conditional mean and conditional variance $\left(\psi_{t+1}^2\right)$ of the volatility models [14]. The Value of Risk is expresses as:
$Va{{R}_{t+1}}\left( \alpha \right)={{\mu }_{t+1}}+{{F}^{-1}}\left( \alpha \right)\psi _{t+1}^{2}$ (14)
where, F-1(α) is the α quantile of the cumulative distribution of the error innovation distributions.
This paper relies on historical data comprising of daily closing prices of 5 cryptocurrencies obtained from Yahoo finance website (https://finance.yahoo.com/cryptocurrencies/). These cryptocurrencies include: Binance coin (Sept. 11, 2017 – April 8, 2022), Bitcoin (Jan., 21, 2015- April 8, 2022), Etheurum (Sept. 11, 2017 – April 8, 2022), Tether (Sept. 11, 2017 – April 8, 2022) and USD Coin (October. 08, 2018 – April 8, 2022). The daily closing prices was converted to returns using continuously compounded returns formula given by:
${{R}_{t}}=\log \left( \frac{{{d}_{t}}}{{{d}_{t-1}}} \right)\times 100$ (15)
where, dt is present day closing price for the cryptocurrencies and dt-1 is the daily closing price for the previous day and n is the number of observations.
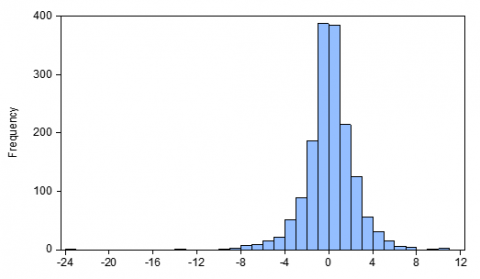
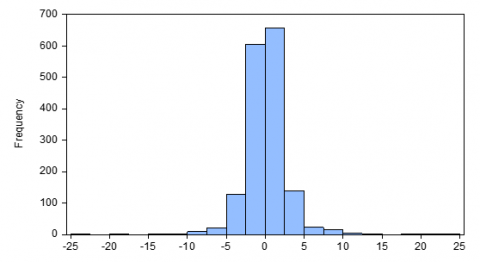
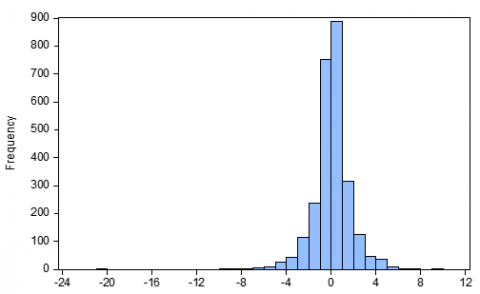
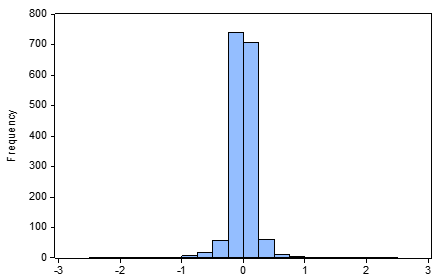
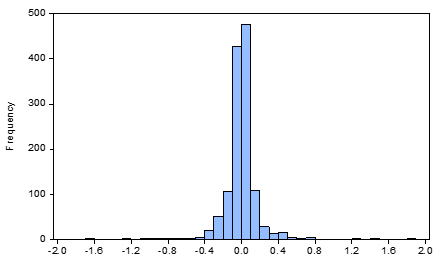
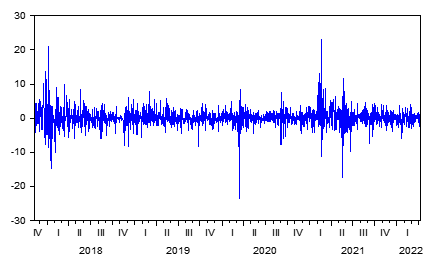
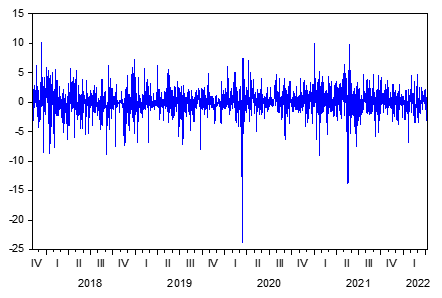
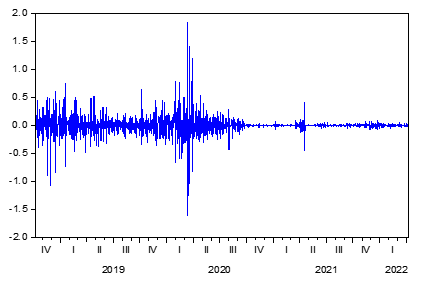
Summary of the descriptive statistics for the returns of these cryptocurrencies are as shown in Table 1. The mean returns obtained for Binance coin (0.144380), Bitcoin (0.086195) and Etheurum (0.061932) were greater than zero while that obtained for Tether (-0.000212) and USD coin (-0.0000838) were negative indicating that Binance coin, Bitcoin and Etheurum reported made gains during the period of study while Tether and USD coin secured loss. The mean returns for Binance coin as depicted in Table 1 were greater than that obtained for other cryptocurrencies which implies that this coin secured more gain than Bitcoin and Etheurum though its returns was less consistent compared with other currencies (SD=2.665380). The highest value of standard deviation reported by Binance coin indicates that this crypto currency is riskier than Bitcoin, Etheurum, Tether and USD coin while Tether was found to less risky compared other currencies. Result of skewness reveals Binance coin, Tether and USD coin were positively skewed indicating that the returns of the currencies increased more than it decreased in values while that of Bitcoin and Etheurum were negatively skewed indicating that Bitcoin and Etheurum returns decreased more than it increased in values within the period of study. Jarque bera statistic reveals that the returns do not follow normal distribution (p<0.05) and this is also supported by the histogram plots as shown in Figures 1-5. This also emphasizes the need to use a skewed error innovation distribution. The time plot of the log returns as presented in Figures 6-10 indicate that the returns from these digital currencies are stationary.
Figure 1. Histogram of daily log-returns from Sept. 11, 2017 – April 8, 2022 (Etheurum)
Figure 2. Histogram of daily log-returns from Sept. 11, 2017 – April 8, 2022 (Binance coin)
Figure 3. Histogram of daily log-returns from Sept. 11, 2017 – April 8, 2022 (Bitcoin)
Figure 4. Histogram of daily log-returns from Sept. 11, 2017 – April 8, 2022 (Tether)
Figure 5. Histogram of daily log-returns from October 08, 2018 – April 8, 2022 (USD coin)
Figure 6. Plot of the daily log-returns for Tether
Figure 7. Plot of the daily log-returns for Binance coin
Figure 8. Plot of the daily log-returns for Bitcoin
Figure 9. Plot of the daily log-returns for Etheurum
Figure 10. Plot of the daily log-returns for USD coin
Table 1. Summary statistics of cryptocurrencies log returns
|
|
Binance Coin |
Bitcoin |
Etheurum |
Tether |
USD Coin |
|
Duration |
Sept. 11, 2017 – April 8, 2022 |
Jan., 21, 2015- April 8, 2022 |
Sept. 11, 2017 – April 8, 2022 |
Sept. 11, 2017 – April 8, 2022 |
October 08, 2018 – April 8, 2022 |
|
n |
1611 |
2634 |
1611 |
1611 |
1278 |
|
Minimum |
-23.58584 |
-20.18298 |
-23.91798 |
-2.283073 |
-1.617029 |
|
Maximum |
22.98364 |
9.776792 |
10.19466 |
2.458380 |
1.843098 |
|
Mean |
0.144380 |
0.086195 |
0.061932 |
-0.000212 |
-0.0000838 |
|
SD |
2.665380 |
1.682049 |
2.258657 |
0.209983 |
0.176704 |
|
Skewness |
0.406430 |
-0.752002 |
-0.982003 |
0.661620 |
0.486143 |
|
Kurtosis |
17.12732 |
14.41610 |
13.31763 |
41.89426 |
27.81198 |
|
JB |
13441.23 |
14551.69 |
7404.618 |
101661.8 |
32832.87 |
|
P-value |
0.0000 |
0.000000 |
0.000000 |
0.000000 |
0.000000 |
Note: n-number of observations
Table 2. Summary of the ADF test for stationarity and ARCH effect test
|
|
ADF Test |
ARCH Effect |
||
|
|
Test statistic |
p-value |
F-stat. |
p-value |
|
Binance coin |
-26.39192 |
0.0000 |
119.9336 |
0.0000 |
|
Bitcoin |
-52.64211 |
0.0001 |
23.55499 |
0.0000 |
|
Etheurum |
-41.94191 |
0.0000 |
11.05000 |
0.0009 |
|
Tether |
-19.39856 |
0.0000 |
495.7821 |
0.0000 |
|
USD coin |
-20.39295 |
0.0000 |
196.5226 |
0.0000 |
The result of the ARCH effect as presented in Table 2 confirmed the presence of ARCH effect and thus the use of GARCH models is confirmed. The skewness parameters in all innovation distribution used were significant (p<.05) justifying the use of error innovation distribution with skewness parameter other than Student- t, generalized error and normal distributions. The Augmented Dickey Fuller (ADF) test result for the stationarity of the returns as presented in Table 2 reveals p-value less than 0.05 meaning that these crypto returns series were stationary.
Result of the selection of the best volatility models for each of the cryptocurrencies are presented in Table 3 and Table 4. For Binance coin, the best fitted model was GJR- GARCH (1,1)-snorm while for Bitcoin, Etheurum, Tether and USD coin, the best fitted models were GJR-GARCH(1,1)-snorm, APARCH(1,1)-snorm, EGARCH(1,1)-sged and APARCH(1,1)-sged respectively. In terms of out of sample forecasting performance, result reveals that EGARCH(1,1)-sged performed better than other volatility models while for Bitcoin, Etheurum, Tether and USD coin, the best forecasting models were EGARCH(1,1)-sstd, APARCH(1,1)-sstd, EGARCH(1,1)-sged and GJR-GARCH(1,1)-sstd respectively. Due to the relative advantage of out- of- sample forecasting performance over fitness performance, volatility models with the best forecasting performance were adjudged as the best model for each of the selected cryptocurrency.
Table 3. Model of selection criteria based on fitness (LL and AIC) and forecasting performance (out of sample performance) for Binance coin, Bitcoin and Etheurum
|
Models |
Binance Coin |
|||
|
|
LL |
AIC |
RMSE |
ARCH Effect test |
|
GJR- GARCH (1,1)- snorm |
-3489.279 |
4.5289 |
6.55905216 |
0.20832 |
|
GJR- GARCH (1,1)- sstd |
-3353.372 |
4.3541 |
6.646444387 |
0.29361 |
|
GJR- GARCH (1,1)- sged |
-3356.428 |
4.3581 |
4.854967959 |
0.26035 |
|
SGARCH(1,1)- snorm |
-3489.434 |
4.5278 |
6.416861271 |
0.22305 |
|
SGARCH(1,1)- sstd |
-3353.96 |
4.3536 |
6.83180822 |
0.23221 |
|
SGARCH(1,1)- sged |
-3356.562 |
4.3569 |
5.033075028 |
0.23214 |
|
EGARCH(1,1)- snorm |
-3493.06 |
4.5325 |
7.758192755 |
0.27592 |
|
EGARCH(1,1)- sstd |
-3357.06 |
4.3576 |
4.303561806 |
0.32264 |
|
EGARCH(1,1)- sged |
-3441.034 |
4.4664 |
3.060668908 |
0.44263 |
|
APARCH(1,1)- snorm |
-3489.262 |
4.5301 |
6.769494373 |
0.21355 |
|
APARCH(1,1)- sstd |
-3353.235 |
4.3552 |
5.675167917 |
0.30545 |
|
APARCH(1,1)- sged |
-3356.282 |
4.3592 |
4.616462034 |
0.27755 |
|
|
Bitcoin |
|||
|
|
LL |
AIC |
RMSE |
ARCH Effect test |
|
GJR- GARCH (1,1)- snorm |
-4738.261 |
3.6986 |
4.62731642 |
0.2783 |
|
GJR- GARCH (1,1)- sstd |
-4375.357 |
3.4165 |
4.616241424 |
0.4638 |
|
GJR- GARCH (1,1)- sged |
-4371.921 |
3.4138 |
4.604094672 |
0.3902 |
|
SGARCH(1,1)- snorm |
-4738.578 |
3.6980 |
4.627663419 |
0.2924 |
|
SGARCH(1,1)- sstd |
-4382.814 |
3.4215 |
4.593171041 |
0.3099 |
|
SGARCH(1,1)- sged |
-4375.466 |
3.4158 |
4.640262993 |
0.2744 |
|
EGARCH(1,1)- snorm |
-4732.181 |
3.6930 |
4.665583842 |
0.3532 |
|
EGARCH(1,1)- sstd |
-4358.43 |
3.4025 |
4.558149966 |
0.4960 |
|
EGARCH(1,1)- sged |
-4372.14 |
3.4132 |
4.598795463 |
0.4168 |
|
APARCH(1,1)- snorm |
-4730.96 |
3.6937 |
4.842494249 |
0.3414 |
|
APARCH(1,1)- sstd |
-4351.303 |
3.3985 |
4.62248908 |
0.4974 |
|
APARCH(1,1)- sged |
-4360.575 |
3.4057 |
4.59126759 |
0.4223 |
|
|
Etheurum |
|||
|
|
LL |
AIC |
RMSE |
ARCH Effect test |
|
GJR- GARCH (1,1)- snorm |
-3394.474 |
4.4061 |
4.724599957 |
0.45840 |
|
GJR- GARCH (1,1)- sstd |
-3261.782 |
4.2355 |
6.887369149 |
0.4014 |
|
GJR- GARCH (1,1)- sged |
-3262.69 |
4.2366 |
4.700084223 |
0.42305 |
|
SGARCH(1,1)- snorm |
-3394.518 |
4.4048 |
4.725777544 |
0.46578 |
|
SGARCH(1,1)- sstd |
-3262.414 |
4.2350 |
6.241271059 |
0.33849 |
|
SGARCH(1,1)- sged |
-3263.011 |
4.2358 |
4.670052052 |
0.37939 |
|
EGARCH(1,1)- snorm |
-3397.333 |
4.4085 |
5.075956734 |
0.55739 |
|
EGARCH(1,1)- sstd |
-3265.685 |
4.2392 |
4.63938262 |
0.4565 |
|
EGARCH(1,1)- sged |
-3272.353 |
4.2479 |
4.039574784 |
0.4812 |
|
APARCH(1,1)- snorm |
-3394.392 |
4.4072 |
4.022846321 |
0.47095 |
|
APARCH(1,1)- sstd |
-3259.736 |
4.2341 |
4.022515399 |
0.4503 |
|
APARCH(1,1)- sged |
-3261.037 |
4.2358 |
4.522455496 |
0.46562 |
Summary of the parameter estimated for the optimal volatility model for each of the cryptocurrency is as shown in Table 5. Result in Table 5 reveals that the ARCH term of all models estimated with the exception of Binance coin were significant (p<.05) indicating that news about past volatility of these digital currencies have significant impact on its current volatility. The GARCH term was significant in all models suggesting evidence of volatility clustering of these cryptocurrencies. The leverage term was positive and significant for Binance coin, Bitcoin, Tether and USD coin which indicates that positive shocks in returns of these currencies increases volatility more than negative shock of the same sign while for Etheurum, there was no significant leverage effect (p>0.05). Tether gave the highest value of leverage effect indicating that the leverage effect is more pronounced in Tether than other cryptocurrencies. The VaR results is shown in Table 6 shows that for Binance coin, the model was rejected at 1% alpha level while for Etheurum, it was rejected at 10%, 5% and 1% alpha levels. For both Bitcoin and Tether, there were no rejections at all levels of significance indicating that the VaR provides an accurate measure for the level of downside risk for Bitcoin and Tether than other cryptocurrencies. This result also implies that the VaR performed poorly for USD coin and Etheurum (Table 6).
Table 4. Model of selection criteria based on fitness (LL and AIC) and forecasting performance (out of sample performance) for Tether and USD coin
|
Models |
Tether |
|||
|
|
LL |
AIC |
RMSE |
ARCH Effect test |
|
GJR- GARCH (1,1)- snorm |
1291.514 |
-1.6639 |
0.000766529 |
0.37969 |
|
GJR- GARCH (1,1)- sstd |
1437.873 |
-1.8522 |
0.000844795 |
0.34743 |
|
GJR- GARCH (1,1)- sged |
1432.964 |
-1.8458 |
0.000841719 |
0.35769 |
|
SGARCH(1,1)- snorm |
1284.65 |
-1.6563 |
0.001017087 |
0.409591 |
|
Models |
Tether |
|||
|
SGARCH(1,1)- sstd |
1467.634 |
-1.8894 |
0.0011004 |
0.262345 |
|
SGARCH(1,1)- sged |
1437.536 |
-1.8530 |
0.001095339 |
0.360145 |
|
EGARCH(1,1)- snorm |
1255.566 |
-1.6186 |
0.001319091 |
0.09369 |
|
EGARCH(1,1)- sstd |
1335.818 |
-1.7213 |
0.000870697 |
0.08573 |
|
EGARCH(1,1)- sged |
1330.778 |
-1.7147 |
0.000593222 |
0.09137 |
|
APARCH(1,1)- snorm |
CP |
CP |
CP |
CP |
|
APARCH(1,1)- sstd |
1467.634 |
-1.8894 |
0.001360786 |
0.262345 |
|
APARCH(1,1)- sged |
1458.713 |
-1.8779 |
0.001070595 |
0.249736 |
|
|
USD Coin |
|||
|
|
LL |
AIC |
RMSE |
ARCH Effect test |
|
GJR- GARCH (1,1)- snorm |
1403.674 |
-2.3066 |
0.000930876 |
0.3093 |
|
GJR- GARCH (1,1)- sstd |
1501.102 |
-2.4659 |
0.000878485 |
0.2198 |
|
GJR- GARCH (1,1)- sged |
1495.749 |
-2.4571 |
0.000900712 |
0.2336 |
|
SGARCH(1,1)- snorm |
1397.868 |
-2.2987 |
0.001016751 |
0.3256 |
|
SGARCH(1,1)- sstd |
1496.18 |
-2.4594 |
0.000996758 |
0.2128 |
|
SGARCH(1,1)- sged |
1491.706 |
-2.4520 |
0.001010229 |
0.2374 |
|
EGARCH(1,1)- snorm |
1322.012 |
-2.1734 |
0.066852786 |
0.08636 |
|
EGARCH(1,1)- sstd |
1393.608 |
-2.2900 |
0.001258109 |
0.07816 |
|
EGARCH(1,1)- sged |
1397.662 |
-2.2967 |
0.001004426 |
0.06619 |
|
APARCH(1,1)- snorm |
1415.424 |
-2.3244 |
0.003572056 |
0.2400 |
|
APARCH(1,1)- sstd |
1518.67 |
-2.4933 |
0.001988404 |
0.2177 |
|
APARCH(1,1)- sged |
1510.436 |
-2.4797 |
0.040953439 |
0.1936 |
Note: CP- Convergent problem.
Table 5. Parameter estimates for the best volatility models (based on RMSE) for each of the selected cryptocurrencies based on out of sample periods
|
|
Binance coin (EGARCH-sged) |
Bitcoin (EGARCH-sstd) |
Etheurum (APARCH-sstd) |
Tether (EGARCH-sged) |
USD Coin (GJR-GARCH-sstd) |
|
μ (p-value) |
0.599413 (0.000000)** |
0.063975 (0.001087) |
0.05735 (0.268256) |
0.001159 (0.074610) |
0.000723 (0.280854) |
|
ω (p-value) |
0.068579 (0.000000)** |
0.009093 (0.047356)* |
0.14516 (0.055240) |
-0.067771 (0.002104) |
0.000022 (0.000504) |
|
α (p-value) |
0.030642 (0.070025) |
0.049544 (0.001147)** |
0.12530 (0.000014)** |
0.103506 (0.001487)** |
0.362360 (0.000000)** |
|
β (p-value) |
0.963408 (0.000000)** |
0.992575 (0.000000)** |
0.86769 (0.000000) |
0.986225 (0.000000) |
0.742121 (0.000000) |
|
γ (p-value) |
0.226512 (0.000000)** |
0.253810 (0.000000)** |
-0.03729 (0.688147) |
0.487388 (0.000000) |
-0.204748 (0.001405) |
|
δ (p-value) |
- |
- |
1.36237 (0.000004) |
- |
- |
|
Skewness (p-value) |
1.000000 (0.000000)** |
0.981231 (0.000000)** |
0.97940 (0.0000) |
1.149276 (0.0000) |
1.073713 (0.000000) |
|
Shape (p-value) |
1.154477 (0.000000)** |
2.695221 (0.000000) |
(0.0000) |
1.167633 (0.000000) |
5.222153 (0.000000) |
Note: SSTD- Skewed Student-t- distribution, SGED- Skewed generalized error distribution.
This finding is in agreement with that found by Naimy et al. [11]. Based on the optimal model, significant leverage effect was found in all cryptocurrencies with Bitcoin not an exemption. This is not consistent with that of the finding found by Naimy et al. [11] which showed that Bitcoin do not exhibit asymmetric effect. This disparity could be due to the fact that the former study considered the unskewed version of innovation distribution as the study made use of normal, student t- distribution and generalized error distribution while this present student focused on skewed normal, skewed student-t and skewed generalized distribution which are more robust than their respective distribution with skewness parameter. This finding is corroborated by Ngunyi et al. [21] that non-linear GARCH models which takes into account distributions of innovation that capture skewness, kurtosis and heavy tail constitute excellent tools for modelling volatility in cryptocurrencies. This is one of the major significances of this study. The finding of this study also showed the superiority of the skewed generalized error and skewed student t- distribution over the skewed normal distribution and in most cases the skewed student- t distribution outperformed other distributions. This study also established that the EGARCH model outperformed other volatility models precisely for Bitcoin, Binance coin and Tether which is corroborated by studies [22-24] where EGARCH model showed superiority in modelling volatility of Bitcoin compared with other models. It was also found that cryptocurrencies with exception of Etheurum and USD coin exhibit positive leverage which is consistent with that of studies [11, 21-23]. The asymmetric GARCH models (EGARCH, GJRGARCH and APARCH) were found to outperformed the standard GARCH model (SGARCH) which is corroborated by Alqaralleh et al. [20]. Another major finding of this study is that the VaR model provided a reliable risk measure for Binance coin, Bitcoin and Tether but failed for Etheurum and Tether. This indicates that VaR model provided reliable result for 60% of the cryptocurrencies considered and failed in other 40%. The good performance of the VaR model in these three cryptocurrencies is corroborated by Naimy et al. [11] while its identified failure in the two cryptocurrencies is corroborated by Caporale and Zekokh [25] that in some cases VaR could be ineffective for risk management.
Table 6. VaR results
|
Cryptocurrencies |
Best Forecasting Models |
VaR Alpha Level |
Number of Exceptions |
T |
Ratio |
% |
Decision |
|
Binance coin (T=483) |
EGARCH-sged |
10% |
39 |
483 |
0.0807 |
8.07% |
Non -rejection |
|
|
|
5% |
17 |
483 |
0.0352 |
3.52% |
Non -rejection |
|
|
|
2.5% |
08 |
483 |
0.0166 |
1.66% |
Non -rejection |
|
|
|
1% |
05 |
483 |
0.0104 |
1.04% |
Rejected |
|
Bitcoin (T=793) |
EGARCH-sstd |
10% |
66 |
793 |
0.0832 |
8.32% |
Non -rejection |
|
|
|
5% |
34 |
793 |
0.0429 |
4.29% |
Non -rejection |
|
|
|
2.5% |
14 |
793 |
0.0177 |
1.77% |
Non -rejection |
|
|
|
1% |
01 |
793 |
0.0013 |
0.13% |
Non -rejection |
|
Etheurum (n=483) |
APARCH-sstd |
10% |
55 |
483 |
0.1139 |
11.39% |
Rejection |
|
|
|
5% |
30 |
483 |
0.0621 |
6.21% |
Rejection |
|
|
|
2.5% |
11 |
483 |
0.0228 |
2.28% |
Non -rejection |
|
|
|
1% |
06 |
483 |
0.0124 |
1.24% |
Rejection |
|
Tether |
EGARCH-sged |
10% |
28 |
483 |
0.0580 |
5.80% |
Non -rejection |
|
|
|
5% |
10 |
483 |
0.0207 |
2.07% |
Non -rejection |
|
|
|
2.5% |
5 |
483 |
0.0104 |
1.04% |
Non -rejection |
|
|
|
1% |
0 |
483 |
0.0000 |
0.00% |
Non -rejection |
|
USD coin |
|
10% |
46 |
383 |
0.1201 |
12.01% |
Rejection |
|
|
|
5% |
46 |
383 |
0.1201 |
12.01% |
Rejection |
|
|
|
2.5% |
11 |
383 |
0.0287 |
2.87% |
Rejection |
|
|
|
1% |
5 |
383 |
0.0131 |
1.31% |
Rejection |
After estimating the optimal model for each of the cryptocurrency, the following were the estimated equations based on parameter estimates provided in Table 5.
For Binance coin: ${{r}_{t}}=0.599413+{{\varepsilon }_{t}}$ (16)
$\begin{align} & \ln (\psi _{t}^{2})=0.068579+0.963408\ln (\psi _{t-j}^{2}) \\ & +0.030642\left[ \lambda {{\varepsilon }_{t-i}}+0.226512\left\{ \left. \left| \left. {{\varepsilon }_{t-i}} \right|-\sqrt{\frac{2}{\pi }} \right. \right\} \right. \right] \\\end{align}$ (17)
For Bitcoin: ${{r}_{t}}=0.063975+{{\varepsilon }_{t}}$ (18)
$\begin{align} & \ln (\psi _{t}^{2})=0.009093+0.992575\ln (\psi _{t-j}^{2}) \\ & +0.047356\left[ \lambda {{\varepsilon }_{t-i}}+0.253810\left\{ \left. \left| \left. {{\varepsilon }_{t-i}} \right|-\sqrt{\frac{2}{\pi }} \right. \right\} \right. \right] \\\end{align}$ (19)
For Etheurum: ${{r}_{t}}=0.05735+{{\varepsilon }_{t}}$ (20)
$\begin{align} & {{\psi }_{t}}^{1.36237}=0.14516 \\ & +0.12530{{\left( \left( \left| {{\varepsilon }_{t-1}} \right| \right)-\lambda {{\varepsilon }_{t-1}} \right)}^{1.36237}}+0.86769\psi _{t-1}^{2} \\\end{align}$ (21)
For Tether, ${{r}_{t}}=0.001159+{{\varepsilon }_{t}}$ (22)
$\begin{align} & \ln (\psi _{t}^{2})=-0.067771+0.986225\ln (\psi _{t-j}^{2}) \\ & +0.103506\left[ \lambda {{\varepsilon }_{t-i}}+0.487388\left\{ \left. \left| \left. {{\varepsilon }_{t-i}} \right|-\sqrt{\frac{2}{\pi }} \right. \right\} \right. \right] \\\end{align}$ (23)
For USD coin, ${{r}_{t}}=0.000723+{{\varepsilon }_{t}}$
$\begin{align} & {{\psi }_{t}}^{2}=0.000022 \\ & +0.362360\left( \left( \left| {{\varepsilon }_{t-1}} \right| \right)+0.204748{{\varepsilon }_{t-1}} \right)+0.742121{{\psi }_{t}}^{2} \\\end{align}$ (24)
This study has examined the volatility of five cryptocurrencies using GRACH models family with skewed innovation distribution (skewed normal, skewed student-t and skewed generalized error distributions) which have not given much research attention with regards to modelling volatility of cryptocurrencies. Finding from this study have justified the use of skewed version of normal, student-t and generalized error distributions as the skewness parameter was significant in all fitted volatility models and in all cryptocurrencies. Evidence of volatility clustering in cryptocurrencies was also confirmed in this study which implies that these digital currencies tend to cluster in response to market shocks.
In conclusion, the asymmetric GARCH models performed better than the standard GARCH model and using GARCH models with leverage effect with asymmetric innovation distribution such as the skewed student-t distribution and skewed generalized error innovation distribution enhanced the performance of these models compared with using skewed normal distribution. The study has also found that not in all cases that the VaR model provides reliable measures of risk for cryptocurrencies as evident in the result obtained for Etheurum and USD coin and hence caution should be taken when using it as measure of risk associated with cryptocurrencies.
There is also a need to develop new classes of robust skewed innovation distribution in volatility modelling as much of the available studies focused on the applications of the existing distributions. This can be done by exploiting the recent advances in distribution theory. It is believed that this will help in better estimate of the volatility dynamics of cryptocurrencies. There is need for further studies on the applications of stochastic volatility models and multivariate GARCH models in cryptocurrencies as many studies have not been carried out in this area.
The practical implications of these findings are enormous as it provides some information that could guide crypto investors and intending investors. The highest mean log returns reported by Binance coin is an indication that investing in Binance coin may be more viable compared to other cryptocurrencies while investing in Tether may not yield the anticipated returns. Also, all the cryptocurrencies showed significant clustering meaning that large changes in price are followed by large changes in price and small changes in price are followed by small changes in price. This implies that investors should expected many days of high returns which will be preceded by many days of large returns as well as many days of small returns followed by many days of small returns. The positive and significant leverage effect of Binance coin, Bitcoin, Etheurum and Tether indicates that positive returns have more influence on the volatility than negative returns while for USD coin, the reverse was the case.
[1] Kim, J.M., Jun, C., Lee, J. (2021). Forecasting the volatility of the cryptocurrency market by GARCH and stochastic volatility. Mathematics, 9: 1614. https://doi.org/10.3390/math9141614
[2] Bergsli, L.Ø., Lind, A.F., Molnár, P., Polasik, M. (2022). Forecasting volatility of Bitcoin. Research in International Business and Finance, 59: 101540. https://doi.org/10.1016/j.ribaf.2021.101540
[3] Nakamoto, S., Bitcoin, A. (2008). A peer-to-peer electronic cash system. Bitcoin.
[4] Ammous, S. (2015). Economics beyond financial intermediation: Digital currencies’ potential for growth, poverty alleviation and international development. Ammous, Saifedean, 19-50. https://papers.ssrn.com/sol3/papers.cfm?abstract_id=2832738.
[5] Scott, B. (2016). How can cryptocurrency and blockchain technology play a role in building social and solidarity finance? UNRISD Working Paper, No. 2016-1. https://www.econstor.eu/handle/10419/148750.
[6] Hou, A.J., Wan, W., Chen, C.Y.H., Hardle, W.K. (2020). Pricing cryptocurrency options. Journal of Financial Econometrics, 18: 250-279. https://doi.org/10.48550/arXiv.2009.11007
[7] Lahmiri, S., Bekiros, S. (2020). The impact of Covid-19 pandemic upon stability and sequential irregularity of equity and cryptocurrency markets. Chaos, Solitons and Fractalsm, 138: 109936. https://doi.org/10.1016/j.chaos.2020.109936
[8] Narayanan, A., Bonneau, J., Felten, E., Miller, A., Goldfeder, S. (2016). Bitcoin and cryptocurrency technologies: A comprehensive introduction. Princeton University Press. https://press.princeton.edu/books/hardcover/9780691171692/bitcoin-and-cryptocurrency-technologies.
[9] Antonopoulos, A.M. (2017). Mastering bitcoin. O’Reilly Media, Sebastopol, CA. https://www.oreilly.com/library/view/mastering-bitcoin-2nd/9781491954379/.
[10] He, D., Habermeier, K., Leckow, R., Haksar, V., Almeida, Y., Kashima, M., Kyriakos-Saad, N., Oura, H., Sedik, T.S., Stetsenko, N., Verdugo-Yepes, C. (2016). Virtual currencies and beyond: initial considerations. International Monetary Fund. https://www.imf.org/external/pubs/ft/sdn/2016/sdn1603.pdf.
[11] Naimy, V., Haddad, O., Ferna´ndez-Avile´s, G., El Khoury, R. (2012). The predictive capacity of GARCH-type models in measuring the volatility of crypto and world currencies. PLoS One, 16: e0245904. https://doi.org/10.1371/journal.pone.0245904
[12] Yan, K., Yan, H., Gupta, R. (2022). Are GARCH and DCC values of 10 cryptocurrencies affected by COVID-19? Journal of Risk and Financial Management, 15(3): 113. https://doi.org/10.3390/jrfm15030113
[13] Ngunyi, A., Mundia, S., Omari, C. (2019). Modelling volatility dynamics of cryptocurrencies using GARCH models. Journal of Mathematical Finance, 9: 591. https://doi.org/10.3934/QFE.2019.4.739
[14] Gyamerah, S.A. (2019). Modelling the volatility of Bitcoin returns using GARCH models. Quantitative Finance and Economics, 3(4): 739-753.
[15] Sami, M. (2021). Modelling the volatility of Bitcoin returns using Nonparametric GARCH models. Munich Personal RePEC Archive. https://mpra.ub.uni-muenchen.de/111116
[16] Cheikh, N.B., Zaied, Y.B., Chevallier, J. (2020). Asymmetric volatility in cryptocurrency markets: New evidence from smooth transition GARCH model. Research Finance Letter, 35: 101293. https://doi.org/10.1016/j.frl.2019.09.008
[17] Panagiotidis, T., Papapanagiotou, G., Stengo, T. (2022). On the volatility of cryptocurrencies. Economics Letters, 62: 101724. https://doi.org/10.1016/j.ribaf.2022.101724
[18] Baur, D.G., Dimpf, T. (2018). Asymmetric volatility in cryptocurrencies. Economics Letters, 173: 148-151. https://doi.org/10.1016/j.econlet.2018.10.008
[19] Ghorbel, A., Jeribi, A. (2021). Investigating the relationship between volatilities of cryptocurrencies and other financial assets. Decisions in Economics and Finance, 44: 817-843. https://doi.org/10.1007/s10203-020-00312-9
[20] Alqaralleh, H., Abuhommous, A.A., Alsaraireh, A. (2020). Modelling and forecasting the volatility of cryptocurrencies: A comparison of nonlinear GARCH-Type models. International Journal of Financial Research, 11: 346-356. https://doi.org/10.5430/ijfr.v11n4p346
[21] Ngunyi, A., Mundia, S., Omari, C. (2019). Modelling volatility dynamics of cryptocurrencies using GARCH models. Journal of Mathematical Finance, 9: 591. https://doi.org/10.4236/jmf.2019.94030
[22] Holtappels, L. (2018). Cryptocurrencies: Modelling and comparing time-varying volatility—the MGARCH approach [Internet]. http://arno.uvt.nl/show.cgi?fid=146809
[23] Abdalla, S.Z.S. (2012). Modelling exchange rate volatility using GARCH Models: Empirical evidence from Arab countries. International Journal of Economics and Finance, 4: 216. https://doi.org/10.5539/ijef.v4n3p216
[24] Naimy, V.Y., Hayek, M.R. (2018). Modelling and predicting the Bitcoin volatility using GARCH models. International Journal of Mathematical Modelling and Numerical Optimisation, 8: 197. https://doi.org/10.1504/IJMMNO.2018.088994
[25] Caporale, G.M., Zekokh, T. (2019). Modelling volatility of cryptocurrencies using Markov-Switching GARCH models. Research in International Business and Finance. 48: 143. https://doi.org/10. 1016/j.ribaf.2018.12.009