Maryam A. Fadhil*![]() | Waleed F. Shareef
| Waleed F. Shareef![]()
© 2023 IIETA. This article is published by IIETA and is licensed under the CC BY 4.0 license (http://creativecommons.org/licenses/by/4.0/).
OPEN ACCESS
With the advent of miniature sensor technology, it is now possible to collect data on various aspects of human movement under free-living conditions. This technology has the potential to be used in activity monitoring systems in several areas, including health, military, sports applications, and human monitoring. The majority of research in wearables technology is focused on skin-mounted sensors or embedded in tight clothes. However, most of our daily clothes are loose or contain wide parts. This paper is interested in analyzing measurements of an accelerometer embedded in loose clothes. Experiments are conducted using a wearable node embedded in an oblong piece of cloth to emulate loose clothes. The piece is attached to a participant's arm while performing daily activities. Measurements are collected and presented in both time and frequency domains. Finally, activity measurements are classified using SVM and KNN algorithms. Results indicate that the differences in measurements between loose and tight clothes are noticeable in both domains, but the degradation in classification accuracy is unneglectable. When the sensor was embedded in 10 cm long piece of cloth the classification accuracies are over 80% and 90% for SVM and KNN, respectively, which is approximate, 5% less than the tight clothes accuracies.
wearable sensors, human activity, smart clothes, tight clothes, loose-fitting clothes
Human activity tracking based on wearable devices has become more popular because it can be conducted without the limitation of time and location. It can be used in daily life perfectly and has become an essential part of several fields from sports and leisure to security systems. Tracking physical activities and behavior of humans commonly refers to automatically identifying physical activities performed by humans. Human activity tracking has become one of the most popular research topics due to the availability of many sensors and accelerometers, which are characterized by being low in cost and low energy consumption and it has greatly added to our understanding of human behavior [1-3].
With the development of wearable sensors technology, it becomes easier to wear sensors as external accessories, embedded in clothing, or implanted into the body. Although wearable technology made use of a wide range of sensor types, human activity tracking relies mainly on the use of sensors such as accelerometers and gyroscopes [4]. Accelerometers represent an efficient option for capturing, monitoring, and recognizing human motions [5]. Furthermore, it can be operated without any external ambient-based sensors or limitations in working conditions [6]. Most of the research in the human activity tracking field has shifted towards the use of sensor technology, based on time series recordings using sensor data to benefit from it in identifying the type of activities that an individual does, such as walking, standing, sitting, running, and jogging [7, 8]
In recent years, there have been a lot of wearable electronic devices and technologies, such as heart rate monitors, smartwatches, trackers, smart glasses, and fitness devices [9]. Small wearable sensors may be in different locations on the human body, such as the hand, leg, finger, and wrist. Some sensors may be implanted into the body, even tattooed or affixed to the skin [10], or integrated into clothes. Using sensors in clothing opens up new possibilities in fitness and health tracking and activity recognition. Typically, machine learning Algorithms are used to interpret sensors measurements to track and monitor various body positions, such as the independent monitoring of humans for applications including assisted living [11], rehabilitation, and monitoring [12], and health monitoring systems [13-15], especially during COVID_19 [16], remote epileptic patient supervising system [17], sports applications [18], wheelchair movement control [19], detect information about crime locations [20], monitoring oil [21], and detection of human movements [22].
The majority of recent studies have focused on wearable technology, where the accelerometer sensors are skin-mounted or embedded in tight clothes. However, in our daily life, we generally wear loosely fitted clothes except for underwear garments and sports clothing. Loose clothes are worn for aesthetic and protective purposes to cover the whole body, but they have received very little attention in wearable technology in contrast to tight clothes. There is an emerging tendency to tackle the problem of loose-fitted sensors in various applications such as in medical, monitoring patients, tracking activity, and many more applications. A supposed scenario for wearables sensors embedded in loose-fitted clothes is in medical application where patients usually where loose scrubs and need to be monitored continuously. Instead of attaching the sensors to the patient they can be embedded in the scrubs. Examples of loosely fitted clothes might include working clothes such as lab coats, worker overalls, and turnout coats. Other examples of loosely fitted clothes include traditional attire such as Arabic Thawb and Indian Sari, as well as party gowns and dresses. We expect they will be the dominant category among wearables in the next few years. Table 1 summarizes the recent works in wearable devices embedded into clothes. This paper presents a study of the differences in accelerometer measurements due to loose-fitted clothes compared to sensors embedded in tight clothes or skin-mounted sensors. The rest of the paper is organized as follows. Section II explains the work methodology, the wearable node design while and the experimental setup. Results are viewed and discussed in Section III while Section IV concludes the paper.
Table 1. Summarizes the recent works in wearable devices embedded into clothes
|
Type Clothes |
Sensor Type |
Classify Method |
Acc |
Ref. |
|
Loose long-sleeve shirt |
Accelerometer |
Nearest centroid |
89% |
[23] |
|
Loose long-sleeve shirt |
Accelerometer |
Nearest centroid |
75% |
[24] |
|
Loose pants |
Flexible piezoelectric |
Rule-based |
93% |
[25] |
|
Loose patient scrubs |
Flexible piezoelectric |
Rule-based |
88% |
[26] |
|
Shirt loose-fitting |
Accelerometer |
Rule-based |
96% |
[27] |
|
E-jacket |
Optical-strain |
CNN-LSTM |
90% |
[28] |
|
Blazer |
Textile Cable |
DeepConv-LSTM |
97% |
[29] |
|
Loose-fitting fabric |
Piezo-resistive |
SVM |
95% |
[30] |
|
Loose shirt |
Inertial sensors |
SVM |
91% |
[31] |
To quantify the effects of loose garments on activity tracking measurements, multiple sets of measurements are collected from a person undertaking several activities such as sitting, walking, running, up the stair, and down the stair. Measurements are collected using an accelerometer sensor, the sensor itself is attached to an oblong piece of cloth connected to the person arm to resemble a wide sleeve. Then, measurements are viewed in both time domains and frequency domains to be analyzed. Finally, selected features of the collected measurements from the time domain into typical classifiers that are widely used in activity tracking applications.
2.1 Wearable sensor node
There are four primary components in the designed wearable node such as microcontrollers for processing, acceleration sensor, communication wireless, and power supplies providing a direct voltage of 3.3V. The sensor is an ADXL345 board it consists of a 3-axis accelerometer and a 16-bit analog-to-digital converter that outputs digital signals. The range and resolution of the accelerometer are set to ±16 g and 0.4 mg/LSB, respectively. The data is captured at a constant sampling rate of 100 Hz.
Figure 1. Wearable node design
Since, the sensor measures both dynamic accelerations resulting from motion or shock and static accelerations, such as gravity, data were normalized by subtracting each response average in the time domain. The microcontroller is attained by using the ESP32 board which is widely used in health, fitness, and sports research, that requires basic communications and processing abilities [32, 33].
The microcontroller uses an I2C protocol to collect digital measurements from the ADXL345 sensor module, then send them to a personal computer, wirelessly, through Bluetooth protocol for processing. Figure 1 shows the final form of the designed wearable node.
2.2 Experimental setup and data gathering
The data for the experiment is derived from five activities such as sitting, walking, running, up the stair, and down the stair. The participant performs these activities with a rectangular (width ~ 5 cm, length~ 10 cm) non-stretchable piece of cloth attached to the participant arm. The node was placed in one of three locations such as at the top of the piece that is connected to the participant arm (Location 1), in the middle (Location 2), and at the free end of the piece (Location 3) as shown in Figure 2.
Figure 2. Experiment setup shows the planned locations of the wearable node on the cloth relative to the human arm
In the experiment setup, only one node is placed in one of the three locations, at a time. Location 1 is used to simulate the fixed node. While locations 2 and 3 were used to simulate the loose-fitting node. This work used Location 1 measurements for comparison with the two other locations' measurements. The piece dimensions and the node locations are shown in Figure 2. The location of the sensor is strictly regulated. The x-axis is pointing to the front of the body, the y-axis to the right side of the body, and the z-axis to the ground. This regulation was used throughout the experiment to reduce vibration and enhance its experiment repeatability.
Accelerometer measurements for each activity are recorded for approximately 8~10 seconds for sitting, walking, running, up the stair and down the stair. Since the sampling rate is 100Hz, each experiment corresponds to the data set that contains approximately 8000~10000 points. The experiment is repeated four times per activity per node location, hence there are 4×5×3 data sets. Each data point consists of three measurements representing acceleration along X, Y, and Z-axes. In the next section, only X-axis measurements were because the other two axes’ measurements are generally similar to X-axis measurements and show less variation between different activities and node locations than X-axis measurements. In total, 60 data sets are recorded as in Eq. (1):
Total data $=$ activities $\times$ locations $\times$ event case $=5 * 3 * 4=60$ data sets (1)
In this section, measurements in each data set are plotted with time to form a time response. Time responses for selected cases are viewed and compared. Since each case is repeated four times only a one-time response of each case was viewed.
At the beginning to prepare the data for processing, it needs to remove the gravitational acceleration included in the measured accelerations. This was done by recording idle activity for a few seconds and subtracting the mean for each later measurement. This is typical procedure in accelerometer measurements, especially for commercial low-cost sensors. For feature extraction, accelerometer measurements are processed using first-order statistical features like mean, standard deviation, minimum, maximum, and root mean square. Later, frequency responses of the same sets are viewed and compared. Finally, two algorithms (SVM and KNN) are employed to classify the data sets based on selected statistical features in time domains.
3.1 Time domain results
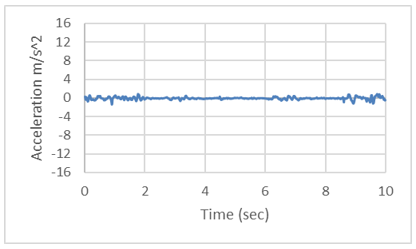
To understand the differences between the five activity measurements, their time responses are viewed together in Figures 3, 4, and 5, each time domain response they were normalized by subtracting the average of each response. Started with Figure 3 presents the graphs representing acceleration measurements when the node is at location 1. First, sitting activity time response is shown in Figure 3(a) where tiny fluctuation (less than ±1g) is shown due to background noise and slight body movement.
Next, in Figure 3(b) walking activity time response shows visible fluctuations (less than ±4g) that correspond to the participant steps and hand swinging movement. Similarly, Figure 3(c) shows the time response for running activity. It shows a large fluctuation (less than ±10g) compared to walking activity but in the same pattern.
(a) Sitting activity
(b) Walking activity
(c) Running activity
(d) Up the stair activity
(e) Down the stair activity
Figure 3. Time responses of the node at location 1
The last two activities (walking up and down stairs) time responses are shown in Figure 3(d, e) respectively. These figures show a jagged time response with acute dips in rhythm with the participant ascending/descending steps. The two responses look very similar to each other All the graphs in Figure 3 are typical responses that coincide with the result of previous related work.
For location 2, acceleration measurements are shown in Figure 4. First, the sitting activity time response is shown in Figure 4(a) which is also within ± 1g.
Next, in Figure 4(b) walking activity time response corresponds to the participant's steps and hand swinging movement with some noise due to the location of the sensor in the middle of loose a piece of clothing, the measurement range is within ±4g to with some peaks reach ± 8g.
Similarly, Figure 4(c) shows the time response for running activity. It shows a large fluctuation when compared with running in location 1. The range of measurements is between ± 8 and ±12.
The last two activities (walking up and downstairs) time responses are shown in Figure 4(d, e) respectively. These figures show a clear jagged time response when compare with location 1.
(a) Sitting activity
(b) Walking activity
(c) Running activity
(d) Up the stair activity
(e) Down the stair activity
Figure 4. Time responses of the node at location 2
Thirdly, we present the graphs that represent acceleration measurements when the node is at location 3. First, sitting activity time response is shown in Figure 5(a) where tiny fluctuation grate than ±1g is shown due to increased variation of the loose garment.
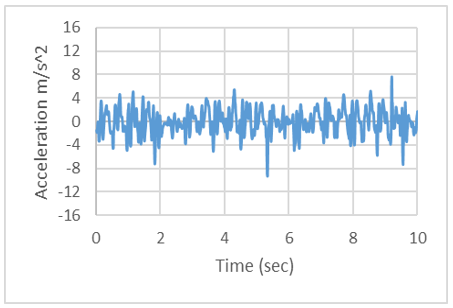
Next, in Figure 5(b) walking activity time response shows the participant's steps, the noise of data is increased due to the location of the sensor in the tip of loose a piece of clothing, and the range to ±8g. Similarly, Figure 5(c) shows the time response for running activity. It shows a large fluctuation when compared with running in locations 1,2. the range of data was between ± 14 to ±16.
The last two activities (walking up and downstairs) time responses are shown in Figure 5(d, e) respectively. These figures show a jagged time response more it in locations 1, and 2. The two responses are very similar to each other.
(a) Sitting activity
(b) Walking activity
(c) Running activity
(d) Up the stair activity
(e) Down the stair activity
Figure 5. Time responses of the node at location 3
3.2 Frequency domain result
For the frequency domain, FFT is calculated for each time response and compared. The frequency response generated from Figures 3, 4, and 5 are shown in Figures 6 to 10. In each graph, the highest magnitude and its corresponding frequency are marked inside the graph.
According Shannon-Nyquist theorem as shown in Eq. (2), the reconstructed signal bandwidth must be less than the sampling frequency (Fs). Since the accelerometer measurements were sampled at 100 Hz, the maximum frequency component in the response is 50 Hz. However, the next figures show that for all the activities, the frequency response diminishes greatly after 20Hz. This coincides with the fact the human activities in general exhibit relatively slow changes speed and directions even in the case of running.
Fs $\geq 2 \times$ maximum freq. in the signal (2)
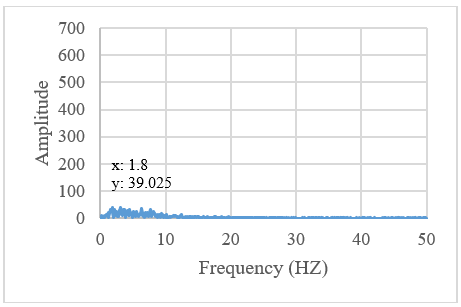
In the next figures, it is noticeable that the amplitude values are different from one case to other. In sitting activity, as shown in Figure 6 the amplitude of locations 1 and 2 are approximately equal, but it increases in location 3, indicates the healthy state of the sitting (without any motion).
(a) Sitting activity at location 1
(b) Sitting activity at location 2
(c) Sitting activity at location 3
Figure 6. FFT of sitting activity at three locations
Figure 7 showed the effect of walking was on the x-axis greater than the sitting x-axis, where the maximum amplitude equal to 232.45 at 2.5 Hz in location 1. In location 2 amplitude equal to 570.08 at 2.4 Hz, then in the location 3 it reaches 632.51 at 2.5 Hz.
(a) Walking activity at location1
(b) Walking activity at location 2
(c) Walking activity at location 3
Figure 7. FFT of walking activity in three locations
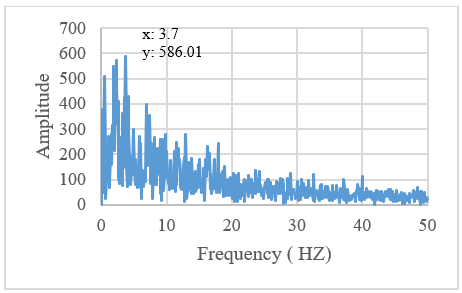
Figure 8 shown the FFT analysis of running activity. Where the maximum amplitude equal to 416.06 at 0.5 Hz in location 1, in location 2 the amplitude equal to 460.39 at 4.1 Hz then in the location 3 it is increase equal to 586.01 at 3.7 Hz.
(a) Running activity at location 1
(b) Running activity at location 2
(c) Running activity at location 3
Figure 8. FFT of running activity at three locations
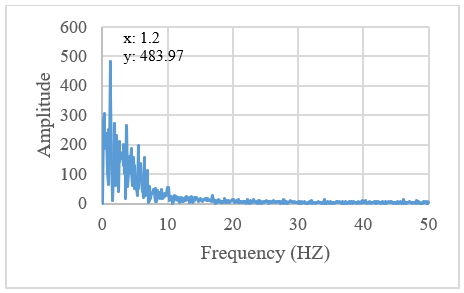
Figure 9 shown the FFT analysis of in up the stair activity. where the maximum amplitude equal to 401.2 at 1.4 Hz in location 1. In location 2 equal to 483.97 at 1.2 Hz, then in the location 3 it is increase equal to 657.431 at 1.2 Hz.
(a) Up the stair at location 1
(b) Up the stair at location 2
(c) Up the stair at location 3
Figure 9. FFT of up the stair at three locations
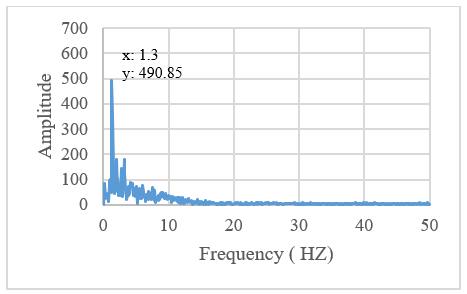
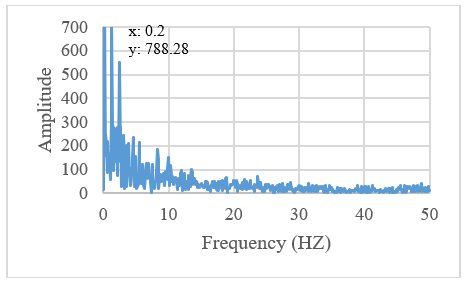
Figure 10 shown the FFT analysis of down the stair activity, where the maximum amplitude equal to 490.85 at 1.3 Hz at location 1. In location 2 the amplitude equal to 589.89 at 1.3 Hz then in the tip in increase equal to 788.28 at 0.2 Hz.
(a) Down the stair at location 1
(b) Down the stair at location 2
(c) Down the stair at location 3
Figure 10. FFT of down the stair at three locations
By examining the frequency responses in figures 6 to 10. Can be concluded, that the majority of the frequency components in all the activities are below 20 Hz. This is expected since we are dealing with human action. Walking activity shows higher values in magnitude than sitting activity, likewise, running activity shows higher values than walking, even beyond the 20 Hz limit. The frequency response exhibit shows a higher magnitude in location 2 compared to location 1, likewise, location 3 shows an even higher magnitude. These magnitudes are appearing in larger and larger frequency components with location distance increase. This is due to the extra ripples in motion caused by the free end of the cloth piece.
3.3 Classification methods
This section investigates the classification of the collected data sets at the three locations based on the data collected from the experiment several classifiers face the limitations of the long training time and the large size of the data. In our method, we select two widely used algorithms the SVM and KNN which are already applied in many wearable-related types of research, these are types of deep learning algorithm that performs supervised learning for the classification or regression of data groups. These are can possible to classify the wearable data sensor due to it has can separate the feature and descriptors and resolves these problems in human activity recognition [34, 35].
In the confusion matrix, there are four parameters: True positives (TP), True Negatives (TN), False Positives (FP), and False Negatives (FN). The accuracy is calculated as Eqs. (3)-(6). The classification accuracy for each algorithm are listed in Table 2, while F1-score values are listed in Table 3.
Accuracy $=\frac{T P+T N}{T P+T N+F P+F N}$ (3)
Precision $=\frac{T P}{T P+F P}$ (4)
Recall $=\frac{T P}{T P+F N}$ (5)
$F 1$ score $=\frac{2 * \text { Precision } * \text { Recall }}{\text { Precision }+ \text { Recall }}$ (6)
Table 2. Accuracy for classification algorithm
|
Algorithm |
Location 1 |
Location 2 |
Location 3 |
|
KNN |
90% |
85% |
85% |
|
SVM |
95% |
80% |
85% |
It is worth noticing that the accuracy at Location 2 is slightly higher than the accuracy at Location 3 in the SVM algorithm. This is expected because of both two reasons, first, the difference is small compared to the accuracy ratio, second both locations 2 and 3 are considered loose compared to location 1, so they give comparable results.
Table 3. F1 score for classification algorithm
|
Algorithm |
Location 1 |
Location 2 |
Location 3 |
|
KNN |
0.67 |
0.82 |
0.57 |
|
SVM |
0.85 |
0.6 |
0.57 |
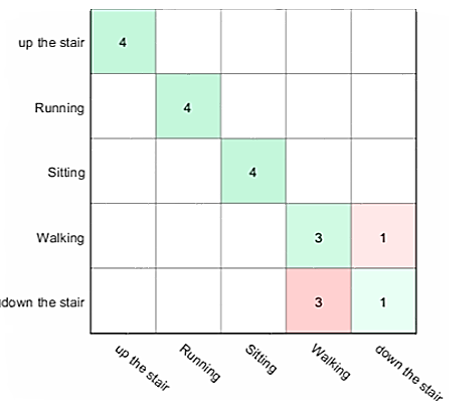
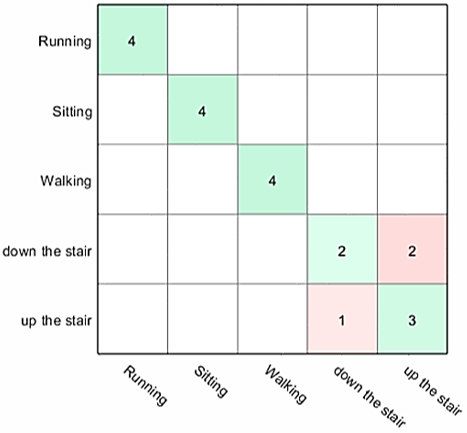
The Confusion matrix for the classification algorithms at locations 1, 2, and 3 are shown in Figures 11, 12, and 13, respectively. The results show that generally, both algorithms are capable of correctly classifying the activities.
Most of the misclassification is due to the similarity between walking up the stair and down the stair activities. A more careful design for the feature extraction will lead to higher classification rates. Results show that the classification is slightly better at Location 1. This is due to the measurement’s fluctuations at location 3. For the SVM algorithm, the classification rates are 95%, 80%, and 85% for locations 1, 2, and 3 respectively. For the KNN algorithm, the rates are 90%, 85%, and 85% for locations 1, 2, and 3.
(a) SVM classifier
(b) KNN classifier
Figure 11. Confusion matrix at location 1
(a) SVM classifier
(b) KNN classifier
Figure 12. Confusion matrix at location 2
(a) SVM classifier
(b) KNN classifier
Figure 13. Confusion matrix at location 3
This study aimed to analyze the effect of loose-fitting clothes on wearable sensors to demonstrate whether loose-fitting clothing can be exploited to provide information about human movement using sensor data and compare it with sensor data that is worn directly on the body or embedded in tight clothes. An experiment is conducted with a participant to measure the effect of loose clothing on the sensitive part by wearing a rectangular non-stretchable piece of cloth (~ 10 cm) attached to the participant’s arm. The sensor is placed at one of three locations, at the beginning of the piece (to simulate a sensor embedded in tight clothes, in the middle (~5 cm), and at the end of the piece (to simulate a sensor is embedded in loose clothes), while the participant is asked to do five daily activities: sitting, walking, running, walking up the stair, and walking down the stair. Experiments results showed that measurements from all activities in the case of loose cloth are larger and exhibit more fluctuation than in the case of tight clothes. This conclusion is also supported by the frequency domain response of the measurements at the three sensor locations. Finally, two widely used classification algorithms such as SVM and KNN are used to classify the five activities at each location. The results show that both SVM and KNN classification algorithms are capable of correctly classifying the activities when the sensor is embedded in loose clothes, within ~10 cm, and providing slightly less classification accuracy compared to tight clothes results.
[1] Muaaz, M., Chelli, A., Abdelgawwad, A.A., Mallofré, A.C., Pätzold, M. (2020). WiWeHAR: Multimodal human activity recognition using Wi-Fi and wearable sensing modalities. IEEE Access, 8: 164453-164470. https://doi.org/10.1109/ACCESS.2020.3022287
[2] Yen, C.T., Liao, J.X., Huang, Y.K. (2020). Human daily activity recognition performed using wearable inertial sensors combined with deep learning algorithms. IEEE Access, 8: 174105-174114. https://doi.org/10.1109/ACCESS.2020.3025938
[3] Lawal, I.A., Bano, S. (2020). Deep human activity recognition with localisation of wearable sensors. IEEE Access, 8: 155060-155070. https://doi.org/10.1109/ACCESS.2020.3017681
[4] Wang, Y., Cang, S., Yu, H. (2019). A survey on wearable sensor modality centred human activity recognition in health care. Expert Systems with Applications, 137: 167-190. https://doi.org/10.1016/j.eswa.2019.04.057
[5] Wang, A., Chen, G., Yang, J., Zhao, S., Chang, C.Y. (2016). A comparative study on human activity recognition using inertial sensors in a smartphone. IEEE Sensors Journal, 16(11): 4566-4578. https://doi.org/10.1109/JSEN.2016.2545708
[6] Hsu, Y.L., Yang, S.C., Chang, H.C., Lai, H.C. (2018). Human daily and sport activity recognition using a wearable inertial sensor network. IEEE Access, 6: 31715-31728. https://doi.org/10.1109/ACCESS.2018.2839766
[7] Munoz-Organero, M. (2019). Outlier detection in wearable sensor data for human activity recognition (HAR) based on DRNNs. IEEE Access, 7: 74422-74436. https://doi.org/10.1109/ACCESS.2019.2921096
[8] Kong, W., He, L., Wang, H. (2021). Exploratory data analysis of human activity recognition based on smart phone. IEEE Access, 9: 73355-73364. https://doi.org/10.1109/ACCESS.2021.3079434
[9] Lara, O.D., Labrador, M.A. (2012). A survey on human activity recognition using wearable sensors. IEEE Communications Surveys & Tutorials, 15(3): 1192-1209. https://doi.org/10.1007/978-981-15-5679-1_51
[10] Rahmani, A.M., Bayramov, S., Kiani Kalejahi, B. (2022). Internet of things applications: opportunities and threats. Wireless Personal Communications, 122(1): 451-476. https://doi.org/10.1007/s11277-021-08907-0
[11] Nasser, A.R., Hasan, A.M., Humaidi, A.J., Alkhayyat, A., Alzubaidi, L., Fadhel, M.A., Duan, Y. (2021). IoT and cloud computing in health-care: A new wearable device and cloud-based deep learning algorithm for monitoring of diabetes. Electronics, 10(21): 2719. https://doi.org/10.3390/electronics10212719
[12] Jobanputra, C., Bavishi, J., Doshi, N. (2019). Human activity recognition: A survey. Procedia Computer Science, 155: 698-703. https://doi.org/10.1016/j.procs.2019.08.100
[13] Osmani, V., Balasubramaniam, S., Botvich, D. (2008). Human activity recognition in pervasive health-care: Supporting efficient remote collaboration. Journal of Network and Computer Applications, 31(4): 628-655. https://doi.org/10.1016/j.jnca.2007.11.002
[14] Munem, A.S.A., Croock, M.S. (2016). Health monitoring system for ambulance emergency system using wireless sensor network. Engineering and Technology Journal, 34(15 Part A).
[15] Rao, K.K., Shanti, C., Rao, A.J., Babu, S.B., Kumari, G.L., Surekha, Y. (2022). Personalized smart diet assistance system in health care prosperity with AI and AR. Ingenierie des Systemes d'Information, 27(2): 267-274. https://doi.org/10.18280/isi.270210
[16] Rahma, M.M., Salman, A.D. (2021). A wearable medical monitoring and alert system of COVID-19 patients. Iraqi Journal for Computers and Informatics, 47(1): 12-17.
[17] Majety, V.D., Murali, G. (2018). A remote epileptic patient supervising system. Advances in Modelling and Analysis B, 61(4): 207-210. https://doi.org/10.18280/ama_b.610405
[18] Salvo, P., Di Francesco, F., Costanzo, D., Ferrari, C., Trivella, M.G., De Rossi, D. (2010). A wearable sensor for measuring sweat rate. IEEE Sensors Journal, 10(10): 1557-1558. https://doi.org/10.1109/JSEN.2010.2046634
[19] Al-janabi, M., Al-qaraawi, S. (2018). Quadreplegia wheelchair control system using quadreplegia wheelchair control system using electroencephalography signals. Portugal, 33(4): 20.
[20] Hussain, R.R.A., Al-Qaraawi, S.M., Croock, M.S. (2020). Viterbi optimization for crime detection and identification. TELKOMNIKA (Telecommunication Computing Electronics and Control), 18(5): 2378-2384. https://doi.org/10.12928/TELKOMNIKA.V18I5.13398
[21] Mossa, N.F., Shareef, W.F., Shareef, F.F. (2018). Design of oil pipeline monitoring system based on wireless sensor network. Iraqi Journal of Computers, Communication and Control & Systems Engineering, 18(2): 53-62. https://doi.org/10.33103/uot.ijccce.18.2.5
[22] Mukhopadhyay, S.C. (2014). Wearable sensors for human activity monitoring: A review. IEEE Sensors Journal, 15(3): 1321-1330. https://doi.org/10.1109/JSEN.2014.2370945
[23] Harm, H., Amft, O., Roggen, D., Tröster, G. (2010). Smash: A distributed sensing and processing garment for the classification of upper body postures. In 3rd International ICST Conference on Body Area Networks. https://doi.org/10.4108/ICST.BODYNETS2008.2955
[24] Harms, H., Amft, O., Troster, G. (2008). Influence of a loose-fitting sensing garment on posture recognition in rehabilitation. In 2008 IEEE Biomedical Circuits and Systems Conference, pp. 353-356. https://doi.org/10.1109/BIOCAS.2008.4696947
[25] Cha, Y., Kim, H., Kim, D. (2018). Flexible piezoelectric sensor-based gait recognition. Sensors, 18(2): 468. https://doi.org/10.3390/s18020468
[26] Cha, Y., Nam, K., Kim, D. (2017). Patient posture monitoring system based on flexible sensors. Sensors, 17(3): 584. https://doi.org/10.3390/s17030584
[27] Harms, H., Amft, O., Tröster, G. (2010). Estimating posture-recognition performance in sensing garments using geometric wrinkle modeling. IEEE Transactions on Information Technology in Biomedicine, 14(6): 1436-1445. https://doi.org/10.1109/TITB.2010.2076822
[28] Lin, Q., Peng, S., Wu, Y., Liu, J., Hu, W., Hassan, M., Wang, C.H. (2020). E-jacket: Posture detection with loose-fitting garment using a novel strain sensor. In 2020 19th ACM/IEEE International Conference on Information Processing in Sensor Networks (IPSN), pp. 49-60. https://doi.org/10.1109/IPSN48710.2020.00-47
[29] Bello, H., Zhou, B., Suh, S., Lukowicz, P. (2021). MoCapaci: Posture and gesture detection in loose garments using textile cables as capacitive antennas. In 2021 International Symposium on Wearable Computers, pp. 78-83. https://doi.org/10.1145/3460421.3480418
[30] Michael, B., Howard, M. (2017). Activity recognition with wearable sensors on loose clothing. Plos one, 12(10): e0184642. https://doi.org/10.1371/journal.pone.0184642
[31] Kiaghadi, A., Baima, M., Gummeson, J., Andrew, T., Ganesan, D. (2018). Fabric as a sensor: Towards unobtrusive sensing of human behavior with triboelectric textiles. In Proceedings of the 16th ACM Conference on Embedded Networked Sensor Systems, pp. 199-210. https://doi.org/10.1145/3274783.3274845
[32] Ferdinando, H., Khoswanto, H., Purwanto, D. (2013). Performance evaluation of MMA7260QT and ADXL345 on self balancing robot. TELKOMNIKA (Telecommunication Computing Electronics and Control), 11(1): 1-10. https://doi.org/10.12928/telkomnika.v11i1.258
[33] Vales, V.B., Fernández, O.C., Domínguez-Bolaño, T., Escudero, C.J., García-Naya, J.A. (2022). Fine time measurement for the internet of things: A practical approach using ESP32. IEEE Internet of Things Journal, 9(19): 18305-18318. https://doi.org/10.1109/JIOT.2022.3158701
[34] Chathuramali, K.M., Rodrigo, R. (2012). Faster human activity recognition with SVM. In International Conference on Advances in ICT for Emerging Regions (ICTer2012), pp. 197-203. https://doi.org/10.1109/ICTer.2012.6421415
[35] Sani, S., Wiratunga, N., Massie, S., Cooper, K. (2017). kNN sampling for personalised human activity recognition. In Case-Based Reasoning Research and Development: 25th International Conference, ICCBR 2017, Trondheim, Norway, Proceedings 25, pp. 330-344. https://doi.org/10.1007/978-3-319-61030-6_23