Sankaranarayanan Murugan* | Govindarajan Kulanthaivel | Venugopal Ulagamuthalvi
OPEN ACCESS
Faults are extracted from the source code, from the pre - processed metrics and the related fault data. The generated faults are represented as a data set and are categorised into code, design and other features. Selection of features and identifying the importance of the attributes from the given set of test cases is one of the important tasks in the software testing phase. A Fuzzy based evaluation of features using the Entropy measure and Hurwicz criterion has been carried on the code and design metrics for different test cases. The datasets have been further analysed using the Random Forest Approach for identifying the feature that has the higher priority. The results obtained using the Fuzzy Entropy measure and the Random Forest approach exhibits a similarity of 95 % in identifying the feature importance. The results show that the feature NUM_OPERANDS is having the highest impact from the given list of features by applying Fuzzy Entropy measure and the model built using Random Forest approach.
code metrics, design metrics, entropy, faults, feature selection, fuzzy, Hurwicz criterion, random forest
The core objective of the software fault prediction models is to identify the modules that are having faults with minimal resource allocation on software testing and maintenance activity [1]. The prediction of fault that lies in the modules has not improved by large, because of which there is an uncertain about the quality of the software product [2]. Identification and prediction of errors or bugs in the modules has a significant impact in the development of a software as it directly affects the quality of a software product. In the software testing process, it is important to identify the module behaves in an abnormal manner because of improper code or design. A series of test cases with various features that directly maps to code or design metrics will be generated which provides an insight about the quality of the module. Practically it is evident that only a small number of modules contains a majority of the faults in the given software [3, 4]. Therefore, focus should be there in the initial design phase for predicting the fault and it may result in the efficient allocation of resources for the software testing process. To predict the fault, a set of historical data should be made available either it can be collected, or obtained through repositories. In most of the cases the data repositories are not collected and managed in a proper manner [5, 6] at the organization level. At the outset, there are huge number of data repositories are available as open source or commercially for test case prediction. The article uses the data set as available at PROMISE [7]. The dataset is randomly classified into training and testing data sets.
The principle objective of this work is to identify the importance of feature(s) that has a significant impact in the test case data set. The experiment is a carried out using Fuzzy Entropy measure and Random Forest approach. The metrics considered for the evaluation process are code and design metrics. The remainder section of the article is organized as follows: section 2 summarizes the related work, section 3 explains the fuzzy entropy measure, section 4 presents the random forest approach, section 5 provides an insight into the experimental analysis and section 6 is concluded with a summary and the future scope of research.
The machine learning methods which includes inductive programming, the framework generates value-based test data using Genetic algorithms. Two critical components given importance as high priority. The pareto modules and defect-prone modules are identified as high priority for test data generation. The pareto principle in testing is 80 % of the defects is coming from the 20 % of the module and 90 % of the downtime comes from the 10 % of the defects [8]. Feature Selection helps in building the model in a machine learning approach. To evaluate and pre-process the data sets the identification of the feature with the highest impact is to be identified. Therefore, Feature selection is the process of identifying the attributes from the available data that are having higher impact during the prediction or forecasting the given problem statement. The reduction in dimensionality of the data set leads to a better solution, as least important attributes are ignored while making a decision. In the proposed work, two methodologies are considered for identifying the feature importance. Fuzzy entropy measure and random forest approach are the two methodologies applied in this work for identifying the features with high importance. The fuzzy entropy measure ranks the features and based on the selection of model; the random forest algorithm orders the feature which is having major impact in the software testing process.
Test suite minimization, test case selection and test case prioritization are the three major steps in the software testing process and are closely associated [9, 10]. To predict the defective and non-defective modules a survey was presented on the usage of testing metrics by using machine learning algorithms [11]. A mechanism was introduced to predict infeasible test cases by using Support Vector Machine (SVM) and induction grammars [12]. Mechanisms have been identified to detect fault prone classes using Random Forest (RF) algorithm [13]. Random Forest uses randomly selected subset of features in order to split at each node while growing a tree. The main characteristics of RF includes robust to outlier and noise, perform faster compare bagging and boosting, accurate, efficient for estimating missing data. The approach considers the metrics such as Coupling Between Objects (CBO), Lack of Cohesion (LC), number of children, depth of inheritance, Weighted Method per Class, Response for a Class, Number of Public Methods and Line of code. The Random Forest algorithm provides better accuracy by 74 % of correctly classifying the defects which reduces the test time. The test suite mechanism employs scope aided prioritization and scope aided selection process [14]. The aim of scope aided prioritization of test cases is to anticipate defects and terminate the testing process further. The prioritization used to change the order of the test cases for regression testing. The scope aided selection used to select the subset of the test case which is to be tested for the test objective.
Fuzzy entropy-based approach was proposed for classifying multi-facet test cases for regression testing [15]. The unified framework removes high ambiguity test cases and selects low ambiguity test cases for exercise on the System Under Test (SUT). The similarity-based test case selection is performed using fuzzy entropy method. The Fuzzy Fitness Evaluating Index (FFEI) is used to fit the test cases from the large pool of data. A regression test case selection based on multicriteria optimization method to prioritize the test case [16]. The greedy algorithm is not sensitive to the input size so that it cannot provide the optimized solution. A test case selection based on test case dependencies is proposed for test case selection largely depends on the static analysis of code is used for framing the candidate test cases [17].
A bi-criteria approach that takes into account two testing criteria [18]: (i) code coverage and (ii) past fault detection history. Two objectives were combined by applying a weighted-sum approach, and used integer linear programming (ILP) optimization to find subsets, then reducing the multi-objective problem to a single-objective one. A black box meta-data base approach introduced for prioritizing the test cases using supervised learning for manual regression testing [18] and the test case descriptions are processed in natural language for prioritization. The SVM algorithm is used to prioritize the test cases and ranked. White box testing examines each code block and internal of the software.
A new prioritization equation has been proposed for test cases based on the performance of the historical test cases data [19]. It is a feedback-based coefficient of historical data of previous version of the software is supplied to the proposed method. The priority equation employs the values of execution history, history of test cases in the previous session, historical fault detection. The effectiveness of this approach is to identify early fault and thereby improving the performance of the regression testing.
A fuzzy expert system for prioritize the test cases has been proposed based on risk-based test prioritization technique which incorporates the risk factors such as requirement complexity, security, and test cases [20]. This approach consists of the computation steps which include requirement risk, risk items, requirement risk item correlation. Finally, the fuzzy expert system delivers prioritize the requirements and test cases. The prioritization can also be determined using rank-based feature selection [21]. A test case which has the highest coverage of not-yet-covered entities is called as a tie. A test case prioritization technique has been introduced which employs input based and randomized local beam search algorithm [22]. It is an iterative based algorithm to find the next successor test case from the pool of test cases. For each iteration, it takes the input test case which is not prioritized. It randomly selects the candidate test case and compare the distance with already prioritize test cases and indexed. The vulnerability of software components using the machine learning algorithms can be predicted by considering some of the features to act as predictors [23]. The algorithms used to identify the vulnerability is Naïve Bayes and Random Forest Prediction approaches. A “SuiteBuilder” has been developed for collecting raw test suites and assign the priority for effective selection of features in the process of test case selection [24]. An aggregate-strength prioritization technique based on uncover test cases for higher interaction with various parameters of the module has been proposed for finding the dissimilarity of combinatorial test cases and heuristic algorithms are applied to prioritized the test cases [25].
Regular or ensembled approaches are applied in classifying the data set. The regular algorithms process the dataset based on a specific methodology and the output is generated. Whereas the ensembled approach engenders the result based on the outcome of one or more similar kind of algorithms. Random Forest algorithm follows the supervised learning and ensembled approach [26]. Collection of decision trees are generated from the subset of a data set (in a random manner – also known as training data set) and the algorithm aggregates the votes of the generated decision trees and based on which the final class of the test data sets is published as output. The random forest is also capable of predicting the feature importance in a process. The principle, every feature in the model is allotted with a score in the training process and the impurity of the tree nodes is reduced. The feature values are generated in the range of [0, 1] and the feature with the score = 1 is having the highest priority and with a score of 0 is the least impact one in the data set and it can be ignored.
The identification and selection of features in building the model using the machine learning approach is one of the critical factors. In the prediction or analysis of a model of a given data set with a set of features (or attributes) the selection of features with the highest significance is the process of feature selection. With the elimination of noise in the data set, the feature selection methods help the prediction process in a more precise and appropriate manner. The following check list are to be considered during the selection of features as given in [27] are: a) domain knowledge, b) inadequate features, c) feature dependence, d) modified input variables, e) individual assessment of features, f) requirement of a predictor, g) data cleaning, h) requirement of stable solution, i) computational resources and j) identify the starting point.
Experiments with similar data sets have been carried out [6-8] using Naiive Bayes, FURIA, KSTAR, NB and Decision Trees for the data sets PC1, PC2, PC3 and PC4. The accuracy rate is on an average of 90 %. In the proposed work, the dataset labelled as PC5 is also considered and tested with Random Forest and Fuzzy Entropy measure.
In the proposed work, the features are classified in to class level features, code metrics, design metrics and other metrics [7] and the features are listed in Table 1.
Table 1. Test case feature classification
|
Code Metrics |
Design Metrics |
Other Metrics |
|
PARAMETER_COUNT NUM_OPERANDS NUM_OPERATORS NUM_UNIQUE_OPERANDS NUM_UNIQUE_OPERATORS HALSTEAD_CONTENT HALSTEAD_DIFFICULTY HALSTEAD_EFFORT HALSTEAD_ERROR_EST HALSTEAD_LENGTH HALSTEAD_LEVEL HALSTEAD_PROG_TIME HALSTEAD_VOLUME NUMBER_OF_LINES LOC_BLANK LOC_CODE_AND_COMMENT LOC_COMMENTS LOC_EXECUTABLE PERCENT_COMMENTS LOC_TOTAL |
EDGE_COUNT NODE_COUNT BRANCH_COUNT CALL_PAIRS CONDITION_COUNT CYCLOMATIC_COMPLEXITY DECISION_COUNT DESIGN_COMPLEXITY DESIGN_DENSITY ESSENTIAL_COMPLEXITY ESSENTIAL_DENSITY MAINTENANCE_SEVERITY MODIFIED_CONDITION_COUNT MULTIPLE_CONDITION_COUNT |
CYCLOMATIC_DENSITY NORMALIZED_CYLOMATIC_COMPLEXITY GLOBAL_DATA_COMPLEXITY GLOBAL_DATA_DENSITY |
From the above features, the resulting feature “DEFECT” is evaluated to be fault or success. The features that are responsible for predicting the event of success or failure of the feature DEFECT the fuzzy based and random forest algorithms are applied. The data set applied here is PC5, which represents the safety enhancement of the cockpit upgrade system [7], written in C++ with the number of test cases 17189, defect cases 516 of which the design metrics count is 15, code metrics is 20 and the remaining is the considered as other metrics. The selection of features using the fuzzy entropy measure and the random forest algorithm are discussed.
The ranking of services based on the quantification of quality of service parameters the concept of fuzzy entropy measure is applied [28]. The features that are categorized into code and design metrics are ranked using the fuzzy entropy measure, thereby finding the impact of the feature in the test case evaluation process. The procedure for evaluating the test case features is shown in Algorithm FSFEM.
Algorithm for feature priority using fuzzy entropy measure
Algorithm: FSFEM(input: dataset [PC1, PC2, PC3, PC4, PC5], output: featureRankList):
1. Input: Data = [PC1, PC2, PC3, PC4, PC5]
2. Let si represents the data sets (n) where i ɛ [1,n], cj where j ɛ [1,m] represents the features (m) and d1 represents the code and d2 represents the design metrics.
3. Compute Weight: For all the attributes compute the weight from the respective data set by summing up the values
4. TFN: Compute the Triangular Fuzzy Number based on the weights by applying (x-2, x, x+2), where the value of x depends on the weight of the respective feature.
5. Normalize the values into a numerically comparable value
6. Normalized Opinion Matrix is computed.
7. Compute the Entropy Measure
8. Weights of each element in the matrix is calculated from values obtained using the entropy measure
9. Rank the features based on the obtained weights
10. Output: Return the array of Rank List of Features (featureRankList)
The input data is taken from five different test case data sets which are categorized in to code and design metrics. For every data set the algorithm is executed and analysed. The data set are labelled as s1, s2, s3, s4 and s5 which maps to PC1, PC2, PC3, PC4 and PC5. The variable ci represents the ‘m’ features (includes code and design metrics) and the metrics are labelled as d1 and d2. Based on the values of the attributes, which is different for every attribute, the triangular fuzzy numbers are assigned in the form of (x-2, x, x+2), where x represents the value of the feature and the possible values of every feature lies in the range [7, 28-33]. After computing the fuzzy triangular matrix, a consolidated feature summation matrix is generated (FSAM) for purpose of comparison. The obtained value can be either in the form of crisp or fuzzy and it depends on the feature values. Then, the maximum entropy theory is applied and the entropy measure of the ith feature is computed. The relative strength of the normalized matrix is the probability of information and is crisp in nature which is transformed to achieve the fuzziness. Finally, the weight of the test case feature is obtained from the fuzzy entropy measure. To identify the priority of the features the fuzzy simple additive weighting method is applied on the obtained weights. By using the Hurwicz criterion and the interval arithmetic by varying the alpha-cuts, the precise performance rating matrix is computed.
4.1 Evaluation of data sets using fuzzy entropy measure for feature selection
Table 2 shows the initial input data as available in the PROMISE repository. Si’s represents the five data sets as available in the PROMISE repository, Ci’s represents the features against the metrics di’s, M represents the metrics and F represents the Features.
Table 2. Initial data set
|
M |
F |
S1 |
S2 |
S3 |
S4 |
S5 |
|
D1 |
C1 |
614 |
1596 |
1511 |
1249 |
215030.54 |
|
C2 |
48557 |
23645 |
78892 |
56435 |
62905.57 |
|
|
C3 |
63326 |
34292 |
97424 |
91538 |
1391 |
|
|
C4 |
19054 |
9273 |
29883 |
19115 |
662101 |
|
|
C5 |
11599 |
8764 |
16396 |
17160 |
5448.72 |
|
|
… |
… |
… |
… |
… |
… |
|
|
D2 |
C1 |
9741 |
13818 |
30805 |
27416 |
105876 |
|
C2 |
2235 |
12093 |
25188 |
23196 |
105104 |
|
|
C3 |
15472 |
5565 |
14054 |
12319 |
51595 |
|
|
C4 |
5440 |
2661 |
3103 |
3383 |
11193 |
|
|
C5 |
203.76 |
8790 |
23024 |
10550 |
53640 |
|
|
… |
… |
… |
… |
… |
… |
Based on the step 4 in the algorithm (as in FSFEM) the following Table 3 shows the triangular fuzzy representation based on the scores obtained by the features against different data sets and metrics. The purpose is here to remove the ambiguity in the data set. The range of values assigned is depends the values as available in the initial data set (as in Table 2)
Table 3. Triangular fuzzy matrix representation for the features
|
M |
F |
S1 |
S2 |
S3 |
S4 |
S5 |
||||||||||
|
D1 |
C1 |
5 |
7 |
9 |
3 |
5 |
7 |
5 |
7 |
9 |
7 |
9 |
9 |
7 |
9 |
9 |
|
C2 |
7 |
9 |
9 |
1 |
3 |
5 |
7 |
9 |
9 |
7 |
9 |
9 |
7 |
9 |
9 |
|
|
C3 |
1 |
3 |
5 |
7 |
9 |
9 |
1 |
3 |
5 |
1 |
3 |
5 |
5 |
7 |
9 |
|
|
C4 |
1 |
1 |
3 |
3 |
5 |
7 |
1 |
3 |
5 |
1 |
3 |
5 |
5 |
7 |
9 |
|
|
C5 |
1 |
3 |
5 |
7 |
9 |
9 |
3 |
5 |
7 |
5 |
7 |
9 |
7 |
9 |
9 |
|
|
|
… |
… |
… |
… |
… |
… |
… |
… |
… |
… |
… |
… |
… |
… |
… |
… |
|
D2 |
C1 |
1 |
1 |
3 |
1 |
1 |
3 |
1 |
1 |
3 |
1 |
1 |
3 |
7 |
9 |
9 |
|
C2 |
5 |
7 |
9 |
5 |
7 |
9 |
5 |
7 |
9 |
3 |
5 |
7 |
3 |
5 |
7 |
|
|
C3 |
7 |
9 |
9 |
7 |
9 |
9 |
7 |
9 |
9 |
7 |
9 |
9 |
1 |
1 |
3 |
|
|
C4 |
1 |
3 |
5 |
1 |
3 |
5 |
1 |
3 |
5 |
1 |
1 |
3 |
7 |
9 |
9 |
|
|
C5 |
1 |
3 |
5 |
1 |
3 |
5 |
1 |
1 |
3 |
1 |
1 |
3 |
1 |
1 |
3 |
|
|
|
… |
… |
… |
… |
… |
… |
… |
… |
… |
… |
… |
… |
… |
… |
… |
… |
The consolidated values of the features on each data set with respect to the metrics (code and design) are obtained from the fuzzy triangular matrix by computing the average of the corresponding values. Table 4 shows the computed values.
Table 4. Consolidated feature matrix
|
S1 |
S2 |
S3 |
S4 |
S5 |
|||||||||||
|
C1 |
2.2 |
3 |
4.2 |
2.2 |
3 |
3.8 |
2.6 |
3.4 |
4.2 |
3 |
3.8 |
4.2 |
4.2 |
5.4 |
5.4 |
|
C2 |
2.6 |
3.8 |
4.6 |
2.6 |
3.8 |
4.6 |
3.8 |
5 |
5.4 |
3 |
4.2 |
5 |
3.4 |
4.6 |
5 |
|
C3 |
3 |
4.2 |
4.6 |
3.8 |
5 |
5.4 |
2.2 |
3.4 |
4.2 |
1.8 |
3 |
3.8 |
1.8 |
2.6 |
3.8 |
|
C4 |
1.4 |
2.2 |
3.4 |
1.4 |
2.6 |
3.8 |
0.6 |
1.4 |
2.6 |
0.6 |
1 |
2.2 |
2.6 |
3.4 |
4.2 |
|
C5 |
0.6 |
1.4 |
2.6 |
2.6 |
3.8 |
4.6 |
1.8 |
2.6 |
3.8 |
1.4 |
2.2 |
3.4 |
2.2 |
3 |
3.8 |
|
… |
… |
… |
… |
… |
… |
… |
… |
… |
… |
… |
… |
… |
… |
… |
… |
Table 5. Normalized feature matrix
|
S1 |
S2 |
S3 |
S4 |
S5 |
|||||||||||
|
C1 |
0.41 |
0.56 |
0.78 |
0.41 |
0.56 |
0.70 |
0.48 |
0.63 |
0.78 |
0.56 |
0.70 |
0.78 |
0.78 |
1.00 |
1.00 |
|
C2 |
0.48 |
0.70 |
0.85 |
0.48 |
0.70 |
0.85 |
0.70 |
0.93 |
1.00 |
0.56 |
0.78 |
0.93 |
0.63 |
0.85 |
0.93 |
|
C3 |
0.56 |
0.78 |
0.85 |
0.70 |
0.93 |
1.00 |
0.41 |
0.63 |
0.78 |
0.33 |
0.56 |
0.70 |
0.33 |
0.48 |
0.70 |
|
C4 |
0.26 |
0.41 |
0.63 |
0.26 |
0.48 |
0.70 |
0.11 |
0.26 |
0.48 |
0.11 |
0.19 |
0.41 |
0.48 |
0.63 |
0.78 |
|
C5 |
0.11 |
0.26 |
0.48 |
0.48 |
0.70 |
0.85 |
0.33 |
0.48 |
0.70 |
0.26 |
0.41 |
0.63 |
0.41 |
0.56 |
0.70 |
|
… |
… |
… |
… |
… |
… |
… |
… |
… |
… |
… |
… |
… |
… |
… |
… |
From the fuzzy triangular number, Normalized feature matrix is constructed by dividing each value by the maximum fuzzy value associated with the feature and is shown in Table 5.
Fuzzy entropy theory is applied to the normalized feature values for estimating the weight of the feature is shown in Table 6.
Table 6. Fuzzy entropy measure
|
S1 |
S2 |
S3 |
S4 |
S5 |
||||||||||
|
1.81 |
2.70 |
3.59 |
2.33 |
3.37 |
4.11 |
2.04 |
2.93 |
3.74 |
1.81 |
2.63 |
3.44 |
2.63 |
3.52 |
4.11 |
The normalized weight of each feature based on the computed fuzzy entropy measure is shown in Table 7.
Table 7. Normalized weight of feature
|
S1 |
S2 |
S3 |
S4 |
S5 |
||||||||||
|
0.16 |
0.20 |
0.23 |
0.19 |
0.21 |
0.24 |
0.16 |
0.19 |
0.23 |
0.16 |
0.19 |
0.23 |
0.19 |
0.21 |
0.24 |
By applying the normalized weight of the feature, the fuzzy performance tuning matrix is computed based on which the features are graded and is shown in Table 8.
Table 8. Fuzzy form of feature rating matrix
|
aij |
bij |
cij |
|
|
C1 |
1.584916 |
2.444444 |
3.548544 |
|
C2 |
1.901899 |
3.111111 |
4.240942 |
|
C3 |
1.711709 |
2.888889 |
3.894743 |
|
C4 |
0.507173 |
1.333333 |
2.596495 |
|
C5 |
0.919251 |
1.851852 |
3.115794 |
|
… |
… |
… |
… |
The fuzzy form of the matrix and by using the alpha cuts with interval arithmetic the matrix in Table 8 is converted into the crisp set which makes the ranking a concrete one during the ranking of the features. The task is carried out by using the Hurwicz criterion and the interval by varying the alpha cuts and is shown in Table 9.
Table 9. Performance rating matrix
|
Feature / alpha-cuts |
0.25 |
0.5 |
0.75 |
1.00 |
|
C1 |
2.121856 |
2.61582 |
3.10978 |
3.60374 |
|
C2 |
2.546128 |
3.12989 |
3.71366 |
4.29743 |
|
C3 |
2.314185 |
2.85780 |
3.40141 |
3.94503 |
|
C4 |
1.076274 |
1.60406 |
2.13186 |
2.65965 |
|
C5 |
1.519159 |
2.07243 |
2.62571 |
3.17899 |
|
… |
… |
… |
… |
… |
From Table 9, it is observed that the features are ranked in the following sequence:
Ranking of features
{
PARAMETER_COUNT : 4.240942,
NUM_OPERANDS : 4.23156,
NUM_OPERATORS : 4.200942,
NUM_UNIQUE_OPERANDS : 4.190942,
NUM_UNIQUE_OPERATORS : 4.180942,
HALSTEAD_CONTENT : 4.180665,
HALSTEAD_DIFFICULTY : 4.170942,
HALSTEAD_EFFORT : 4.05236,
HALSTEAD_ERROR_EST : 4.0123,
HALSTEAD_LENGTH : 3.98252,
HALSTEAD_PROG_TIME : 3.9152,
HALSTEAD_LEVEL : 3.894743,
LOC_CODE_AND_COMMENT : 3.89154,
HALSTEAD_VOLUME : 3.89121,
NUMBER_OF_LINES : 3.7862,
LOC_BLANK : 3.68205,
PERCENT_COMMENTS : 3.548544,
LOC_COMMENTS : 3.54582,
LOC_TOTAL : 3.49235,
LOC_EXECUTABLE : 3.48525,
CYCLOMATIC_COMPLEXITY : 3.46256,
DECISION_COUNT : 3.30255,
DESIGN_COMPLEXITY : 3.25625,
ESSENTIAL_COMPLEXITY : 3.1252,
DESIGN_DENSITY : 3.115794,
ESSENTIAL_DENSITY : 3.10225,
MAINTENANCE_SEVERITY : 2.596495,
MODIFIED_CONDITION_COUNT : 2.4693,
MULTIPLE_CONDITION_COUNT : 2.2145
}
In Ranking of features, it is observed that the feature “PARAMETER_COUNT” holds the major impact in the design of the software testing process, it is followed by NUM_OPERANDS, NUM_OPERATORS and so on. The feature with the least priority is MULTIPLE_CONDITION_COUNT.
To conclude, in the design of the software process, the feature “PARAMETER_COUNT” should be given higher priority for delivering a good quality software product.
Random forest is an ensembled algorithm and applies supervised learning. The algorithm generates a series of decision trees from a randomly chosen subset of data from the given data set. The algorithm aggregates the votes from the generated decision trees and based on which the decision class is chosen. Random Forest also evaluates the feature importance apart from the classification. For every feature in the data set a score is computed during the training phase. The process is repeated and the sum of the votes are aggregated at each round. Finally, if the sum equals to one, then the feature is having highest priority. The value ranges from zero to one. Based on the rank obtained for the feature the level of importance is identified.
To evaluate the feature importance for the test case data set PC5 [7] the random forest algorithm is applied. The pseudocode for FSRF is given as follows:
Feature selection using random forest
Algorithm FSRF (input: dataset, output: featureRankList):
The input is the data set PC5. The data set is categorized in to code metrics and design metrics. The decision class depends on the DEFECT attribute. Therefore, the model is generated against the DEFECT attribute with the attributes. Once the model is finalized, the process enters into the training and testing phase. As per the standard procedure, for training eighty percentage of the data set is considered in a random manner and the remaining twenty percent of the data is available for the testing purpose. To get the correctness of the model, the execution is repeated until the accuracy level gets saturated. Figure 1a and 1b shows the result of feature selection on code and design metrics.
Figure 1. Feature ranking using random forest on
In the code metrics, it is observed that the feature NUM_OPERANDS is having the highest priority than the other features. Extensive care should be taken while designing the software in selecting the operands. The least impact feature is HALSTEAD_VOLUME, which may be given lesser priority while designing the test case. Similarly, in the design metrics CYCLOMATIC_COMPLEXITY is to be given highest priority and the least one is ESSENTIAL_DENSITY. Figure 2a and 2b represents the ROC of Code and Design Metrics.
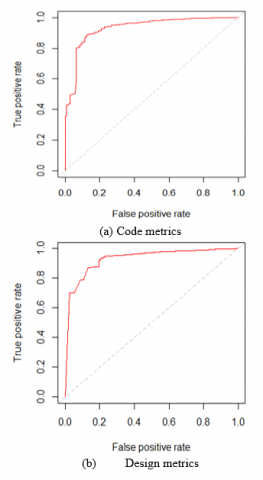
Figure 2. Receiver operating characteristic curve for PC5
From the Figure 2, it is observed that the rate of accuracy attained is more than 95 % for the data set PC5. It specifies that the model applied for the code and the design metrics is achieving a good percentage in successfully classifying the defective percentage. In a similar manner, the ROC curve for the data sets PC1, PC2, PC3, PC4 and PC5 are compared for the metrics code and design and is shown in Figure 3a and 3b.
As for PC5, the other data sets are also exhibiting a similar behaviour that the accuracy level is 95 % for the code and design metrics. The ranking generated by the Fuzzy Entropy Measure and the Random Forest exhibits similar results. However, there were minor variations in some of the features in their order of ranking. The similarity between the fuzzy entropy measure and the random forest is almost 95 %. Therefore, test case priority for the respective feature is to be given while designing the test case in the development of the software.
Figure 3. Receiver operating characteristic curve for the data sets PC1, PC2, PC3, PC4 and PC5
The proposed methodology provides the methodology to identify right feature which has a major impact in the evaluation of the test case. The machine learning approach using Random Forest and the Fuzzy based Entropy measure produces a similar type of result, i.e. the feature NUM_OPERANDS is one the vital feature when not coded properly it results in the failure of the test case, thereby degrading the quality of the developed software. The feature that has the highest impact is to be given priority while coding and designing. High focus on the specific attribute subsequently increases the quality of the product developed. The methods adopted using fuzzy and random forest provides the similar results for the given set of data sets. However, there were minor change in position of some of the attributes but still the similarity between the results generated by the Random Forest and Fuzzy is approximately 95%. The methodology can be extended to other approaches and higher accuracy is to be achieved.
[1] Singh, P., Verma, S. (2015). Cross project software fault prediction at design phase. International Journal of Computer and Information Engineering, World Academy of Science, Engineering and Technology, 9(3): 800-805. https://doi.org/10.1109/ICTAI.2006.77
[2] Menzes, T., Turhan, B., Bener. A., Gay, G., Cukic, B., Jiang, Y. (2008). Implications of ceiling effects in defect predictors. Proceedings of the 4th international workshop on Predictor Models in Software Engineering (PROMISE), pp. 47-54. http://doi.org/10.1145/1370788.1370801
[3] Andersson, C. (2007). A replicated empirical study of a selection method for software reliability growth models. Empirical Software Eng., 12(2): 161-182. https://doi.org/10.1007/s10664-006-9018-0
[4] Fenton, N.E., Ohlsson, N. (2000). Quantitative analysis of faults and failures in a complex software system. IEEE Trans. Software Eng., 26(8): 797-814. https://doi.org/10.1109/32.879815
[5] Zimmermann, T., Nagappan, N., Gall, H. (2009). Cross-project defect prediction: A large scale experiment on data vs. domain vs. process. Proceedings of the 7th Joint Meeting of the European Software Engineering Conference and the ACM SIGSOFT Symposium on The Foundations of Software Engineering, pp. 91-100. https://doi.org/10.1145/1595696.1595713
[6] Turhan, B., Menzies, T., Bener, A. (2009). On the relative value of cross company and within_company data for defect prediction. Empir. Softw. Eng., 14(5): 540-578. https://doi.org/10.1007/s10664-008-9103-7
[7] PROMISE, https://terapromise.csc.ncsu.edu/!/#repo/view/head/defect/mccabehalsted/pc, last accessed on 20.05.2019.
[8] Zhang, D. (2006). Machine learning in value-based software test data generation. Proceedings of the 18th IEEE International Conference on Tools with Artificial Intelligence (ICTAI'06), pp. 1-5. https://doi.org/10.1109/ICTAI.2006.77
[9] Yoo, S., Harman, M. (2010). Using hybrid algorithm for Pareto efficient multi-objective test suite minimisation. J. Syst. Softw., 83(4): 689-701. https://doi.org/10.1016/j.jss.2009.11.706
[10] Yoo, S., Harman, M., Ur, S. (2011). Highly scalable multi objective test suite minimisation using graphics cards. Proc. 3rd Int.Conf. Search Based Softw. Eng., pp. 219-236. https://doi.org/10.1007/978-3-642-23716-4_20
[11] Meiliana, Karim, S., Warnars, H.L.H.S., Soewito, B. (2017). Software metrics for fault prediction using machine learning approaches. IEEE International Conference on Cybernetics and Computational Intelligence (CyberneticsCom), pp. 19-23. https://doi.org/10.1109/CYBERNETICSCOM.2017.8311708
[12] Gove, R., Faytong, J. (2011). Identifying infeasible GUI test cases using support vector machines and induced grammars. IEEE Fourth International Conference on Software Testing, Verification and Validation Workshops, pp. 201-211. https://doi.org/10.1109/ICSTW.2011.73
[13] Kaur, A., Malhotra, R. (2008). Application of random forest in predicting fault-prone classes. International Conference on Advanced Computer Theory and Engineering, pp. 37-43. https://doi.org/10.1109/ICACTE.2008.204
[14] Miranda, B., Bertolino, A. (2016). Scope-aided test prioritization, selection and minimization for software reuse. The Journal of Systems and Software, 131: 528-549. http://dx.doi.org/10.1016/j.jss.2016.06.058
[15] Kumar, M., Sharma, A., Kumar, R. (2014). Fuzzy entropy-based framework for multi-faceted test case classification and selection: An empirical study. IET Software, 8(3): 103-112. https://doi.org/10.1049/iet-sen.2012.0198
[16] Lam, S.S.B., Hari Prasada Raju, M.L., Uday Kiran, M., Swarj, Ch., Srivatsav, P.R. (2012). Automated generation of independent paths and test suite optimization using artificial bee colony. Proceedia Engineering, Elsevier, 30: 191-200. https://doi.org/10.1016/j.proeng.2012.01.851
[17] Tahvili, S., Saadatmand, M., Larsson, S., Afzal, W., Bohlin, M., Sundmark, D. (2016). Dynamic integration test selection based on test case dependencies. IEEE Ninth International Conference on Software Testing, Verification and Validation Workshops. https://doi.org/10.1109/ICSTW.2016.14
[18] Black, J., Melachrinoudis, E., Kaeli, D. (2004). Bi-criteria models for all-uses test suite reduction. in Proc. 26th Int. Conf. Softw. Eng., pp. 106-115. https://doi.org/10.1109/ICSE.2004.1317433
[19] Khalilian, A., Azgomi, M.A., Fazlalizadeh, Y. (2012). An improved method for test case prioritization by incorporating historical test case data. Science of Computer Programming, 78(1): 93-116. https://doi.org/10.1016/j.scico.2012.01.006
[20] Hettiarachchi, C., Do, H., Choi, B. (2016). Risk-based test case prioritization using a fuzzy expert system. Information and Software Technology, 69: 1-15. https://doi.org/10.1016/j.infsof.2015.08.008
[21] Eghbali, S., Tahvildari, L. (2016). Test case prioritization using lexicographical ordering. IEEE Transactions on Software Engineering, 42(12): 1178-1195. https://doi.org/10.1109/TSE.2016.2550441
[22] Mei, L.J., Cai, Y., Ji, C.J., Jiang, B., Chan, W.K., Zhang, Z.Y., Tse, T.H. (2015). A subsumption hierarchy of test case prioritization for composite services. IEEE Transactions on Services Computing, 8(5): 658-673. https://doi.org/10.1109/TSC.2014.2331683
[23] Scandariato, R., Walden, J., Hovsepyan, A., Joosen, W. (2014). Predicting vulnerable software components via text mining. IEEE Transactions on Software Engineering, 40(10): 993-1006. https://doi.org/10.1109/TSE.2014.2340398
[24] Strandberg, P.E., Afzal, W., Ostrand, T.J., Weyuker, E.J., Sundmark, D. (2017). Automated system-level regression test prioritization in a nutshell. IEEE Software, 34(4): 30-37. https://doi.org/10.1109/MS.2017.92
[25] Huang, R.B., Chen, J.F., Towey, D., Chan, A.T.S., Lu, Y.S. (2015). Aggregate-strength interaction test suite prioritization. The Journal of Systems and Software, 99: 36-51. https://doi.org/10.1016/j.jss.2014.09.002
[26] https://www.stat.berkeley.edu/~breiman/randomforest2001.pdf, last accessed on 13.06.2019.
[27] Guyon, I., Elisseeff, A. (2003). An Introduction to Variable and Feature Selection, Journal of Machine Learning Research, 3: 1157-1182.
[28] Wang, P. (2008). An entropy decision model for selection of QoS-aware services provisioning. Fifth International Conference on Fuzzy Systems and Knowledge Discovery, Shandong, pp. 552-558. https://doi.org/10.1109/FSKD.2008.141
[29] https://smartbear.com/SmartBear/media/ebooks/The-State-of-Testing-2017_Report_Final. pdf, accessed on 20.05.2019.
[30] Jiang, Y., Cukic, B., Menzies, T., Bartlow, N. (2008). Comparing design and code metrics for software quality prediction. Proceedings of the 4th International Workshop on Predictor Models in Software Engineering, pp. 11-18. https://doi.org/10.1145/1370788.1370793
[31] Murugan, S., Ramachandran, V. (2014). Fuzzy decision making model for byzantine agreement. Journal of Engineering Science and Technology, 9(2): 206-219. Taylor’s University. https://doi.org/10.3844/jcssp.2012.382.388
[32] Ramachandran, V., Sankaranarayan, V. (1991). Fuzzy concepts applied to statistical decision making methods. Proceedings of the 15th IFIP International Conference, Zurich, Switzerland.
[33] Ibrahim, D.R., Ghnemat, R., Hudaib, A. (2017). Software defect prediction using feature selection and random forest algorithm. IEEE International Conference on New Trends in Computing Sciences. http://doi.org/10.1109/ICTCS.2017.39