Fayçal Chergui*![]() | Mohamed Bouzit
| Mohamed Bouzit![]()
© 2023 IIETA. This article is published by IIETA and is licensed under the CC BY 4.0 license (http://creativecommons.org/licenses/by/4.0/).
OPEN ACCESS
The urgent necessity to fortify coastal regions and safeguard both the natural environment and key coastal infrastructure underscores the significance of structural measures in coastal engineering. Among these, the seawall reigns as the primary fortification method. This study aims to elucidate the impact of a stepped structure on the propagation and overtopping of solitary waves when they encounter an impermeable seawall. The investigation has been conducted using ANSYS Fluent, a widely recognized commercial software. Although previous researchers have extensively used the two-dimensional volume of fluid (VOF) model, based on the Reynolds-Averaged Navier-Stokes (RANS) equations and the k-ε turbulence closure solver, this study fills the gap in the understanding of the stepped structure's effect. It shows a commendable agreement with experimental results, proving its reliability. Simulations were executed with varied configurations of stepped structures (Step width Sw=0.6 m, 1.2 m, 1.8 m, and Step height Sh=0.3 m, 0.6 m, 0.9 m), emulating tsunami waves of constant wave height and water depth over a stepped structure on a 1:20 sloped beach. Initially, the accuracy of the results was substantiated by comparing them with experimental and numerical data of the free surface and the distribution of the pressure field on the seawall. Numerical simulations, incorporating varying wave heights, water depths, and step heights, were performed to scrutinize the evolution of waves and the pressure exerted by waves impacting the seawall.
tsunami wave, ANSYS fluent, stepped structure, overtopping, wave pressure, Navier-stokes equations
Solitary waves, typified by their unique characteristics of run-up, overturning, and breaking, hold significant potential for inflicting substantial damage on shore-adjacent infrastructure. Tsunamis, as a primary exemplar of such waves, stand as natural disasters of profound consequence, wreaking havoc on a range of coastal infrastructure including, but not limited to, ports, bridges, and residential dwellings. Instances of such catastrophic events, as seen in the Chilean Sea Tsunami of 1960, with over 10,000 fatalities and individuals unaccounted for, and the Tohoku-Oki Earthquake of 2011, which culminated in a nuclear leakage at the Fukushima Nuclear Power Plant, underscore the devastating potential of tsunamis [1].
In the wake of the Indian Ocean tsunami that transpired on December 26, 2004, resulting in significant damages, a concerted effort has been directed towards comprehending the underlying dynamics of tsunamis, with the objective of enhancing predictive capabilities and mitigating their impacts.
The observation and study of solitary waves can be traced back to the work of Russell, with the first documented instance appearing in 1844 [2]. Building upon Russell's seminal work, subsequent studies [3-6] have been instrumental in expanding our understanding of solitary waves. Recent research endeavors on the topic [7-9] have yielded invaluable insights into the characteristics and behavior of these waves. Aside from analytical solutions, the literature also presents a host of approximation methods for calculating solitary waves. However, these methods have their limitations. To address this, a number of numerical approaches have been proposed, as documented in the works of [10-12]. The current state-of-the-art in tsunami wave simulation predominantly relies on numerical models, with solitary waves often serving as representations of a tsunami wave. This approach has been adopted by several researchers [12-16], further underscoring the importance of solitary waves in the study of tsunamis.
In the domain of continuum mechanics, elucidating environmental motion is typically approached via two distinct methodologies: the Eulerian approach and the Volume of Fluid (VOF) model. The former approach operates on the premise of considering each phase as an entirely independent entity, necessitating the resolution of individual Eulerian fluid equations for each phase. The latter, in contrast, does not extend this level of autonomy to each phase. Instead, it simplifies the process by solving a unified set of momentum equations, tracing the volume fraction of each fluid throughout the domain. This methodological simplification bolsters computational efficiency and stability.
A substantial body of research has leveraged the VOF model in conjunction with the Reynolds Averaged Navier-Stokes (RANS) equations and the k-ε turbulence model. Studies such as those conducted by Hsiao and Lin [12], Xiao and Huang [17], and Jiang et al. [18] have scrutinized the propagation of tsunami-like solitary waves over seawalls. Further comparative analysis by Wu [19] of different k-ε turbulence models indicated a superior accuracy of results yielded by the k-ε RNG model. Numerical investigations undertaken by Yao et al. [20] focused on the reduction of tsunami-like solitary wave run-up by pile breakwaters on varying sloping beaches. The application of Computational Fluid Dynamics (CFD), a popular tool for addressing a wide variety of research and engineering queries across diverse fields and industries, underpins these investigations. CFD often serves as a supplement or alternative to experimental and analytical methods, assisting in the design and analysis of everyday products. Within this sphere, ANSYS Fluent has emerged as a prominent CFD simulation tool, offering a comprehensive software package equipped with a user-friendly interface and an extensive range of features. Its adoption by numerous researchers attests to its utility. Studies like those performed by Khaware et al. [21] have explored the sensitivity of 5th order solitary wave models in shallow wave environments. Findings from these investigations suggest that the application of Stokes wave theory remains viable within the shallow regime, and the Explicit formulation is particularly sensitive to breaking conditions, necessitating a very small step size. Additional research has undertaken numerical simulations of the propagation, impinging, and overtopping of solitary waves on sloped beaches [22, 23]. A comparative study by De Chowdhury et al. [24] between two numerical models, the Smoothed Particle Hydrodynamics and ANSYS Fluent software, noted a comparable level of performance between these models.
Coastal infrastructures, including residential establishments and seawalls, are frequently constructed on slopes proximate to the shoreline. Despite this strategic positioning, they remain vulnerable to substantial impact forces and overtopping losses, primarily attributable to extreme wave action or tsunamis. In light of this, the prediction of wave overtopping discharges has emerged as a critical area of research within the realm of coastal engineering, running parallel to studies focusing on the propagation and evolution of solitary waves [25-27]. Numerical simulations conducted by Wei et al. [25], Ji et al. [26], and Luo et al. [27] have scrutinized the impact and surge of a solitary wave over a seawall, adopting the configuration presented by Hsiao and Lin [12]. A series of wave overtopping tests have been executed by Prabu et al. [22-29] to explore the propagation, impinging, and overtopping of tsunamis. The decrease in overtopping corresponding to an increase in wall slope was amongst their key findings. Historically, comprehensive investigations have been dedicated to various aspects of seawalls, including modifications on slope. These studies have yielded three prominent types of seawalls: Vertical seawalls [30-33], inclined seawalls [12, 34, 35], and stepped structures. The latter has been the subject of an extensive literature review [36], highlighting its efficacy as a coastal protection measure. Two-dimensional physical model tests were conducted by Krecic and Sayao [37], focusing on wave overtopping issues related to stepped seawalls across various scales. The researchers found that a stepped slope dissipates more energy than a smooth slope, culminating in an average reduction of 17.61% in the transmission coefficient. Empirical approaches for predicting the wave overtopping discharge of a stepped revetment were presented by Schoonees et al. [38] and Kerpen et al. [39], demonstrating the influence of step height on wave energy dissipation and overtopping discharge reduction. Further analysis by Chergui and Bouzit [40] examined the shoaling, breaking, breaking point position, and breaking height of solitary waves.
The current study is designed to numerically examine the propagation and overtopping of solitary waves on stepped structure slopes and impermeable seawalls. The unsteady Reynolds averaged Navier-Stokes (RANS) equations, coupled with a k-ε turbulence model, are employed to simulate the free surface elevation. The primary objective is to numerically probe the effects of a stepped structure on the overtopping volume and the pressure distribution of solitary waves impacting an impermeable seawall. Additionally, this study seeks to understand the variation of the free surface along the stepped structure slope and seawall on different wave gauges, and the influence of steps on the shoaling, breaking, and the location of breaking point Xb. Based on preliminary findings, stepped structures appear highly effective in reducing wave energy, acting as roughness elements which mitigate wave overtopping. Furthermore, these structures, in addition to their functional benefits, offer aesthetic coastal solutions, enhancing beach access, promoting tourism, and serving as potential seating or walkway areas.
2.1 Governing equations
The quality of a computational fluid dynamics (CFD) simulation can depend crucially on the selected turbulence model, and it is important to make the proper model choice. We use practical aspects of RANS turbulence model selection, which offers the most economic approach for computing complex turbulent industrial flows, simulation of the RANS equations greatly reduces the computational effort compared and is generally adopted for practical engineering calculations. However, the averaging procedure introduces additional unknown terms containing products of the fluctuating quantities, which act like additional stresses in the fluid. These terms, called ‘turbulent’ or ‘Reynolds’ stresses, are difficult to determine directly and so become further unknowns. Two dimensional Reynolds Averaged Navier Stokes (RANS) are numerically solved in the CFD solver FLUENT to simulate the unsteady and incompressible viscous fluids [22, 40, 41], in which the continuity equation and the momentum equation are, respectively:
$\frac{\partial u_i}{\partial x_i}=0$ (1)
$\frac{\partial\left(\rho u_i\right)}{\partial t}+\frac{\partial\left(\rho u_i u_j\right)}{\partial x_j}=-\frac{\partial P}{\partial x}+\frac{\partial}{\partial x_j}\left(\mu \frac{\partial u_i}{\partial x_j}-\overline{\rho u_{\imath}^{\prime} u_j^{\prime}}\right)$ (2)
where, i and j are the cyclic coordinates in an orthogonal coordinate system whose values are 1 and 2, while ui are the time-averaged velocity components; ρ is the density of the fluid; p is the pressure.
In the present study, the k-ε turbulence model, as proposed by Khaware et al. [21], Wei et al. [25], and Luo et al. [27], has been selected for application. This model currently enjoys widespread usage in the simulation of turbulent flow conditions. In addition to solving the conservation equations, it incorporates two transport equations, thereby accounting for historical effects such as the convection and diffusion of turbulent energy. The two variables transported in this context are the turbulent kinetic energy (k), representative of the energy in turbulence, and the turbulent dissipation rate (ϵ), indicative of the rate of dissipation of turbulent kinetic energy. The mathematical formulations of these variables are as follows:
$\frac{\partial}{\partial t}(\rho k)+\frac{\partial}{\partial x_i}\left(\rho k u_i\right)=\frac{\partial}{\partial x_j}\left[\left(\mu+\frac{\mu_t}{\sigma_k}\right) \frac{\partial k}{\partial x_j}\right]+G_k-\rho \varepsilon$ (3)
$\frac{\partial}{\partial t}(\rho \varepsilon)+\frac{\partial}{\partial x_i}\left(\rho \varepsilon u_i\right)=\frac{\partial}{\partial x_j}\left[\left(\mu+\frac{\mu_t}{\sigma_{\varepsilon}}\right) \frac{\partial \varepsilon}{\partial x_j}\right]+C_{1 \varepsilon} \frac{\varepsilon}{k} G_k-\rho C_{2 \varepsilon} \frac{\varepsilon^2}{k}$ (4)
To identified interfaces between non-penetrating fluids (VOF) method is used, the method can simulate two or various non-miscible fluids by calculating a unique equation of momentum and keeping the volume fraction of each of the fluids in the total domain [18, 23, 42]. Typical applications include the prediction of jet breakup, the motion of large bubbles in a liquid, the motion of liquid after a dam break, is capable of describing accurately the location and shape of the free surface, and provides a simple technique for computing its movement during each time step. Finally, VOF allows for a straightforward enforcement of the dynamic surface condition in the cells surrounding the interface.
The volume fraction of a particular fluid (α) is characterized as the proportion of the volume occupied by that fluid in relation to the total volume. Interfaces between distinct fluids are recognized when the volume fraction ranges between 0 and 1.
The sum of volume fractions for all the fluids must equate to one.
$\sum_a \alpha=1$ (5)
Volume fraction equation is given as:
$\frac{\partial \alpha}{\partial t}+\nabla \cdot(\bar{u} \alpha)=0$ (6)
Total continuity equation for incompressible fluid is given as:
$\nabla \cdot \bar{u}=0$ (7)
To solve this model, the PISO scheme is used for pressure velocity coupling, for calculations momentum and volume fraction we utilize second-order upwind and compressive schemes, respectively [18, 20, 21]. First-order transient methods are employed using an Explicit formulation. Finally, first-order upwind scheme was selected for the discretization of the equations of turbulent energy and dissipation.
2.2 Wave generation and solitary wave theory
Small amplitude wave theories are typically relevant for waves with lower steepness and relative depth, Conversely, finite amplitude wave theories are better suited for scenarios involving increased wave steepness or relative depth. Wave steepness is commonly defined as the ratio of wave height to wavelength, and relative depth is defined as the ratio of wave height to the depth of the liquid.
ANSYS Fluent offers the subsequent choices for incorporating incoming surface gravity waves using velocity inlet boundary conditions [43]:
- The first-order Airy wave theory (linear in nature) is utilized for small amplitude waves across shallow to deep liquid depth ranges.
- Higher order Stokes wave theories (nonlinear in nature), which are applied to finite amplitude waves in intermediate to deep liquid depth ranges.
- Higher-order Solitary wave theories (nonlinear in nature) are used for finite amplitude waves in shallow depth ranges.
Fluent develops Solitary wave theories expressed through Jacobian and elliptic functions by Fenton [44]. These wave theories are applicable to high steepness finite amplitude waves within the intermediate to deep liquid depth range.
The wave profile for 5th order Stokes theory is:
$\varsigma(X, t)=\frac{1}{k} \sum_{i=1}^5 \sum_{j=1}^i b_{i j} \xi^i \cos (j k(x-c t))$ (8)
$\begin{aligned} & \xi=\frac{k H}{2}=\frac{\pi H}{L} \text { and } k=\frac{2 \pi}{L} \\ & c=\sqrt{\frac{g}{k} \tanh (k h)}\left(\sum_{i=1}^5 c_i \xi^i\right)\end{aligned}$ (9)
where, c is wave celerity, k is wave number, bij ci, are complex expressions of kH.
Theories of solitary waves are predominantly employed in shallow depth regimes and are formulated by assuming that the waves possess an infinite wavelength. In shallow waters, the solution of solitary wave theories presents as extensive, level troughs and slender crests resembling real waves in shallow waters. to approach a real phenomenon and obtain the exact profile of a tsunami wave.
Shallow wave profile is:
$\varsigma(X, t)=H \operatorname{sech}^2\left\lceil\frac{k}{h}\left(x-x_0-c t\right)\right\rceil$ (10)
Wave numbers and wave celerity are:
$k=\frac{1}{h} \sqrt{\frac{3 H}{4 h}}$ and $c=\sqrt{g h}\left(1+\frac{H}{2 h}\right)\left(x_0\right.$ is initial position of wave)
3.1 Numerical domain
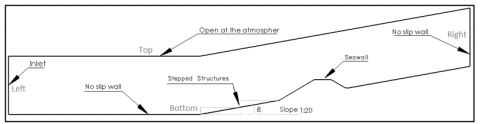
A two-dimensional numerical wave flume was used to study the evolutionary processes of solitary wave impinging and overtopping on a stepped structure slope, and dynamic pressure acting due to waves impacting the seawall, for a fair comparison the same computational domain was used according to Hsiao and Lin [12], to compare with experimental and numerical results. The flume is with the total length of 14 m, height of 0.4 m (Figure 1(a)). The stepped structures are installed along of slope before the seawall, three cases of stepped structure are studied the step width is Sw=0.6 m, 1.2 m, 1.8 m which corresponds approximately to the step height is Sh=0.3 m, 0.6 m, 0.9 m, the slope is 1:20 starting at x=7 m from the wave generator, where a reference wave gauge (WG01) was fixed at 1.1 m in front of the beach slope. the coordinates of the measurement wave gauges are: WG1 (x=5.9 m); WG3 (x=7.6 m); WG10 (x=9.644 m); WG15 (x=10 m); G22 (x=10.462 m); G28 (x=10.732 m); WG37 (x=11.005 m); WG38 (x=11.024 m); WG39 (x=11.045 m); WG40 (x=11.12 m); WG46 (x=11.57 m) (Figure 1(b)).
3.2 Boundary conditions and mesh description
The Fifth Order solitary waves are generated at the left and propagate towards the right, where the inlet boundary is selected with open channel flow parameters (Choosing shallow wave in Wave BC Option, and Average Flow Direction in reference wave). The bottom and stepped structure are treated as a stationary wall and no-slip condition, to assure no further inputs are required and the wall is not moving relative to the adjacent cell zone, while the top is considered a pressure outlet, where backflow direction specification method is normal to boundary (see Figure 2(a)).
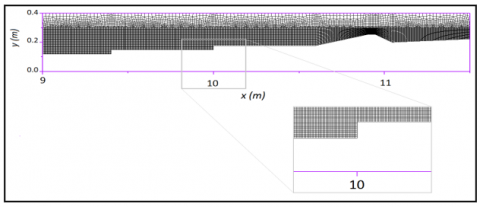
To verify the accuracy of the model, a structured mesh is utilized (Figure 2(a)), offer simplicity and efficiency, requires significantly less memory than an unstructured mesh with the same number of elements, because array storage can define neighbor connectivity implicitly, also save time to access neighboring cells, and require many more elements than an unstructured mesh for the same problem, because elements in a structured mesh cannot grade in size as rapidly.
(a) Schematic view of the numerical wave flume, with WG01 is reference wave gauge
(b) Schematic view of the stepped structure on slope
Figure 1. Schematic view of the domain
(a) Layout of the numerical setup
(b) Numerical grids of the computational domain
Figure 2. Boundary conditions and meshing
Figure 3. Variations of the normalized location of breaking point Xb/L
A numerical convergence test was performed by varying the grid size on slope using the typical wave condition of h0=0.2 m and H0=0.07 m. We also tested another four sizes (1, 2, 4 and 6 mm), Figure 3 shows the results for Variations of the normalized location of breaking point Xb/L (L is total domain length) at t=2.63 s, for comparison with numerical result of Hsiao and Lin [12] (see Figure 5(a)).
The differences in the simulations were generally 10% when the grid size is 6 mm, 8% for grid size 6 mm, 3% for grid size 2 mm, and 2% for grid size 1mm, we can notice there is not a significant difference between a 2 mm and a 1 mm mesh, but the calculation time is double compared with the 2 mm mesh, so we use 2 mm mesh grid size for this simulation.
The geometric model and grids are generated using ANSYS ICEM, In the vertical direction, the grid size start from 3 mm it was kept constant all the way at y=0.3 m and to y=0.3 to up to the top of the domain the grid size dy=10 mm. In the stream-wise direction the mesh is reduced gradually, from the inlet of the domain to x=6 m the grid size is dx=10 mm-dy=3 mm, from x=6 m to x=8 m the grid size is dx=5 mm-dy=3 mm, and from x=8 m at a location 1m downstream of seawall, the size is dx=2 mm-dy=2 mm to capture the shoaling and breaking of solitary waves, finally the grid size increased dx=10 mm-dy=10 mm from x=12 m at the end of the domain.
So, the mesh refinement starts at x=8 m because the wave breaking process starts at x=8.8 m for the case of Sw=1.8 m, Sh=0.09 m. in order to fully capture the free surface profile, we continue the refinement to location 1m downstream of seawall (x=12 m) for a more precise capture the wave overtopping (see Figure 2).
Several simulations were performed using different time step sizes, and a time step size of t=0.001 s was selected to ensure the accuracy and convergence of the solution. The simulations were carried out on a computer with a Core i7-3770, 3.40 GHz processor, and 16.0 GB of RAM, and a simulation time of 16 s was chosen to ensure that the overtopping processes on the seawall were fully completed.
To save computation time ANSYS Fluent propose parallel solver option, allows to compute a solution by using multiple processes that may be executing on the same computer, splits up the mesh and data into multiple partitions, then assigns each mesh partition to a different compute process, generally, as the number of compute nodes increases, turnaround time for solutions will decrease.
4.1 Model validation
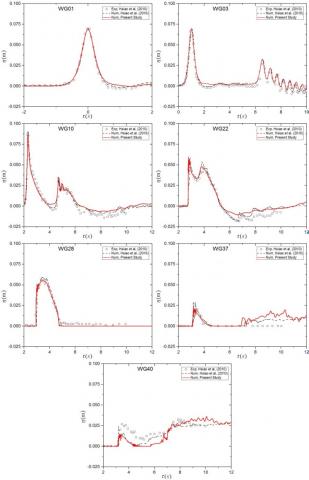
A numerical test without a stepped structure was performed to validate the solitary waves generated by the model, the experimental work and the numerical generated solitary wave profile for the Type 1 tsunami test, conducted by Hsiao and Lin [12] were compared at the numerical wave gauges for wave height of H0=0.07 m in the water depth of h0=0.2 m, which gives a non-linear wave with a relative wave height of H/h=0.35, where a reference (t=0) wave gauge G01 was fixed at 1.1 m in front of the beach slope.
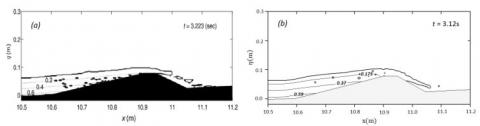
Figure 4. Comparison of the solitary wave profile of the numerical present results with the experimental and numerical data [12] (h0=0.2 m, H0=0.07 m, slope 1:20)
The comparison between the solitary wave profile obtained by the experimental and numerical simulation is in good agreement except for a little difference (Figure 4). Specifically, the present model slightly overestimates the surface elevation spike as the solitary wave climbs up on the seawall, and it slightly underestimates the thickness of the overland flow after the solitary wave overtops the seawall. The complexity and uncertainty in wave breaking during these stages can be attributed to the strong nonlinearity of the waves and the entrapped air within the water. These factors contribute to the challenging nature of accurately predicting and simulating wave breaking phenomena.
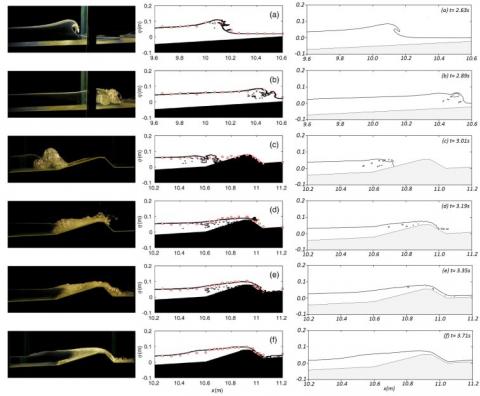
Figure 5. Comparative free surface evolution, measured and simulated (h0=0.2 m, H0=0.07 m), (left and center panel) Images from laboratory and numerical [12], (right panel) numerical present predictions
A However, these deviations are relatively small and do not significantly affect the overall accuracy of the model's simulation. The comparison of the present numerical results with the experimental and numerical data reveals a close agreement, indicating that the present model is capable of accurately simulating the propagation, shoaling, and breaking of solitary waves on slopes with a high degree of accuracy.
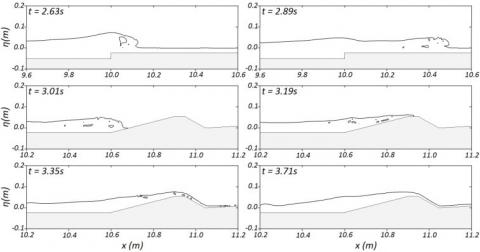
Spatial snapshots of the solitary wave during their distinct evolutionary course, including wave shoaling, breaking, impingement, run-up, and overtopping were presented in Figure 5. Laboratory images, measurement data, and numerical results by [12] are plotted together for comparison.
The solitary wave is generated and shoaled as it advances along the slope. Due to the significant nonlinearity of the incident solitary waves (A/h=0.35), the wave finally broke on the slope, resulting in the formation of a plunging breaker at t=2.63s, illustrated on Figure 5(a).
The current model not only precisely estimates the wave impact process, but also records the phenomena of wave separation and splashing, as illustrated in Figure 5(b). As the impinging jet approaches the shoreline, it collapses and incorporates a notable volume of air into the water. creating a turbulent bore at the offshore toe of the seawall. The model offers a real representation of the shape of the bore, depicted on Figure 4(c).
The turbulent bore persists in ascending along the slope of the seawall; subsequently, it surges over the crown of the seawall resembling a turbulent jet, a phenomenon adeptly captured by the current model (Figure 5(d)). When the jet passes downwind of the seawall, the jet continues to trap air within the fluid, mirroring observations from the physical experiment. The present model cannot predict the air trapping on the lee side of the seawall. Consequently, the model forecasts the point at which the jet makes contact with the flat beach on the lee side of the seawall (Figure 5(e)). After the peak bore surpasses the seawall, the overtopping flow gradually weakens, while residual fluid continues to propagate along the slope. The numerical prediction corresponds to the image from the laboratory, demonstrated on Figure 4(f), indicating a reasonable agreement between the two.
Figure 6. Snapshots of simulated free surface and distribution of the pressure field unit: kPa (ε=0.4, h0=0.2 m)
(a) Numerical data [12], (b) Present results
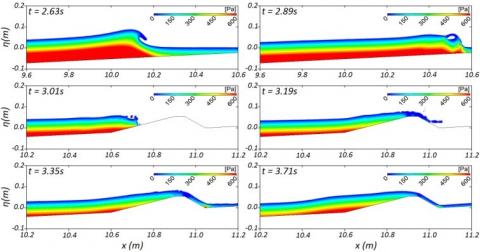
Figure 7. Pressure contour distributions when solitary wave propagates on slope 1:20 and seawall (h0=0.2 m, H0=0.07 m)
The preceding comparison effectively demonstrates the concordance between numerical results and free surface measures obtained from various gauges, and a qualitative comparison with laboratory images. The next comparisons are further made with the free surface and wave pressure field (Figure 6).
We also observe this slight difference in wave with a condition (ε=0.4, h0=0.2 m) the maximum error of pressure fields value compared to numerical data is 10% near the free surface and 2% near the wall or bottom, the difference decreases as approaching closer to the seawall seaward slope. The current numerical approach falls short of precisely predicting the values of the pressure fields in proximity to the free surface, this is attributed to the intricate and unpredictable nature of wave breaking during these stages, characterized by pronounced nonlinearity and the entrapment of air into the water near the free surface.
The evolution of the pressure distribution is presented in Figure 7 without the stepped structure, we notice an important concentration of pressure at the toe of the seawall x=10.6 m at the time of wave impact and overtopping, also a slighter pressure at x=11.04 m downstream the seawall, similar results of the simulation and phenomenon were presented by Luo et al. [27] (t=3.35 s and t=3.71 s).
4.2 Wave surface elevations and overtopping on stepped structure and seawall
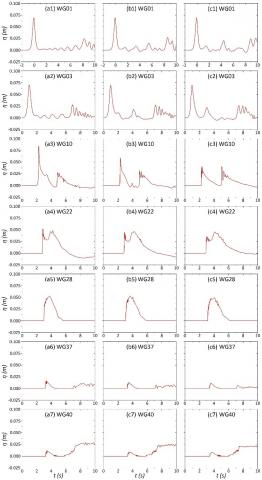
Figure 8 presented the wave surface elevation time histories at the different wave gauges, a numerical reference wave gauge (t=0) WG01 is placed at x=1.1 m from the toe of the slope, the wave height of the solitary wave remains mostly constant along the flat flume bottom WG01 for all case studies, suggesting good simulation accuracy, we also observed reflected waves depending to the number of steps, six waves for the first case, three waves for the second case, and two waves for the third case, a last reflected wave (t=8 s) due to the seawall, according to Yao et al. [20], Chergui and Bouzit [40] the reflected wave increase with increasing of step height Sh.
However, a slight increase was observed in G03 for all cases, this is due to the slope, the wave height increases up to the maximum height at the breaking point, we also observe that the number of reflected waves reduced because the position of the gauge is forward and exceeds some steps.
The wave gauge WG10 recorded a significant increase of the wave height η=0.08 m (Figure 8(a3)) because the breaking point is just near the location of Xb=9.94 m for the case Sw=0.6 m, Sh=0.03 m, which is not the other cases, for the case Sw=1.2 m, Sh=0.06 m Figure 8(b3) the breaking point is before the wave gauge WG10 Xb=9.3 m for the case where the wave breaks and losses height, and for the case Sw=1.8 m, Sh=0.09 m Figure 8(c3) the breaking point location is Xb=8.8 m the wave breaks further forward and losses more height.
Figure 8. Free-surface profiles at wave gauges of solitary wave on stepped structures slope 1:20 and seawall (h0=0.2 m, H0=0.07 m) (a) Sw=0.6 m, Sh=0.03 m (b) Sw=1.2 m, Sh=0.06 m (c) Sw=1.8 m, Sh=0.09 m
For the rest of the wave gauges, a reduction in wave height can be seen for all cases, the solitary surge rises along the crown of seawall and loses a considerable wave energy. Then the location of the breaking point Xb decreases and the breaking phenomenon is further forward when the step height Sh increases, causing a decrease of the wave height [39, 40].
(a) Sw=0.6 m, Sh=0.03 m
(b) Sw=1.2 m, Sh=0.06 m
Sw=1.8 m, Sh=0.09 m
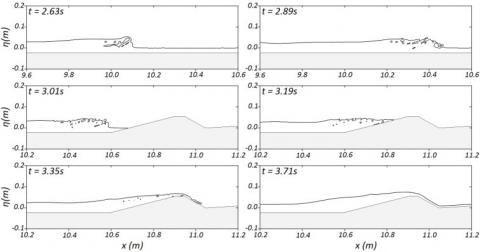
Figure 9. Free surface elevation when solitary wave propagates on stepped structures slope 1:20 and seawall (h0=0.2 m, H0=0.07 m)
To illustrate the process of solitary wave propagation and overtopping on a stepped slope and the effect of step height the Figure 9 shows the surface elevation when solitary wave propagates on stepped structures slope 1:20 and seawall (h0=0.2 m, H0=0.07 m) for all case studies.
By comparing the images presented with a picture of the propagation of a solitary wave on a plane slope without a stepped structure (Figure 5(a)), the breaking process starts at the position (location breaking point) x=9.9 m which isn't for the other cases, we can clearly see how the wave breaks for the same position (x=9.9 m) for the case (a) Sw=0.6 m, Sh=0.03 m (Figure 9(a)), for the case (b) Sw=1.2 m, Sh=0.06 m the wave breaking is continuing (Figure 9(b)), and for the case (c) Sw=1.8 m, Sh=0.09 m the breaking wave process is finished (Figure 9(c)).
For the wave overtopping on the seawall, we note that the wave overtopping passed the seawall and continues forward (Figure 5(e), t=3.35 s) for the plane slope (without stepped structure). For the same time t=3.35 s, the wave overtopping arrives downstream of the seawall (Figure 5(a)), the wave overtopping is in the middle of the seawall (Figure 5(b)), and for the third case, the wave overtopping is at the toe of the seawall.
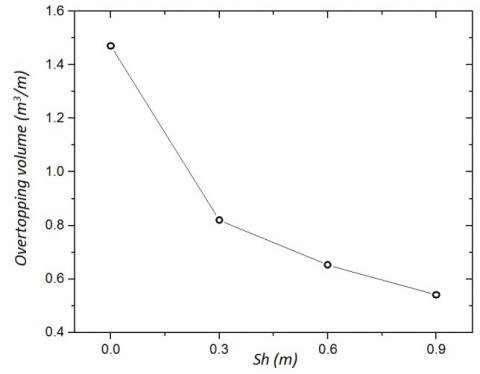
Figure 10. Overtopping water quantity volume over the seawall
Figure 10 shows in detail the quantity of water overtopping the wave in volume, the quantity of overtopping without stepped structures is reduced from 1.47 to 0.8 (53%) for Sh=0.03 m, 0.6 (60%) for Sh=0.06 m and 0.5 (66%) for Sh=0.09 m. The presence of the stepped structure therefore considerably reduces the quantity of wave overtopping volume.
4.3 Effects of stepped structure on pressure
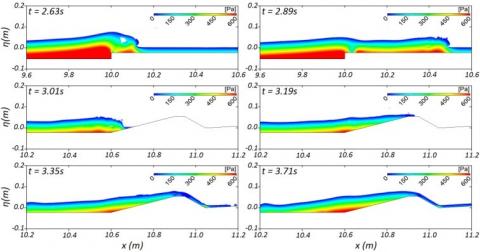
The turbulent jet that surges over the steps top becomes trapped with a significant amount of air, this interaction generates immense pressure (t=2.63 s (a)), we can clearly see how the step caused a reflected wave and a small transmitted wave that continues to break with low pressure (t=2.89 s (a)). As the wave breaks and propagates along the slope, the pressure distribution takes on an arc-shaped pattern, the downward sides of this distribution stretch downstream, following the progression of the overtopped wave.
The progression of wave pressure during both the breaking and post-breaking phases is also illustrated in Figure 11, at the moment of wave impact and overtopping, a significant pressure concentration is observed at the toe of the seawall, specifically at x=10.6 m. additionally, a slightly lower pressure can be observed downstream of the seawall at x=11.04 m. Except that the distribution is different for the cases studied compared with the image of Figure 7 (smooth slope) the installation of the steps on the slope considerably reduced the pressure distribution on the slope and seawall. We can clearly see how the step caused a reflected wave and a small transmitted wave that continues to break with low pressure.
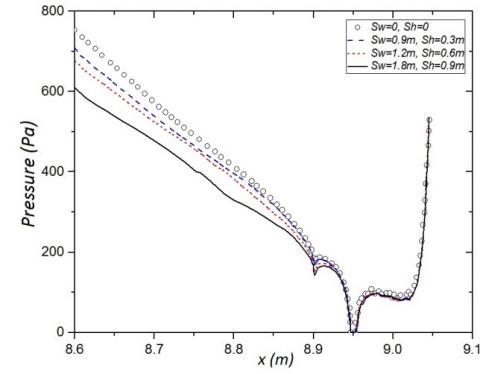
To clearly demonstrate the difference in pressure distribution on the seawall, Figure 12 shows all four cases studied in this article for the plane and stepped slope of the pressure distribution on the seawall, the graphs confirm the huge impact pressure in the toe of the seawall x=10.6 m and it decreases as the wave progresses up the slope until it becomes practically zero at the top of the seawall, this is due to the slope ascending and slowing down the flow and overtopping, after that the flow down the slope of the seawall and the pressure increases again x=11.04 m, the pressure at the top of the seawall without stepped structures is reduced from 760Pa to 710 Pa (7%) for Sh=0.03 m, 680 Pa (11%) for Sh=0.06 m and 640 Pa (20%) for Sh=0.09 m.
(a) Sw=0.6 m, Sh=0.03 m
(b) Sw=1.2 m, Sh=0.06 m
(c) Sw=1.8 m, Sh=0.09 m
Figure 11. Free surface elevation when solitary wave propagates on stepped structures slope 1:20 and seawall (h0=0.2 m, H0=0.07 m)
Figure 12. Pressure distribution over the seawall for all cases
In this study, we investigate solitary wave propagation on a stepped slope using a two-dimensional numerical model based on ANSYS Fluent. VOF method was used to capture the free surface with the Navier-Stokes equations with k-ε turbulence closure solved. A series of numerical simulations were conducted to investigate various aspects, including water surface profile, shoaling and breaking of solitary waves, wave reflection, overtopping volume, and pressure distribution on seawall by varying the stepped structure height (Sh). The results obtained from the simulations using the Fluent solver with a multiphase and k-ε turbulence model are in corroboration with numerical results and experimental data. This agreement indicates that the numerical model can accurately represent the free surface elevation, the breaking processes, and the pressure distribution on the slope and seawall.
This study showed how the pressure distribution is very concentrated at the toe of the seawall, which implies that the heavy pressure, requires a modification in future or adding other structures, as our results demonstrate. There are few research studies on the effect of step structure on wave breaking, especially the prediction of breaking point location Xb, in order how the location can be modified to accelerate the breaking process, our research offers an idea, how further research can group all physical parameters in function of breaking wave or breaking point location.
Our study has clearly illustrated how the wave overtopping and the pressure distribution on the seawall have been reduced, while detailed analyses of these results has revealed how the installation of stepped structures on a slope; as follows:
- Breaking wave process has been accelerated and dissipates energy in the form of turbulence near the free surface, and the step height cause reflected waves reducing the transmitted wave.
- Breaking point location has been advanced (as close as possible to the toe of the slope) according to the step height variation.
- Volume of overtopping and pressure distribution on the seawall were reduced up to 66% and 20% respectively.
According to this analysis, the stepped structure proved very effective for reducing wave energy and acting as a retarder to reduce wave overtopping, other added benefits are that these structures can be aesthetic coastal solutions that offer safe access to the beach and promote tourism, moreover, cost less and maintenance is easier.
[1] Yalciner, A.C., Suppasri, A., Mas, E., Kalligeris, N., Necmioglu, O., Imamura, F., Ozer, C., Zaytsev, A., Ozel, N.M., Synolakis, C. (2011). Field survey on the coastal impacts of March 11, 2011 Great East Japan Tsunami. Proceedings of the Seismic Protection of Cultural Heritage, Antalya, Turkey, 31.
[2] Russell, J.S. (1844). Report on waves. 14th Meeting of the British Association for the Advancement of Science, York, London.
[3] Boussinesq, J. (1871). Théorie de l’intumescence liquide appelée onde solitaire ou de translation se propageant dans un canal rectangulaire. Comptes Rendus de l'Académie des Sciences de Paris, 72(755-759).
[4] Keller, J.B. (1948). The solitary wave and periodic waves in shallow water. Communications on Applied Mathematics, 1: 323-339.
[5] Rayleigh, L. (1876). On waves. Philosophical Magazine, 1: 257-279.
[6] Munk, W.H. (1949). The solitary wave theory and its application to surf problems. Annals of the New York Academy of Sciences, 51(3): 376-424. https://doi.org/10.1111/j.1749-6632.1949.tb27281.x
[7] Fenton, J. (1972). A ninth-order solution for the solitary wave. Journal of Fluid Mechanics, 53(2): 257-271. https://doi.org/10.1017/S002211207200014X
[8] Longuet-Higgins, M.S., Fenton, J.D. (1974). On the mass, momentum, energy and circulation of a solitary wave. II. Proceedings of the Royal Society of London. A. Mathematical and Physical Sciences, 340(1623): 471-493. https://doi.org/10.1098/rspa.1974.0166
[9] Byatt-Smith, J.G.B., Longuet-Higgins, M.S. (1976). On the speed and profile of steep solitary waves. Proceedings of the Royal Society of London. A. Mathematical and Physical Sciences, 350(1661): 175-189. https://doi.org/10.1098/rspa.1976.0102
[10] Fenton, J.D., Rienecker, M.M. (1982). A fourier method for solving nonlinear water-wave problems: Application to solitary-wave interactions. Journal of Fluid Mechanics, 118: 411-443. https://doi.org/10.1017/S0022112082001141
[11] Okamoto, H. (2001). The mathematical theory of permanent progressive water-waves. World Scientific, 20. https://doi.org/10.1142/4547
[12] Hsiao, S.C., Lin, T.C. (2010). Tsunami-like solitary waves impinging and overtopping an impermeable seawall: Experiment and RANS modeling. Coastal Engineering, 57(1): 1-18. https://doi.org/10.1016/j.coastaleng.2009.08.004
[13] Jiang, C., Liu, X., Yao, Y., Deng, B., Chen, J. (2017). Numerical investigation of tsunami-like solitary wave interaction with a seawall. Journal of Earthquake and Tsunami, 11(01): 1740006. https://doi.org/10.1142/S1793431117400061
[14] Qu, K., Ren, X.Y., Kraatz, S. (2017). Numerical investigation of tsunami-like wave hydrodynamic characteristics and its comparison with solitary wave. Applied Ocean Research, 63: 36-48. https://doi.org/10.1016/j.apor.2017.01.003
[15] Cheng, D., Zhao, X.Z., Zhang, D.K., Chen, Y. (2017). Numerical study of dam-break induced tsunami-like bore with a hump of different slopes. China Ocean Engineering, 31: 683-692. https://doi.org/10.1007/s13344-017-0078-2
[16] Shao, K., Liu, W., Gao, Y., Ning, Y. (2019). The influence of climate change on tsunami-like solitary wave inundation over fringing reefs. Journal of Integrative Environmental Sciences, 16(1): 71-88. https://doi.org/10.1080/1943815X.2019.1614071
[17] Xiao, H., Huang, W. (2008). Numerical modeling of wave runup and forces on an idealized beachfront house. Ocean Engineering, 35(1): 106-116. https://doi.org/10.1016/j.oceaneng.2007.07.009
[18] Jiang, C., Liu, X., Yao, Y., Deng, B., Chen, J. (2017). Numerical investigation of tsunami-like solitary wave interaction with a seawall. Journal of Earthquake and Tsunami, 11(01): 1740006. https://doi.org/10.1142/S1793431117400061
[19] Wu, L. (2017). Study on the tsunami force of the superstructures of the medium and small span bridges. Southwest Jiaotong University.
[20] Yao, Y., Jia, M.J., Mao, D.W., Deng, Z.Z., Liu, X.J. (2020). A numerical investigation of the reduction of solitary wave runup by a row of vertical slotted piles. China Ocean Engineering, 34: 10-20. https://doi.org/10.1007/s13344-020-0002-z
[21] Khaware, A., Gupta, V., Srikanth, K., Sharkey, P. (2018). Sensitivity analysis of non-linear steep waves using VOF method. In Proceedings of the Tenth International Conference on Computational Fluid Dynamics (ICCFD10), Barcelona, Spain, pp. 9-13.
[22] Prabu, P., Bhallamudi, S.M., Chaudhuri, A., Sannasiraj, S.A. (2019). Numerical investigations for mitigation of tsunami wave impact on onshore buildings using sea dikes. Ocean Engineering, 187: 106159. https://doi.org/10.1016/j.oceaneng.2019.106159
[23] Yang, W., Li, S., Liu, J., Wu, W., Li, H., Wang, N. (2021). Numerical study on breaking solitary wave force on box-girder bridge. Advances in Bridge Engineering, 2(1): 1-29. https://doi.org/10.1186/s43251-021-00048-5
[24] De Chowdhury, S., Anand, K.V., Sannasiraj, S.A., Sundar, V. (2017). Nonlinear wave interaction with curved front seawalls. Ocean Engineering, 140: 84-96. https://doi.org/10.1016/j.oceaneng.2017.05.015
[25] Wei, Z., Dalrymple, R.A., Rustico, E., Hérault, A., Bilotta, G. (2016). Simulation of nearshore tsunami breaking by smoothed particle hydrodynamics method. Journal of Waterway, Port, Coastal, and Ocean Engineering, 142(4): 05016001. https://doi.org/10.1061/(ASCE)WW.1943-5460.0000334
[26] Ji, Q., Liu, X., Wang, Y., Xu, C., Liu, Q. (2020). Numerical investigation of solitary waves interaction with an emerged composite structure. Ocean Engineering, 218: 108080. https://doi.org/10.1016/j.oceaneng.2020.108080
[27] Luo, M., Reeve, D.E., Shao, S., Karunarathna, H., Lin, P., Cai, H. (2019). Consistent particle method simulation of solitary wave impinging on and overtopping a seawall. Engineering Analysis with Boundary Elements, 103: 160-171. https://doi.org/10.1016/j.enganabound.2019.03.012
[28] Ting-Chieh, L., Hwang, K.S., Hsiao, S.C., Ray-Yeng, Y. (2012). An experimental observation of a solitary wave impingement, run-up and overtopping on a seawall. Journal of Hydrodynamics, Ser. B, 24(1): 76-85. https://doi.org/10.1016/S1001-6058(11)60221-7
[29] Orimoloye, S., Horrillo-Caraballo, J., Karunarathna, H., Reeve, D.E. (2021). Wave overtopping of smooth impermeable seawalls under unidirectional bimodal sea conditions. Coastal Engineering, 165: 103792. https://doi.org/10.1016/j.coastaleng.2020.103792
[30] Kirkgöz, M.S., Mamak, M. (2004). Impulse modelling of wave impact pressures on vertical wall. Ocean Engineering, 31(3-4): 343-352. https://doi.org/10.1016/j.oceaneng.2003.07.001
[31] Allsop, W., Bruce, T., Pearson, J., Besley, P. (2005). Wave overtopping at vertical and steep seawalls. In Proceedings of the Institution of Civil Engineers-Maritime Engineering. Thomas Telford Ltd, 158(3): 103-114. https://doi.org/10.1680/maen.2005.158.3.103
[32] Cho, M., Shin, S., Yoon, H.D., Cox, D.T. (2017). Numerical simulation of tsunami force acting on vertical walls. Journal of Coastal Research, (79): 289-293. https://doi.org/10.2112/SI79-059.1
[33] Ning, D., Wang, R., Chen, L., Li, J., Zang, J., Cheng, L., Liu, S. (2017). Extreme wave run-up and pressure on a vertical seawall. Applied Ocean Research, 67: 188-200. https://doi.org/10.1016/j.apor.2017.07.015
[34] Müller, G.U., Whittaker, T.J.T. (1993). An investigation of breaking wave pressures on inclined walls. Ocean Engineering, 20(4): 349-358. https://doi.org/10.1016/0029-8018(93)90001-X
[35] Hedges, T.S., Reis, M.T., Owen, M.W. (1998). Random wave overtopping of simple sea walls: A new regression model. Proceedings of the Institution of Civil Engineers-Water Maritime and Energy, 130(1): 1-10. https://doi.org/10.1680/iwtme.1998.30223
[36] Kerpen, N.B., Schlurmann, T.O.R.S.T.E.N. (2016). Stepped revetments-revisited. In Proceedings of the 6th International Conference on the Application of Physical Modelling in Coastal and Port Engineering and Science (Coastlab16). Ottawa, Canada.
[37] Krecic, M.R., Sayao, O.J. (2003). Wave overtopping on Chicago shoreline revetment. In Coastal Structures. pp. 542-554. https://doi.org/10.1061/40733(147)45
[38] Schoonees, T.B., Kerpen, N.B., Liebisch, S., Schlurmann, T. (2018). Wave overtopping prediction of a gentle sloped stepped revetment. Coastal Engineering Proceedings, (36): 99-99. https://doi.org/10.9753/icce.v36.papers.99
[39] Kerpen, N.B., Schoonees, T., Schlurmann, T. (2019). Wave overtopping of stepped revetments. Water, 11(5): 1035. https://doi.org/10.3390/w11051035
[40] Chergui, F., Bouzit, M. (2022). Numerical simulation of solitary waves propagating on stepped slopes beaches. WSEAS Transactions on Fluid Mechanics, 17: 97-108. https://doi.org/10.37394/232013.2022.17.10
[41] Yang, W., Wen, Z., Li, F., Li, Q. (2018). Study on tsunami force mitigation of the rear house protected by the front house. Ocean Engineering, 159: 268-279. https://doi.org/10.1016/j.oceaneng.2018.04.034
[42] Zhan, J., Zhang, J., Gong, Y. (2016). Numerical investigation of air-entrainment in skimming flow over stepped spillways. Theoretical and Applied Mechanics Letters, 6(3): 139-142. https://doi.org/10.1016/j.taml.2016.03.003
[43] Guide, A.F.T. (2018). ANSYS fluent tutorial guide 18. ANSYS Fluent Tutorial Guide 18, 15317(April): 724-746.
[44] Fenton, J.D. (1999). The cnoidal theory of water waves. In Developments in Offshore Engineering. Gulf Professional Publishing, pp. 55-100. https://doi.org/10.1016/B978-088415380-1/50021-2