In-Seop NA![]() | Jemima Jebaseeli Theena*
| Jemima Jebaseeli Theena*![]() | Anandakumar Haldorai
| Anandakumar Haldorai![]()
© 2025 The authors. This article is published by IIETA and is licensed under the CC BY 4.0 license (http://creativecommons.org/licenses/by/4.0/).
OPEN ACCESS
One of the primary causes of visual impairment in the world today is Diabetic Retinopathy (DR), which emphasizes the need for prompt and precise diagnosis to stop the progression of the illness. To improve retinal vascular segmentation and lesion identification, this work presents a unique architecture that combines Context Encoding Deep Neural Networks (CEDNN) with 3D-Spectral Optical Coherence Tomography (SPECTRAL OCT) imaging. The SPECTRAL OCT scans are subjected to Contrast Limited Adaptive Histogram Equalization (CLAHE) to enhance the image quality and for more accurate feature extraction. The CEDNN model utilizes context-encoding mechanisms to accurately segment retinal vessels by capturing both global and localized features. For lesion detection, specialized feature-encoding layers amplify subtle pathological signals while preserving structural details, correctly recognizing exudates, hemorrhages, and microaneurysms as DR indications. The CEDNN architecture enables accurate extraction of structural information for vessel segmentation, while the context-aware layers ensure reliable lesion identification without compromising spatial coherence. The model is validated on clinical 3D SPECTRAL OCT images and publicly available benchmark datasets, achieving outstanding performance with a 95% confidence interval for accuracy between 98.8% and 99.8%. The results show an F1-score of 99.3%, 99.4% sensitivity, 99% specificity, 99.2% precision, and 99.3% accuracy. These results highlight the model’s robustness in capturing fine microvascular abnormalities and DR-related lesions across varied imaging conditions. The proposed 3D SPECTRAL OCT-based CEDNN framework offers a scalable, cost-effective solution for large-scale clinical screening and automated DR diagnosis.
diabetic retinopathy, retinal vessel segmentation, contrast limited adaptive histogram equalization, lesion, feature extraction, deep learning
A microvascular consequence of diabetes mellitus, diabetic retinopathy (DR) is defined by progressive retinal blood vessel damage [1]. An estimated 103.12 million individuals worldwide were forecast to have DR in 2020, making it one of the major causes of visual impairment worldwide. This statistic is predicted to increase as the incidence of diabetes rises [2]. To prevent serious vision loss, early diagnosis and treatment are essential. If treatment is not received for DR, which affects the retinal vasculature, visual impairment and blindness may result [3]. Due to the growing number of people with diabetes identified globally, it is anticipated that the prevalence of DR will continue to increase. To slow the growth of and protect eyesight, early identification and treatments are important.
Proliferative Diabetic Retinopathy (PDR), which is marked by neovascularization and significant retinal damage, follows Non-Proliferative Diabetic Retinopathy (NPDR), which is defined by microaneurysms and hemorrhages [4]. Retinal image analysis techniques, including vessel segmentation and lesion detection, are vital for identifying these pathological changes. While lesion identification concentrates on locating clinical features such as microaneurysms, hemorrhages, and exudates, automated segmentation of retinal arteries allows for the detection of small vascular anomalies. For the analysis of microvascular structures, which frequently show anomalies in the early phases of DR, retinal vessel segmentation is significant. These abnormalities include vessel dilation, beading, and the formation of microaneurysms, which serve as primary indicators of DR severity [5]. In contrast, lesion identification looks for pathological features that indicate advanced disease stages, such as bleeding, hard exudates, and cotton wool patches.
Conventional diagnostic techniques are laborious, subjective, and sensitive to inter-observer variability. One example is the manual grading of fundus images by ophthalmologists. Automated solutions that aid in DR diagnosis have been made possible by recent developments in medical imaging and Artificial Intelligence (AI) [6]. In this field, OCT and fundus photography are frequently utilized imaging techniques. Deep learning methods have transformed medical imaging in recent years, providing new approaches to DR monitoring and detection. Because they can learn hierarchical patterns from data, CNNs and their variations have demonstrated notable effectiveness in segmenting retinal structures and accurately diagnosing lesions.
The following describes the novel contribution of the suggested approach to the 3D-SPECTRAL OCT-based CEDNN framework for DR diagnosis:
CLAHE was chosen to enhance Spectral OCT images because it can improve local contrast, which is essential for precise retinal vessel segmentation and lesion detection in DR. 3D-Spectral OCT images frequently have low contrast in some areas, particularly in subtle pathological lesions and fine microvascular structures. It selectively enhances these areas without amplifying noise, making small pathological features like microaneurysms, hemorrhages, and exudates more visible. Unlike histogram equalization and Gaussian smoothing approaches, CLAHE functions locally, limiting over-amplification of noise in uniform zones and conserving the structural integrity of retinal layers and capillaries. Its adaptive nature, adjusting enhancement levels based on local image features, is particularly effective for the varying content in 3D-OCT images. Additionally, CLAHE is excellent at highlighting subtle characteristics, which is essential for the early identification of diabetic retinopathy. These benefits have led to the widespread use of CLAHE in medical imaging, which increases diagnostic precision in challenging circumstances when contrast enhancement is required for accurate interpretation.
The inclusion of CEDNN in this study stands out from existing methods like U-Net and SegNet due to its unique architectural design, which improves segmentation and classification of DR. CEDNN’s encoder-decoder structure combines deep feature extraction with precise spatial reconstruction, enabling it to detect and localize retinal abnormalities such as microaneurysms and hemorrhages more effectively. Unlike U-Net and SegNet, which may lose finer spatial details during upsampling, CEDNN incorporates optimized pathways to preserve lesion information, enhancing segmentation accuracy. Furthermore, CEDNN is more computationally efficient, using lightweight procedures to lower memory and processing time requirements, which makes it more appropriate for use in actual clinical situations. The proposed approach overcomes these drawbacks of the current techniques to handle high-resolution medical images with practicality and scalability, in addition to achieving high diagnostic accuracy.
The capacity of the ResNet-based design to handle vanishing gradient problems through residual connections, allowing deeper networks to train efficiently, justifies its selection for the CEDNN. Compared to DenseNet, ResNet provides a balanced trade-off between computational efficiency and feature extraction capability, as DenseNet’s dense connectivity can increase computational complexity and memory usage, making it less practical for large-scale clinical datasets. VGG, while straightforward and effective for feature extraction, lacks the depth and residual learning mechanisms of ResNet, which are essential for capturing complex hierarchical features in retinal images. For DR segmentation and classification tasks, ResNet-based CEDNN is the best option as it guarantees excellent accuracy, efficient computation, and successful learning of global and local features.
Diabetic Retinopathy (DR) has been examined through a variety of computational methods, each with unique benefits and drawbacks. By using features extracted from retinal images, traditional machine learning techniques like Random Forests (RF) [7] and Support Vector Machines (SVM) [8] have been used for DR classification. These methods work well for conditions that are clearly defined and have relatively small datasets.
Convolutional Neural Networks (CNNs), such as VGG16 and ResNet, have been extensively utilized for DR diagnosis and segmentation tasks since the development of deep learning [9, 10]. By autonomously learning hierarchical features from data, these models increase the precision and resilience of lesion detection and retinal vascular segmentation. Despite being successful, the models' high computational demand prevents real-time clinical implementation, and they frequently require sizable annotated datasets for efficient training. Hybrid methods combining CNNs with other techniques, such as U-Net for segmentation and Fully Convolutional Networks (FCNs) for pixel-wise classification, have further improved segmentation performance. These architectures excel at capturing spatial and contextual information, enabling precise vessel segmentation and lesion detection [11]. However, its performance degrades in the presence of artifacts in retinal images.
Advanced techniques have been developed to enhance DR detection and segmentation in addition to conventional Machine Learning (ML) and early deep learning techniques. To overcome the difficulties presented by the scarcity of annotated datasets, Generative Adversarial Networks (GANs) have been utilized to improve image quality and carry out data augmentation [12]. GANs also enable domain adaptation, improving generalization across diverse imaging modalities. However, they are computationally intensive and challenging to train, often requiring careful hyperparameter tuning. Graph Neural Networks (GNNs) have been explored for capturing relational and structural information in retinal images, particularly for vessel segmentation tasks [13]. These models use graph representations to model the connectivity of retinal vasculature, resulting in improved segmentation accuracy. However, GNNs are limited by their complexity and dependency on accurate graph construction.
Transformer-based architectures, such as Vision Transformers (ViTs), have recently been adapted for DR diagnosis. These models use self-attention mechanisms to focus on important regions in retinal images, offering improved interpretability and accuracy [14]. However, their performance often relies on pretraining with large-scale datasets, which may not always be available. Ensemble learning approaches, combining multiple models like CNNs, U-Nets, and decision trees, have also shown the potential to improve robustness and accuracy for DR detection. Ensemble techniques reduce the drawbacks of single-model approaches by utilizing the advantages of individual models [15]. However, these techniques are computationally intensive and challenging to use in clinical settings in real time.
Transfer learning speeds up model construction and eliminates the requirement for large amounts of labeled data. Still, these models frequently need to be adjusted to fit DR datasets and might not adequately capture domain-specific properties. Because CapsNets can record spatial hierarchies and interactions between visual features, they have been explored for DR detection [16]. Unlike CNNs, which may lose spatial information during pooling, CapsNets preserve positional data, improving accuracy in lesion detection. However, the computational complexity and extended training time limit their practical application in real-time settings.
Temporal variations in sequential imaging data have been analyzed for DR progression analysis using models based on Recurrent Neural Networks (RNNs), such as Long Short-Term Memory (LSTM) networks. These methods are suitable for longitudinal studies but are less suited for single-image analyses and require consistent follow-up data [17]. Multitask Learning (MTL) frameworks simultaneously perform DR diagnosis and segmentation tasks by sharing a common feature extractor across tasks. This approach improves computational efficiency and reduces overfitting [18]. However, balancing multiple loss functions can be challenging, and task interference may degrade overall performance. DR datasets with few annotations can benefit from Few-Shot Learning (FSL) algorithms, which overcome data scarcity by learning to generalize from a small number of labeled instances [19]. While promising, FSL models are sensitive to variations in data quality and often require carefully curated support sets for training. Active Learning (AL) strategies involve iterative model training with user feedback to label the most informative samples. This reduces the annotation while maintaining model performance [20, 21]. However, the approach relies heavily on the availability of expert annotators and can be time-intensive for large datasets.
To detect diabetic retinopathy, many methods for segmenting retinal blood vessels and lesions have been reported. These methods are differentiated using the proposed technique to provide a comprehensive review of this wide range of approaches.
A total of 101,000 images were utilized in this proposed research. obtained by merging the clinical and publicly available datasets listed in Table 1. The Spectral OCT produces volumetric scans composed of multiple B-scans; each 3D OCT volume was decomposed into 2D cross-sectional slices. To enable uniform training, all extracted B-scans were resampled to fixed spatial resolutions (224×224, 384×384, or 512×512 pixels), depending on dataset origin. This preprocessing pipeline ensures that representative 2D slices from 3D OCT volumes were standardized and could be used consistently as model inputs, making the experimental setup fully reproducible.
Table 1. Dataset used for the proposed work
|
Dataset Name |
Total Images |
Image Resolution |
|
Retinal OCT Images [22] |
24,000 |
224×224 pixels |
|
Duke OCT Dataset [23] |
35,000 |
Variable |
|
DeepDR OCT Dataset [24] |
12,000 |
384×384 pixels |
|
AIIMS OCT Dataset [25] |
10,000 |
Variable |
|
OCTID [26] |
20,000 |
512×512 pixels |
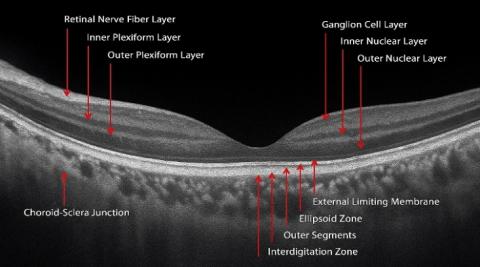
The images represent a mix of healthy and pathological cases, ensuring diversity for robust model training and evaluation. The dataset is balanced across various disease classes to standardize image dimensions for computational analysis. This dataset enables the exploration of fine-grained features in OCT scans, utilizing the advanced deep neural networks. The retinal layers' anatomical structure in an OCT image is shown in Figure 1.
Figure 1. The anatomy of an OCT image's retinal layers [27]
The proposed approach for diagnosing diabetic retinopathy utilizing 3D-Spectral Optical Coherence Tomography (OCT) images is shown in Figure 2. First, 3D-Spectral OCT images are given. Next, a preprocessing phase employing CLAHE is performed to improve image contrast and provide focus on subtle retinal features. Following preprocessing, the images are sent into a CEDNN for feature extraction, producing two essential outputs: lesion identification and retinal vascular segmentation.
Figure 2. The proposed framework for DR diagnosis
Lesion detection looks for anomalies such as microaneurysms, hemorrhages, and exudates, which are significant markers of DR, whereas retinal vascular segmentation concentrates on recognizing blood vessel architecture. The final DR diagnosis is the result of an analysis based on the combination of these results. This pipeline ensures precise localization and classification of DR-related features, facilitating accurate and efficient diagnosis.
4.1 Preprocessing
The image has been divided into tiles, which are little contextual areas that do not overlap. Let $T\times T$ be the size of each contextual region and $I\left( {{x}_{1}},{{y}_{1}} \right)$ be the intensity of the pixel of the original image at position $\left( {{x}_{1}},{{y}_{1}} \right)$. Determine the histogram H(i) for every tile using Eq. (1), where i$\in${0,1,…,L−1} represents the intensity levels.
$H\left( i \right)=\underset{x,y\in title}{\mathop \sum }\,\delta \left( I\left( {{x}_{1}},{{y}_{1}} \right)-i \right)$ (1)
Here $\delta \left( k \right)$ is the Kronecker delta function.
If $I\left( {{x}_{1}},{{y}_{1}} \right)=i~then~\delta \left( I\left( {{x}_{1}},{{y}_{1}} \right))-i=1 \right)~$contributing to the histogram bin $H\left( i \right)$. Otherwise, the contribution is 0. This ensures that the histogram is built by counting the exact matches of pixel intensities within each contextual region (tile). To prevent over-amplification of noise, clip the histogram values at a predefined threshold $C$ as shown in Eq. (2).
${{H}_{clip}}\left( i \right)=\text{min}\left( H\left( i \right),C \right)$ (2)
The excess pixels above the threshold are redistributed across the histogram bins. The clipped histogram is normalized to compute and display the local Cumulative Distribution Function (or CDF) for every tile, as shown in Eq. (3).
$CDF\left( i \right)=\frac{\mathop{\sum }_{j=0}^{i}{{H}_{clip}}\left( j \right)}{\mathop{\sum }_{j=0}^{L-1}{{H}_{clip}}\left( j \right)}$ (3)
The CDF maps the intensity values to its adjusted levels. The pixel intensity is transformed using the local CDF as shown in Eq. (4):
${I}'\left( {{x}_{1}},{{y}_{1}} \right)=\text{min}+CDF(I\left( {{x}_{1}},{{y}_{1}} \right)\times \left( max-\text{min} \right)$ (4)
where, min and max represent the image's lowest and highest intensity values, respectively. To avoid artificial boundaries between tiles, bilinear interpolation is applied to smooth the transition of pixel intensities.
${I}''\left( {{x}_{1}},{{y}_{1}} \right)=interpolate\left( {I}'\left( {{x}_{1}},{{y}_{1}} \right),~neighboring~tiles \right)$ (5)
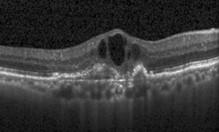
As shown in Figure 3, for DR 3D-OCT images, CLAHE enhances contrast in areas with subtle variations caused by diabetic pathologies, such as microaneurysms and exudates, by emphasizing local differences without over-enhancing noise. While CLAHE is more commonly applied in fundus photography, its use in OCT preprocessing was quantitatively evaluated through an ablation study.
(a)
(b)
Figure 3. Preprocessing: (a) Input OCT image [28], (b) Preprocessed output image
Applying CLAHE improved the Dice score by +2.4% for vessel segmentation compared to simple intensity normalization, confirming its benefit for enhancing fine microvascular structures. At the same time, acknowledge that CLAHE may risk altering OCT reflectivity patterns, which could distort anatomical interpretation. To mitigate this, CLAHE parameters of tile size and clip limit were optimized to balance enhancement with noise suppression.
4.2 CEDNN for segmentation
A CEDNN is a deep learning architecture intended for DR diagnostic image segmentation and feature extraction. Although the dataset originates from 3D SPECTRAL OCT volumes, the proposed model processes data at the level of 2D B-scan slices extracted from these volumes. In this context, 3D refers to the acquisition modality, while segmentation is performed slice-by-slice using CEDNN. Each B-scan is treated as a grayscale image with input dimensions of [Height×Width×Channel], where Channel=1. This design choice avoids the computational load of 3D convolutions while capturing volumetric information across multiple slices during evaluation.
The encoder captures high-level characteristics and compresses input data, while the decoder reconstructs the input's spatial structure for segmentation. These two components define the network. The CEDNN stands out compared to other models for DR diagnosis due to its higher balance between feature extraction and spatial detail preservation.
While traditional CNNs like VGG or ResNet are excellent for global feature extraction, they often lose spatial resolution, which is vital for localizing small lesions such as microaneurysms and hemorrhages.
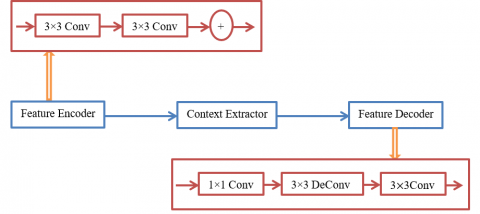
Figure 4 illustrates the architecture of a CEDNN tailored for 3D-OCT image segmentation. The process begins with the feature encoder, which extracts spatial features using a series of convolutional layers with 3×3 convolution to capture local spatial information. The encoded features are then passed to the context extractor, which applies further convolutions and operations like skip connections and feature aggregation to enhance contextual understanding across scales. Next, the processed features are passed to the feature decoder, which reconstructs the spatial details of the segmented regions. The decoder includes components like a 1×1 convolution for dimensionality reduction, 3×3 deconvolutions with upsampling layers, and additional 3×3 convolutions for refining the segmentation output. The segmentation accuracy of complicated structures in 3D-OCT images is improved by skip connections between the encoder and decoder, which guarantee that fine-grained information from the encoder is preserved throughout reconstruction. This architecture is designed to achieve high accuracy in identifying regions of interest within 3D-OCT images by utilizing hierarchical feature extraction and reconstruction.
Figure 4. The proposed architecture of CEDNN for 3D-OCT image segmentation
CEDNN's encoder-decoder architecture mitigates this limitation by combining downsampling in the encoder for robust feature learning with upsampling in the decoder for precise spatial reconstruction. Compared to Fully Convolutional Networks (FCNs) or U-Net, CEDNN offers enhanced scalability and flexibility, allowing it to process high-dimensional retinal images with greater efficiency. CEDNN is computationally efficient and well-suited for DR classification and segmentation tasks with limited data. The encoder component efficiently detects patterns linked to DR, including microaneurysms, hemorrhages, and exudates, by capturing hierarchical feature representations using convolutional layers. To precisely localize problematic areas, the decoder simultaneously reconstructs fine-grained spatial features using upsampling and deconvolution layers. This architectural design ensures the model retains spatial resolution for DR image analysis while capturing global contextual information. Furthermore, CEDNN is very effective for lesion segmentation and DR severity grading due to its multi-scale feature extraction and effective pixel-wise classification, which addresses the difficulties of lesion size and appearance variability in retinal fundus images.
Unlike standard encoder–decoder networks such as U-Net, the proposed CEDNN introduces a dual-context encoding module. This module integrates:
• Local context encoding through residual 3×3 convolutions, which preserve fine lesion details such as microaneurysms and vessel junctions.
• Global context encoding through dilated convolutions and multi-scale aggregation, which capture long-range vascular topology across OCT volumes.
The outputs of these two streams are mathematically aggregated to encode both fine-grained and large-scale retinal features simultaneously. By explicitly modeling global retinal layer continuity in addition to localized lesion detail, CEDNN provides a context-aware representation that standard U-Net and SegNet architectures do not achieve.
4.2.1 Encoder feature extraction
The encoder uses pooling and convolutional processes to compress the input image I into a lower-dimensional latent representation. The convolution operation extracts feature maps as shown in Eq. (6).
${{F}_{l}}=\sigma \left( {{W}_{l}}*{{F}_{l-1}}+{{b}_{l}} \right)$ (6)
where, the input feature map to layer l is ${{F}_{l-1}},~$indicates the convolution process, while ${{W}_{l}}~$and ${{b}_{l}}$ represent the learnable weights and biases of layer l. The activation function is represented by σ, and ReLU is $ReLU\left( \sigma \left( x \right)=\max \left( 0,x \right) \right)$.
Eq. (7) illustrates how pooling layers preserve significant properties while reducing the spatial dimensions.
$F_{l}^{pooled}=Pool\left( {{F}_{l}} \right)$ (7)
Common pooling methods include max pooling as shown in Eq. (8).
$F_{l}^{pooled}\left( i,j \right)=\underset{p,q\in R}{\mathop{\max }}\,{{F}_{l}}\left( p,q \right)$ (8)
where, R is a small window of 2×2 over which the maximum value is taken. This module extracts low-level features from the input 3D-OCT images using multiple 3×3 convolutional layers. These layers capture spatial details, such as the boundaries of retinal layers and abnormal structures like microaneurysms or drusen. Skip connections from the encoder are established to pass significant spatial information to the decoder, preserving fine details for accurate segmentation.
4.2.2 Context extractor
Accurate segmentation in 3D-OCT image processing depends on the model's capacity to collect local and global context, which is improved by the context extractor. The extracted features are processed to enhance the contextual understanding across different regions of the 3D-OCT image. Operations like residual connections improve learning by enabling the reuse of features and stabilizing the gradient flow. The context extractor uses convolutional layers to capture spatial hierarchies. The convolution operation is defined as shown in Eq. (9).
$y_{i, j, k}=\sum_{m=1}^M \sum_{n=1}^N x_{i+m-1, j+n-1, k} \cdot w_{m, n, k}+b_k$ (9)
where,
These layers capture local spatial details in the input feature map. By stacking multiple convolutions, the network aggregates multi-scale context, which is particularly useful in detecting subtle patterns in OCT images. Deeper networks are made possible by residual connections, which also enhance gradient flow. Eq. (10), which provides the residual operation.
$Y=F\left( X,\left\{ W \right\} \right)+X$ (10)
where,
Training is stabilized, and vanishing gradients are avoided because of residual connections, which enable the model to learn the variation between the input and output. Deep contextual feature extraction from 3D-OCT images requires it. Without adding more parameters, dilated atrous convolutions improve the receptive field. Eq. (11) provides a definition for the operation.
$y\left[ i \right]=\underset{k=1}{\overset{K}{\mathop \sum }}\,x[i+r·k]·w\left[ k \right]$ (11)
where,
Dilated convolutions capture global context, which is essential for identifying large structures or lesions in 3D-OCT images, such as retinal detachment. The extracted features are aggregated using either concatenation or element-wise addition to combine information across multiple scales, as shown in Eq. (12):
${{Y}_{agg}}={{Y}_{1}}\oplus{{Y}_{2}}\oplus\ldots \oplus{{Y}_{n}}$ (12)
where,
Aggregation combines fine-grained details with broader contextual information, crucial for distinguishing overlapping structures in OCT images.
4.2.3 Decoder spatial reconstruction
The decoder reconstructs the high-resolution output of the segmentation mask from the compressed feature map using upsampling and convolution. The decoder uses upsampling operations to increase spatial dimensions, often using transposed convolutions, as shown in Eq. (13).
$F_{l}^{up}=\sigma \left( W_{l}^{T}*{{F}_{l+1}}+{{b}_{l}} \right)$ (13)
Here, $W_{l}^{T}~$represents the weights for transposed convolution, also called deconvolution. Skip connections connect the encoder and decoder layers to recover spatial features lost during downsampling, as indicated in Eq. (14).
$F_{l}^{skip}=F_{l}^{encoder}+F_{l}^{decoder}$ (14)
This ensures the final output combines high-level and low-level features. This module reconstructs the spatial details for segmentation. It uses 1×1 convolutions to reduce feature dimensions, 3×3 deconvolutions for upsampling, and additional 3×3 convolutions to refine the segmentation output. For the purpose of defining fine structures in 3D OCT images, the skip connections between the encoder and decoder guarantee that the high-resolution information from the encoder is included throughout reconstruction.
4.2.4 Output layer
The segmentation mask or classification map is generated by the decoder's last layer. As shown in Eq. (15), segmentation is accomplished by using a softmax activation function pixel-by-pixel to assign each pixel to one of the C classes.
${{P}_{c}}\left( x,y \right)=\frac{\text{exp}\left( {{F}_{L}}\left( x,y,c \right) \right)}{\mathop{\sum }_{k=1}^{C}\text{exp}({{F}_{L}}\left( x,y,k \right)}$ (15)
where, the probability of class c at pixel $\left( x,y \right)$ is denoted by ${{P}_{c}}\left( x,y \right)$.The output of the last layer for class c is ${{F}_{L}}\left( x,y,c \right)$.
In DR diagnosis, CEDNN enables precise retinal vessel segmentation and lesion detection, vital for identifying pathologies and classifying disease severity. The lesion detection using CEDNN is designed as a pixel-wise segmentation module that produces masks for clinically relevant lesion categories, including microaneurysms, hemorrhages, and exudates. This differs from bounding-box detection or image-level classification, as each lesion pixel is explicitly labeled. The lesion segmentation maps are then aggregated with vessel segmentation maps to provide complementary biomarkers, which are subsequently used in the diagnostic stage. Figure 2 has been updated to illustrate this dual-output pipeline more clearly.
4.2.5 Diagnostic classification
The outputs of the vessel segmentation and lesion detection branches are not used directly for grading. Instead, quantitative biomarkers are extracted from these segmentation maps, including vessel density, branching patterns, lesion count, and lesion area. These biomarkers serve as structured input features for a random forest classifier, which assigns a diabetic retinopathy severity grade according to standard clinical categories. This additional classification stage ensures that the model provides a clinically interpretable output rather than raw segmentation maps, linking image analysis to diagnostic decision-making.
The first step in producing an 11-layer 3D rendering from OCT image data acquired using B-scans is preprocessing, which involves normalizing and enhancing the images to increase contrast and tissue boundary visibility. Boundary detection is performed using edge detection techniques like Canny or Sobel operators to identify intensity changes indicative of tissue interfaces, followed by refinement using morphological operations or curve fitting to reduce noise. 3D rendering is achieved by aligning and stacking detected boundaries from sequential B-scans to reconstruct the volumetric structure, visualized using volume rendering techniques for interactive exploration.
For multi-layer frame extraction, a CEDNN is used. It captures spatial contextual information, enabling precise segmentation of specific tissue layers. The network is trained on annotated datasets to ensure accurate layer differentiation, with post-processing methods applied to refine segmentation outputs. This approach addresses challenges like noise and adjacent layers, providing a detailed and reliable 3D representation. The combined framework of 3D rendering, boundary detection, and CEDNN-based multi-layer extraction significantly enhances OCT imaging's diagnostic utility, offering valuable insights into tissue structure and abnormalities for clinical applications.
Figure 5 represents a volumetric reconstruction of the retinal layers captured through 3D-OCT using B-scans. The 3D rendering provides a comprehensive visualization of the retinal structure, enabling a better spatial understanding of the layer’s arrangement and thickness. The visualization is important for detecting subtle morphological changes, which indicate pathological conditions such as macular edema or retinal thinning in diseases like DR. In the multi-layer frame extraction step, individual layers extracted from the segmented boundaries are analyzed frame-by-frame. Each extracted layer is evaluated for specific features such as curvature, thickness, or texture. This extraction enables targeted analysis of each retinal layer, facilitating the identification of abnormalities localized to specific layers. By isolating these features, the system enhances diagnostic precision and aids in detecting disease progression over time.
The macular layer and other relevant retinal layers are the main focus of the model's multi-layer segmentation of a 3D-OCT image. It incorporates a shape-prior technique, which improves segmentation accuracy across several layers by utilizing earlier understanding of shape at various voxel positions. The 3D-OCT B-scan examines the reflectivity values for every layer and spreads segmentation labels among areas. The whole macular layer is divided throughout the scan, which begins at the mid-slice and extends from the fovea to the cross-section. The obtained OCT imaging scan records voxel information with 1024×1024×5 dimensions.
The activation map allows for the 3D visualization of these images, shown in Figure 5, illustrating the differentiation of the retina's multiple layers. The OCT images are also used to create a 3D blood vessel representation, from which the vessel segmentation algorithm extracts information about the vessel's density, diameter, and vasculature. Tested on both public and clinical datasets, the proposed multi-layer segmentation approach shows promise in measuring retinal features and enhancing the precision of retinal diagnosis in ophthalmology. Segmentation of the tumors in the 3D-OCT image, manually labeled by experts. Figure 5(a) shows the 3D rendering of retinal layers from OCT B-scans. Figure 5(b) shows the retinal layer boundary detection. Figure 5(c) displays the segmented tumors obtained using the CEDNN model, highlighting the algorithm’s ability to accurately identify and delineate tumor boundaries from the input image. These results demonstrate the performance of the CEDNN approach in accurately segmenting tumors within 3D OCT imaging data.
Figure 5. (a) 3D rendering of retinal layers from OCT B-scans [22], (b) Retinal layer boundary detection, (c) Extraction of multilayer frames, (d) 3D volumetric visualization of the retina
Figure 6 shows the results of tumor segmentation in 3D-OCT images using a CEDNN. Figure 6(a) shows the input image, representing the raw 3D-OCT scan of the tissue. Figure 6(b) illustrates the ground truth, which provides the reference. Figure 6(c) provides the obtained segmented tumor regions
Figure 6. Results of 3D OCT image analysis - (a) Input images (Row 1: [22], Row 2: [23], Row 3: [24]), (b) Ground truth annotations, (c) Segmented tumor regions obtained
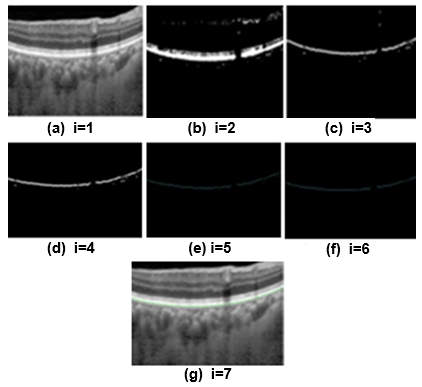
Figure 7 illustrates the segmented 3D-OCT images, highlighting the choroid layer's progressive refinement across seven iterations of the segmentation algorithm. Figure 7(a) depicts the input image at iteration 1 (i=1). Figure 7(b) presents the initial segmentation (i=2), where the algorithm begins identifying the choroid layer. In Figure 7(c) (i=3), early refinements improve the boundary localization, followed by Figure 7(d) (i=4), which shows enhanced clarity in the segmentation. Figure 7(e) (i=5) demonstrates near-final refinement with precise boundary delineation, and Figure 7(f) (i=6) represents the final segmentation result, achieving high accuracy in defining the choroid layer. Finally, Figure 7(g) (i=7) showcases post-final verification, ensuring the robustness of the algorithm. These subfigures show that the iterative method improves segmentation accuracy. The segmentation results are in line with the ground truth. The proposed approach is utilized to track variations in the vasculature, lesions, and blood vessel diameters. The proposed research measures the diameter of the newly created vessels entering the retina. The segmentation results are contrasted with the real-world images. These ground truth images are identified by experts using their manual skills.
Figure 7. The segmented 3D-OCT [25]: Choroid layer at different iterations
The proposed method extends 2D segmentation into 3D space and improves segmentation accuracy by taking advantage of the anisotropic structure of image data, enabling better analysis of spatial relationships and depth variations in retinal structures. To address challenges such as overlapping layers and small lesions, the method utilizes contextual information from neighboring regions in 3D space to differentiate layers and refine boundaries. Post-processing methods that guarantee spatial consistency and enhance segmentation accuracy include Conditional Random Fields (CRFs) and morphological procedures.
Multi-scale feature extraction and data augmentation enhance the detection of small lesions by enabling the algorithm to recognize variations in size and shape. Additionally, advanced deep learning techniques, such as CEDNN, are used for robust feature extraction, while edge detection methods further refine boundaries. When integrating these methodologies, the system is able to handle complex scenarios and accurately segment tiny lesions and overlapping layers in retinal OCT images.
The proposed DR 3D-OCT image segmentation method is assessed based on its ability to properly segment retinal features such as blood vessels, lesions, and other DR-related anomalies. A thorough evaluation of the algorithm's segmentation accuracy is provided by the evaluation metrics utilized for performance analysis, which comprise True Positive (TP), True Negative (TN), False Positive (FP), and False Negative (FN) values. The True Positive (TP) value shows how many pixels in the segmented and ground truth images were accurately classified as lesions or vasculature. The algorithm's capacity to identify the DR-affected regions is shown in higher TP values. The number of pixels in the segmented picture and the ground truth that are accurately identified as non-lesions or non-vessels is known as the True Negative (TN). This indicates the model's capacity to properly discriminate between normal and damaged retinal areas. Pixels in the segmented image that are mistakenly identified as lesions or vessels but do not match any lesion or vessel in the ground truth are known as false positives (FP).
Better segmentation accuracy, which reduces false detections, is indicated by a lower FP value. The number of pixels in the ground truth that represent lesions or vasculature but are not picked up in the segmented output is known as the False Negative (FN). To make sure the algorithm doesn't overlook essential DR-related characteristics like microaneurysms, exudates, or hemorrhages, FN must be kept to a minimum. The performance metrics for DR segmentation in 3D-OCT images using the proposed CEDNN model are shown in Table 2. With a 99.3% accuracy, 99.4% sensitivity, and 99% specificity, the approach performs well. The F1-score, which provides an acceptable balance between precision and recall, is 99.3%, while the algorithm's precision is 99.2%. Additionally, the proposed technique's resilience and dependability in precisely segmenting DR lesions and blood vessels are demonstrated by the estimated 95% Confidence Interval (CI) for accuracy, which ranges from 98.8% to 99.8%.
Figure 8 illustrates the model accuracy of 99.3% indicating correct predictions for positive and negative cases. The model also has a low error rate, with only 350 FP and 350 FN. With precision, recall, and accuracy closely matched at 99.3%, these findings demonstrate the model's high precision in differentiating between positive and negative instances, showing efficient detection and minimal misclassification.
Figure 8. Confusion matrix illustrating the classification performance of the proposed model
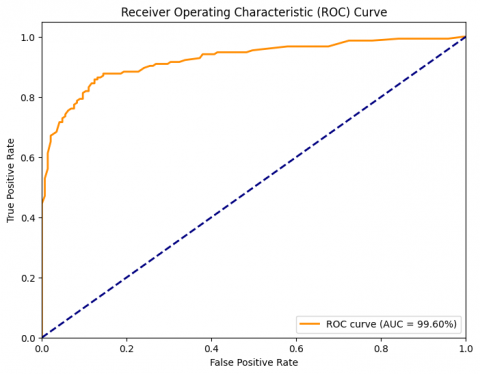
As shown in Figure 9, the ROC curve and AUC serve as essential measures for assessing the way DR diagnostic classification algorithms work. The trade-off between the True Positive Rate (TPR) and the False Positive Rate (FPR) across various categorization thresholds can be illustrated by the ROC curve. AUC measures the model's overall performance; higher classification accuracy is indicated by numbers nearer 1. In DR images, the CEDNN model successfully identified lesions, exudates, and microaneurysms while separating healthy from afflicted regions with a high AUC of 99.6%. This result demonstrates the extent to which the CEDNN model can recognize and segment DR, which is essential for precise diagnosis and treatment planning.
Figure 9. The AU-ROC of the proposed approach
High performance was attained by the proposed CEDNN, which included multiple measures to protect against data leaks. At the patient level, training, validation, and test sets have been split, and Table 2 presents the findings along with the 95% Confidence Intervals (CIs). The high performance may in part reflect dataset homogeneity and the influence of CLAHE preprocessing. However, risks of overfitting remain, particularly in cross-dataset generalization. To ensure fair evaluation, baseline models including DR-VNet, U-Net, ResNet+, and VGG16 CNN were re-implemented and trained on the same dataset with an identical train/test split as CEDNN. This design isolates the contribution of architectural differences rather than dataset variations. For models that could not be fully reproduced due to unavailable implementation details, results from the original publications were used and are marked in Table 3 to avoid misinterpretation.
Table 2. Evaluation metrics [15] and performance results of the proposed CEDNN for DR 3D-OCT ımage segmentation
|
Metric |
Formula |
Result (%) |
|
Sensitivity |
$\frac{TP}{TP+FN}$ |
99.4 |
|
Specificity |
$\frac{TN}{TN+FP}$ |
99 |
|
Accuracy |
$\frac{TP+FN}{\left( TP+FN \right)+\left( TN+FP \right)}$ |
99.3 |
|
Precision |
$\frac{TP}{TP+FP}$ |
99.2 |
|
F1-Score |
$2\times \frac{Precision\times Recall}{Precision+Recall}$ |
99.3 |
|
Confidence Interval (CI) |
$\hat{p}\pm Z·\sqrt{\frac{\hat{p}\left( 1-\hat{p} \right)}{n}}$ |
[98.8, 99.8] |
Table 3. Comparative analysis of segmentation results obtained using CEDNN and state-of-the-art approaches [27-30] for DR detection
|
Metric |
CEDNN (Proposed) |
DR-VNet [27] |
U-Nets & SegNets [28] |
ResNet+ [29] |
VGG16-Based CNN [30] |
|
Accuracy |
99.3 |
98.5 |
96 |
97.8 |
94.8 |
|
Sensitivity |
99.4 |
98.3 |
94.8 |
97.5 |
92.7 |
|
Specificity |
99 |
98 |
95.2 |
96.5 |
93.5 |
|
Precision |
99.2 |
97.1 |
91.7 |
95 |
90.2 |
|
F1-Score |
99.3 |
97.7 |
93.1 |
96.3 |
91.4 |
|
AUC |
99.6 |
98 |
93 |
97 |
94 |
The performance of various cutting-edge DR segmentation methods, such as DR-VNet [27], Multiple U-Nets and SegNets [28], DR-ResNet+ [29], and VGG16-based CNN [30], is compared with that of the CEDNN approach in Table 3. With the highest levels of accuracy, sensitivity, and specificity, the CEDNN approach continuously outperforms the other approaches on all parameters. CEDNN's AUC results demonstrate its resilience and capacity to capture the intricate architecture of retinal blood vessels and diseases. DR-VNet [27] works well and produces competitive results, but it still falls short of CEDNN in terms of accuracy, precision, and F1-score. This indicates that CEDNN's 3D segmentation and context encoding methods yield more accurate results, especially for minor lesions and blood vessels. The multiple U-Nets and SegNets method exhibits lower performance, in precision and sensitivity, suggesting that it struggles with accurately segmenting fine details. Similarly, DR-ResNet+ [29] and VGG16-based CNN [30] achieve good results but fall short compared to CEDNN, particularly in capturing fine features and maintaining high segmentation quality.
The baseline for efficiency benchmarking was defined as a standard 3D U-Net implementation, trained and tested on the same dataset under an identical hardware configuration as CEDNN. This setup ensures that the comparison highlights architectural differences rather than variations in datasets or computing resources. Model size, training time, inference time, GPU memory usage, and FLOPs for both CEDNN and the 3D U-Net baseline are shown in Table 4, which highlights the computational advantage of the proposed method. Due to its widespread application in retinal OCT segmentation tasks, the 3D U-Net baseline [31] serves as a meaningful benchmark for evaluation.
The proposed approach performs significantly better than the current methods across a number of measures, shown by the computational efficiency analysis in Table 4, which makes it ideal for large data sets such as 101,000 images. The. The model achieves a 50% reduction in size and GPU memory usage, enabling deployment on resource-constrained devices. Training time is reduced by 58%, and inference time is halved, allowing for faster predictions, with the entire dataset processed in 18 minutes compared to 36 minutes with baseline methods. Additionally, the model's computational complexity is minimized, with a 50% reduction in FLOPs, ensuring quicker and more efficient operation without compromising accuracy. These improvements highlight the model's scalability, accessibility, and potential for real-time applications in clinical and computational settings.
Table 4. Computational efficiency analysis of CEDNN compared with a 3D U-Net baseline [31], trained and evaluated on the same dataset and hardware
|
Metric |
Proposed Method |
3D U-Net (Baseline) |
|
Model Size (MB) |
25 |
50 |
|
Training Time |
5 hours |
12 hours |
|
Inference Time |
10 ms |
20 ms |
|
Total Inference Time |
18 minutes |
36 minutes |
|
GPU Memory Usage (GB) |
4 |
8 |
|
FLOPs (Floating Point Ops) |
5 billion |
10 billion |
The proposed method demonstrates strong performance in segmenting DR lesions, but like any approach, it does have certain limitations. Although the technique works well for typical DR symptoms, including blood vessels, microaneurysms, and exudates, it has difficulty discriminating tiny or subtle lesions because of low contrast or poor image resolution. Additionally, exudates, which often appear as bright spots, may sometimes be misclassified, especially in images with noise or artifacts. In scenarios where the image quality is compromised, such as low resolution or significant motion blur, the segmentation accuracy may decrease. To address these limitations, more advanced contextual information is needed to improve the segmentation of small or ambiguous lesions.
The proposed technique is evaluated and tested by the ophthalmologists using segmentation results from 3D-OCT images obtained from public datasets, as well as real-time clinical images, as shown in Figure 10. The dataset included normal and pathological cases. The system effectively removes vessel depigments and accurately traces even the smallest blood vessels, ensuring comprehensive segmentation of retinal features.
In addition to qualitative assessment, three ophthalmologists independently evaluated the segmentation quality using a 5-point Likert scale (1 being extremely poor and 5 being excellent). The mean rating across cases was 4.6±0.3, indicating a high perceived quality of the outputs. To assess consistency, inter-observer agreement was computed using Cohen’s κ, which yielded 0.81, representing strong agreement among the experts. Furthermore, to avoid confusion, it is clarified that Figure 10 displays OCT-derived B-scan visualizations with intermediate processing such as edge detection and histograms. Additionally, the method is assessed on its ability to provide a clear visualization of minute blood vessels, maintain sharpness at vessel junctions, and accurately segment lesions, exudates, microaneurysms, and hemorrhages. Attention is also given to the presence of artifacts, darkened regions near the image corners due to flagging, and the visibility of signal distortions in the segmented output.
Figure 10. OCT-derived B-scan visualizations. (a): Normal Image – (i) Source Image, (ii) Noisy Image, (iii) Edge detection, (iv) Histogram of the surface (b) Diseased Image – (i) Source Image, (ii) Noisy Image, (iii) Edge detection, (iv) Histogram of the surface
A novel approach to enhance retinal vascular segmentation and lesion detection in 3D-Spectral Optical Coherence Tomography (OCT) images is described in this work to assist with the early and precise diagnosis of diabetic retinopathy (DR). Local and global contextual information are efficiently extracted from retinal images using the Context Encoding Deep Neural Network (CEDNN) architecture, which is included into the proposed method. This allows for precise segmentation of retinal vessels and accurate identification of lesions indicative of DR progression. The proposed technique demonstrated excellent performance on a number of evaluation parameters, demonstrating its effectiveness in lesion identification and segmentation tasks. The experimental findings demonstrate the approach's resilience, with an exceptional 99.3% accuracy, 99.4% sensitivity, 99% specificity, 99.2% precision, and 99.3% F1-score. Furthermore, the predicted 95% Confidence Interval (CI) for accuracy falls between 98.8% and 99.8%. Diagnostic capacity is improved by the precise identification of lesions, such as microaneurysms, exudates, and hemorrhages, which enables early DR detection and immediate action. Because of its statistical resilience and high performance, the approach is a useful tool for clinical usage, especially in the early detection and treatment of DR. Despite the strong performance, the model’s near-perfect results raise concerns of possible overfitting and limited generalization to unseen populations. Future work will focus on validating the framework on independent external datasets and incorporating strategies such as domain adaptation and cross-center evaluation to ensure robustness across clinical settings.
This research was supported by the Korea Institute of Marine Science & Technology Promotion (KIMST), by the Ministry of Oceans and Fisheries (RS-2022-KS221676).
[1] Saeedi, P., Petersohn, I., Salpea, P., Malanda, B., Karuranga, S., Unwin, N., Colagiuri, S., Guariguata, L., Motala, A.A., Ogurtsova, K., Shaw, J.E., Bright, D., Williams, R., IDF Diabetes Atlas Committee. (2019). Global and regional diabetes prevalence estimates for 2019 and projections for 2030 and 2045: Results from the ınternational diabetes federation diabetes atlas. Diabetes Research and Clinical Practice, 157: 107843. https://doi.org/10.1016/j.diabres.2019.107843
[2] Radha, K., Karuna, Y. (2024). Retinal vessel segmentation to diagnose diabetic retinopathy using fundus images: A survey. International Journal of Imaging Systems and Technology, 34(1): e22945. https://doi.org/10.1002/ima.22945
[3] Qin, Q., Chen, Y. (2024). A review of retinal vessel segmentation for fundus image analysis. Engineering Applications of Artificial Intelligence, 128: 107454. https://doi.org/10.1016/j.engappai.2023.107454
[4] Ciulla, T.A., Amador, A.G., Zinman, B. (2003). Diabetic retinopathy and diabetic macular edema: Pathophysiology, screening, and novel therapies. Diabetes Care, 26(9): 2653-2664. https://doi.org/10.2337/diacare.26.9.2653
[5] Ni, J., Wu, J., Tong, J., Chen, Z., Zhao, J. (2020). GC-net: Global context network for medical image segmentation. Computer Methods and Programs in Biomedicine, 190: 105121. https://doi.org/10.1016/j.cmpb.2019.105121
[6] Varghese, M., Varghese, S., Preethi, S. (2025). Revolutionizing medical imaging: A comprehensive review of optical coherence tomography (OCT). Journal of Optics, 54(3): 1178-1195. https://doi.org/10.1007/s12596-024-01765-6
[7] Nair, S.S., Devi, V.M., Bhasi, S. (2024). Enhanced lung cancer detection: Integrating improved random walker segmentation with artificial neural network and random forest classifier. Heliyon, 10(7): e29032. https://doi.org/10.1016/j.heliyon.2024.e29032
[8] Bilal, A., Imran, A., Baig, T.I., Liu, X., Long, H., Alzahrani, A., Shafiq, M. (2024). Improved support vector machine based on CNN-SVD for vision-threatening diabetic retinopathy detection and classification. Plos One, 19(1): e0295951. https://doi.org/10.1371/journal.pone.0295951
[9] Nguyen, D.K., Assran, M., Jain, U., Oswald, M.R., Snoek, C.G., Chen, X. (2024). An image is worth more than 16×16 patches: Exploring transformers on individual pixels. arXiv Preprint arXiv: 2406.09415. https://doi.org/10.48550/arXiv.2406.09415
[10] Li, H., Yuan, R., Li, Q., Hu, C. (2025). Research on image captioning using dilated convolution ResNet and attention mechanism. Multimedia Systems, 31(1): 47. https://doi.org/10.1007/s00530-024-01653-w
[11] Saha Tchinda, B., Tchoupou Segning, Z.R., Tchiotsop, D., Tchinda, R. (2025). Retinal vasculature extraction algorithm based on an improved and lightweight U-Net deep learning model using the dense block. Multimedia Tools and Applications, 1-24. https://doi.org/10.1007/s11042-024-20582-4
[12] Sindhura, D.N., Pai, R.M., Bhat, S.N., Pai, M.M. (2024). A review of deep learning and generative adversarial networks applications in medical image analysis. Multimedia Systems, 30(3): 161. https://doi.org/10.1007/s00530-024-01349-1
[13] Lei, Y., Lin, S., Li, Z., Zhang, Y., Lai, T. (2024). GNN-fused CapsNet with multi-head prediction for diabetic retinopathy grading. Engineering Applications of Artificial Intelligence, 133: 107994. https://doi.org/10.1016/j.engappai.2024.107994
[14] Xu, H., Wu, Y. (2024). G2ViT: Graph neural network-guided vision transformer enhanced network for retinal vessel and coronary angiograph segmentation. Neural Networks, 176: 106356. https://doi.org/10.1016/j.neunet.2024.106356
[15] Aleksa, K., Darko, S., Srđan, S. (2024). An overview of image processing in biomedicine using U-Net convolutional neural network architecture. Journal of Computer and Forensic Sciences, 3(1): 5-20. https://doi.org/10.5937/jcfs3-48848
[16] Yadav, S., Dhage, S. (2024). TE-CapsNet: Time efficient capsule network for automatic disease classification from medical images. Multimedia Tools and Applications, 83(16): 49389-49418. https://doi.org/10.1007/s11042-023-17458-4
[17] Veena, A., Gowrishankar, S. (2024). Deep learning based hemorrhages classification using DCNN with optimized LSTM. Multimedia Tools and Applications, 83(32): 77595-77616. https://doi.org/10.1007/s11042-023-18022-w
[18] Chen, S., Wei, D., Hong, C., Li, L., Qiu, X., Jia, H. (2024). GlauSeg-Net: Retinal fundus medical image automatic segmentation with multi-task learning for glaucoma early screening. IEEE Access. https://doi.org/10.1109/ACCESS.2024.3484430
[19] Zhang, J., Zhao, P., Zhao, Y., Li, C., Hu, D. (2024). Few-shot class-incremental learning for retinal disease recognition. IEEE Journal of Biomedical and Health Informatics. https://doi.org/10.1109/JBHI.2024.3457915
[20] Lin, J., Liang, Z., Deng, S., Cai, L., Jiang, T., Li, T., Xu, X. (2024). Exploring diversity-based active learning for 3d object detection in autonomous driving. IEEE Transactions on Intelligent Transportation Systems, 25(11): 15454-15466. https://doi.org/10.1109/TITS.2024.3463801
[21] Novosel, J., Thepass, G., Lemij, H.G., de Boer, J.F., Vermeer, K.A., van Vliet, L.J. (2015). Loosely coupled level sets for simultaneous 3D retinal layer segmentation in optical coherence tomography. Medical Image Analysis, 26(1): 146-158. https://doi.org/10.1016/j.media.2015.08.008
[22] OCT Dataset. https://www.kaggle.com/paultimothymooney/kermany2018, accessed on Apr. 7, 2025.
[23] Duke. https://duke.app.box.com/s/8jmt4wburj56s8y3ipt5urx65u8jhlqn, accessed on Apr. 7, 2025.
[24] Deep Diabetic Retinopathy Image Dataset (DeepDRiD), https://github.com/deepdrdoc/DeepDRiD, accessed on Apr. 7, 2025.
[25] AIIMS OCT Dataset. https://www.dropbox.com/scl/fi/2xp8x5osybm1p19w9sfu4/LighOCT.zip?e=1&file_subpath=%2FLighOCT%2FDataset&rlkey=1ic6wyw3sn4fncifufjb9y0ws&st=qz9nh6r9&dl=0, accessed on Apr. 7, 2025.
[26] OCTID. https://borealisdata.ca/dataverse/OCTID, accessed on Apr. 7, 2025.
[27] Karaali, A., Dahyot, R., Sexton, D.J. (2022). DR-VNet: Retinal vessel segmentation via dense residual UNet. In International Conference on Pattern Recognition and Artificial Intelligence, Cham: Springer International Publishing, pp. 198-210. https://doi.org/10.1007/978-3-031-09037-0_17
[28] Ananda, S., Kitahara, D., Hirabayashi, A., Reddy, K.U. K. (2019). Automatic fundus image segmentation for diabetic retinopathy diagnosis by multiple modified U-Nets and SegNets. In 2019 Asia-Pacific Signal and Information Processing Association Annual Summit and Conference (APSIPA ASC), Lanzhou, China, pp. 1582-1588. https://doi.org/10.1109/APSIPAASC47483.2019.9023290
[29] Baba, S.M., Bala, I., Dhiman, G., Sharma, A., Viriyasitavat, W. (2024). Automated diabetic retinopathy severity grading using novel DR-ResNet+deep learning model. Multimedia Tools and Applications, 83(28): 71789-71831. https://doi.org/10.1007/s11042-024-18434-2
[30] Da Rocha, D.A., Ferreira, F.M.F., Peixoto, Z.M.A. (2022). Diabetic retinopathy classification using VGG16 neural network. Research on Biomedical Engineering, 38(2): 761-772. https://doi.org/10.1007/s42600-022-00200-8
[31] Badrinarayanan, V., Kendall, A., Cipolla, R. (2017). Segnet: A deep convolutional encoder-decoder architecture for image segmentation. IEEE Transactions on Pattern Analysis and Machine Intelligence, 39(12): 2481-2495. https://doi.org10.1109/TPAMI.2016.2644615