Furkan Balcı![]()
© 2023 IIETA. This article is published by IIETA and is licensed under the CC BY 4.0 license (http://creativecommons.org/licenses/by/4.0/).
OPEN ACCESS
Owing to the reliability of biometric data, person identification systems are developed using many different biometric data. However, these systems can be easily fooled with prosthetic face masks, contact lenses and fingerprint tapes. EEG signal is considered to be the most difficult biometric data to copy. The main reason why EEG-based identification systems have not become widespread is that their accuracy performance is not stable. In this study, an EEG based identification system DM-EEGID with improved accuracy performance is proposed. In this approach, first of all, the channels that are meaningless and reduce the accuracy performance from the high number of channels used as input data should be filtered out. Therefore, a Random Forest based binary feature selection method is recommended. With this algorithm, it has been determined that the optimum number of channels for the highest percentage of accuracy in the 64-channel data set is 48-channel. Then, for the determination of the most distinctive frequency subcomponent, the delta pattern was determined to be the most appropriate frequency component by inter-section correlation coefficient analysis. Finally, the proposed approach was tested with hybrid Attention-based LSTM-MLP supported by optimum parameters with both eyes closed and eyes open resting state EEG recording. The proposed model reached 99.96% and 99.70% accuracy percentages for eyes-closed and eyes-open datasets, respectively. These results show that this proposed approach has the potential to be applied in closed systems where the number of people is limited.
biometric identification, LSTM, deep learning, electroencephalography, machine learning
User identification systems and systems to identify users registered in the system are essential for security. In these systems, there is the input data of the users and a machine that controls this data. In the last two decades, passwords or smart ID cards are not very useful for a secure identification system and not very useful due to security issues as they are easily copied. For this reason, its usability in person identification systems has been studied due to its reliability against the risk of copying with biometric-based systems. Biometric identification systems use users' biometric data as input data. These data, which are used as inputs, are encrypted and stored in the database. Two different types of data are used for biometric person identification systems: Physiological and behavioural. Fingerprints, iris, face, and hand geometry are examples of physiological biometric data. Data such as voice, gestures, keystrokes on the keyboard, signature, and EEG can be given as examples of behavioural biometric data. In systems that are designed using biometric data, steps such as signal processing, pattern extraction, and comparing the extracted pattern with the user data in the database are applied to the biometric data of the users. Data such as iris, retina, face, voice, fingerprint, and palm print can be given as examples of biometric data, which are frequently used today [1-9]. However, systems designed using these biometric data can be easily fooled. For example, fingerprints can be copied with fingerprint tapes, the face of the person can be copied with prosthetic masks, and the iris can be copied with contact lenses. These biometric data, shown as examples, can be obtained by malicious attackers.
Electroencephalography (EEG) signals are biopotentials formed from brain activities. EEG signals are obtained with the help of electrodes. EEG signals are highly affected by emotional changes and the person's environment. That's why EEG signals are pretty unstable in different situations. In recent years, EEG data has been used in biometric authentication studies. It has many advantages over ordinary biometric data because it has uniqueness and non-replicability. In particular, the fact that the EEG signal is related to the person's past life, the gyrus and sulcus shapes in the brain, stress status, and mood makes it unique [10]. However, due to the formation of a stressful environment when the EEG signal is received without the person's consent, a different signal occurs then the standard resting state EEG signal. Therefore, it cannot be copied. Although EEG-based identification systems are still a new field of study, successful studies in the literature prove that other biometric data are an alternative method [11]. However, there are still some difficulties for EEG-based identification systems. EEG signals have a low signal-to-noise ratio. A low signal-to-noise ratio is a factor that reduces the accuracy of identification. Accuracy rates in studies in the literature range from approximately 80% to 95%. However, different parameters also affect the accuracy of the identification systems. Some of these parameters are related to EEG recorders. The number of channels, sampling frequency, and recording time can be given as examples of the parameters related to the recorder. These parameters directly affect the amount of data. Although a large amount of data seems good, it sometimes reduces accuracy, especially in deep learning-based artificial intelligence techniques. Therefore, the optimum number of channels should be determined and the optimum accuracy value should be reached. The way to do this is through feature selection. Feature selection affects the performance of classification algorithms. It is crucial to select meaningful data for the algorithm. A large number of feature spaces often reduces the accuracy value. At the same time, reducing the amount of data used by the algorithm also shortens the processing time of the algorithm [12]. The most suitable deep learning algorithms for time series data are Recurrent Neural Network (RNN) and Long Short Term Memory Algorithm (LSTM), inspired by RNN architecture. However, the accuracy of EEG-based identification studies designed using LSTM or RNN algorithms in the literature is not high for real-life use. Detailed information about these studies will be shared in the Related Works section. To briefly mention in this section, neither LSTM nor RNN architecture alone is insufficient for classification. Therefore, hybrid algorithms are needed using these algorithms. In this study, an Attention-based LSTM-based hybrid algorithm has been developed. The algorithm is designed to work with any machine learning classifier. This way, the optimum machine learning method that will improve the deficiencies of the LSTM structure can be selected.
To solve the problems mentioned above, DM-EEGID architecture is proposed in this study. This architecture is a hybrid deep-machine learning algorithm. This proposed approach uses a Random Forest-based embedded feature selection algorithm to determine the optimum number of channels for the highest accuracy performance. With these analyzes, a complete EEG-based identification system is designed. The hybrid Attention-based LSTM-MLP algorithm is trained with the EEG dataset recorded with the eyes closed with the highest accuracy value of 99.96%. If the literature contributions of the designed DM-EEGID algorithm are listed as a result of the study:
·A random Forest-based binary random forest feature selection approach is recommended to identify the most effective channels for classification.
·Thanks to the attention mechanism added to the LSTM algorithm, the most distinctive features of the channels, which are the output of the binary RF feature selection algorithm, are automatically searched to ensure that the algorithm can work correctly against EEG data received from users at different times and places.
·A hybrid Attention-based LSTM-MLP algorithm using RF feature selection has been developed for user identification.
·In the literature, “Which frequency subcomponent should be used in identification?” In order to answer the question, the performance of the algorithm was analyzed by both statistical methods and testing each frequency subcomponent in the algorithm.
·Another question in the literature is “What are the appropriate channels and the optimum number of channels for the highest accuracy?” In order to answer the question, the channels determined in the literature and the channels suggested by this study were tested.
The remainder of the article is organized as follows: Part 2 reviews studies in the literature. Chapter 3 explains the dataset used in the study, the feature selection algorithm, and the designed hybrid classification algorithm. Section 4 is the section where the performances of the developed algorithm under various conditions are examined and discussed in detail. Finally, chapter 5 summarizes the tests performed in this article and provides information about the results and possible future work.
This section gives a summary of previous studies on identification designed using EEG biometric data. EEG signals emerge as a result of electrical activities in the brain. It is suitable data for biometric authentication systems because EEG signals are protected against attacks. Furthermore, EEG signals are the subject of artificial intelligence studies. This way, supportive systems are created for clinicians to make decisions. Artificial intelligence techniques are also used in identification systems. EEG-based identification algorithms were generally implemented using machine learning or deep learning methods. However, contrary to these, some systems are implemented using techniques such as Automatic Regression (AR). EEG-based identification studies started to be recommended before the 2000s. Different approaches have been proposed in the literature using different algorithms. Some of the algorithms used: Support Vector Machine (SVM), Random Forest (RF), Bayesian Network, Naive Bayes, k Nearest Neighborhood (kNN), Linear Discriminant Analysis (LDA), Elemental Neural Network (ENN), Classification and Regression Tree (CART), XGBoost, Incremental Fuzzy-rough Nearest Neighbor (FRNN), Multi-layer Perceptron (MLP), Convolutional Neural Network (CNN), Long Short Term Memory (LSTM) and Recursive Neural Network (RNN).
The accuracy rate decreases in applications that do not have Complete EEG-based identification systems because methods such as feature selection and channel selection are not generally used. However, in some studies, the classification algorithms used were chosen from ordinary algorithms. It is challenging to achieve high accuracy when classifying complex signals such as EEG with these algorithms. Most of the studies in the literature are not have a complete EEG-based identification system. In a complete EEG-based identification system, there should be channel selection, EEG pattern selection, and appropriate algorithm parts. These steps are missing in most studies in the literature. Some studies did not decompose the EEG signal into patterns [11]. In some studies, channel selection was not made. Works are carried out using all channels.
In this part of the study, EEG-based identification studies in the literature are reviewed. In addition, studies will be summarized comparatively. Different criteria such as algorithm used in the comparison, number of subjects, number of recorder channels, dataset, and EEG patterns were used. According to the data used, the studies can be examined under four main headings. These are: (i) data received during a motor function, (ii) data received during a visual stimulus, (iii) data received during both visual and motor function, and (iv) data received at rest. However, since there is no consensus on which EEG pattern should be used, different patterns were used in each study. The studies in the literature are summarized in Table 1. When the table is examined, the low number of people increases the accuracy performance. This proves that EEG-based systems can be used in closed systems where the number of people is low.
Table 1. Comparison of different works on biometric authentication techniques
|
References |
Number of Subjects |
Number of Channels |
EEG Pattern |
Objective |
Accuracy % |
Dataset |
|
[13] |
109 |
64 |
γ |
Multiple related tasks are performed simultaneously. EEG signals recorded with left hand movement and eyes open tasks were classified using Two-layer Neural Networks algorithm by extracting the features such as mean and standard deviation. |
95.60 |
[32] |
|
[14] |
7 |
6 |
All |
Discrete Wavelet transform, log energy entropy, sample entropy and auto-regressive coefficients features were applied to EEG data collected as a result of different tasks (resting state, solving math problem, visual counting, geometric figure rotation). In addition, the effect of channels' positions on EEG identification was investigated. Classical SVM and Bayesian Network were used as classification algorithms. |
95 |
[33] |
|
[15] |
20 |
19 |
All |
Power Spectral Density was used as feature extraction. In addition, the effect of visual stimuli on identification was investigated. In classification, kNN and LDA algorithms were used. |
94.95 |
Special |
|
[16] |
109 |
4, 16, 32, 64 |
γ |
Identification was made with 1D Convolutional LSTM architecture using motor movements (fists and feet). |
99.58 |
[32] |
|
[17] |
8 |
9 |
θ |
Identification was made with a CNN-based approach using low-frequency SSVEP data from the retina. |
97 |
Special |
|
[18] |
100 |
256 |
All |
Features were extracted from the EEG data obtained as a result of the driving fatigue experiment with AR and FFT methods. The CNN-based identification system classifies it. |
97 |
[34] |
|
[19] |
109 |
46, 64 |
α, β |
An identification system with fuzzy entropy and Power Spectral Density based features is designed using CNN with motor movements EEG records (fists and feet). In particular, the issue of stability of EEG biometrics was mentioned. |
99.94 |
[32] |
|
[20] |
8 |
14 |
δ |
It is aimed to design a low-cost system. Therefore, only an LSTM-based classifier is designed. |
89.5 |
Special |
|
[21] |
109 |
56 |
All |
By performing network analysis on a set of EEG features, it combined 10 single-channel features (seven spectral and three non-linear) and 10 multi-channel features, creating a distance-based classifier for authentication. |
98.93 |
[32] |
|
[22] |
32 |
5, 32 |
α, β, γ, θ |
The performance of algorithms such as RNN, CNN-LSTM, CNN is analyzed with the features obtained using Power Spectral Density and spectral coherence. During the recording, it is aimed for the subjects to rate the music videos. |
97.97 |
[35] |
|
[23] |
20 |
7 |
θ, δ |
It is aimed to EEG-based user identification and authentication with SSVEP and ERP. LSTM is used as the classification algorithm. |
91.44 |
Special |
|
[24] |
105 |
8, 16, 64 |
All |
Classification is performed with classical LSTM by using SVM-based feature selector with EEG data recorded in fist tightening or relaxation states. |
91.44 |
Special |
|
[25] |
20 |
4 |
All |
Identification is made with SVM and DNN algorithms by applying Wavelet transform to the EEG data recorded while showing circles with varying contrasts. |
97 |
Special |
|
[26] |
37 |
64 |
All |
SVM based identification system is designed with combined eye tracking and EEG data. |
98.28 |
[31, 36] |
|
[27] |
16 |
32 |
All |
An identification system was designed with SVM classifier by using EEG data recorded by showing self and non-self images and Fisher distance features. |
90.7 |
Special |
|
[28] |
109 |
1 |
All |
The optimum classification result is investigated using only one channel EEG data. SVM and LDA algorithms were used as classifiers. |
82.58 |
[32] |
|
[29] |
37 |
8 |
α, β |
FRNN based identification system uses cross-correlation, coherence, and Hjorth parameter attributes. |
95.1 |
Special |
|
[30] |
26 |
56 |
All |
It is aimed to EEG-based user identification and authentication with a low-density EEG recorder with SVM classifier. |
95 |
Special |
|
[31] |
109 |
14 |
All |
A low-cost CNN-based model was designed using resting-state EEG recordings. By keeping the number of channels very low, the desired optimum accuracy has been achieved. |
99.32 |
[32] |
EEG Pattern: Symbols of 5 different frequency bands mentioned in the method section are used. The "All" label is used for the studies that use it without separating into the frequency bands. Dataset: If the data set obtained from the relevant article is used, the label "Special" is written.
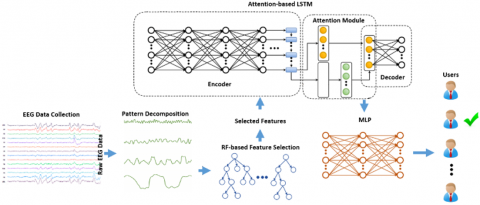
Figure 1. The architecture of the proposed approach
EEG signals collected in the designed architecture are firstly decomposed into frequency subcomponents. Then for channel selection, the delta pattern Binary Random Forest-based Feature Selection algorithm selects features that will improve accuracy performance. Finally, selected features are classified using the Hybrid Attention-based LSTM-MLP algorithm.
In this study, a high-accuracy Electroencephalography-based identification system is proposed. The DM-EEGID approach, which is a complete EEG-based identification algorithm, has been designed to eliminate the deficiencies in the literature. This proposed EEG-based identification system consists of four stages. The first step is to receive the EEG signal from the users. The second step is to decompose the frequency subcomponents of the dataset and select the appropriate band. In the third stage, the binary random forest feature selection algorithm, which is a Random Forest-based feature selection system that enables the selection of suitable channels from the 64-channel EEG signal, is used.
In the fourth stage, the hybrid Attention-based LSTM-MLP algorithm that classifies individuals by labeling the features selected by the binary Random Forest feature selection algorithm is executed and the classification result is shown.
The block diagram of this proposed approach is shown in Figure 1. A detailed description of each step in this block diagram is provided in this section. This proposed system takes the EEG biometric data of the users first. Users were asked to have both eyes closed and eyes open while collecting data. The main reason for using both data is to find a solution to the dilemma in the literature. Because most studies use EEG recording with eyes open, other studies use EEG recording with eyes closed. In the next step, the dataset is divided into frequency subcomponents and the most appropriate EEG pattern is selected. There is no fixed opinion on which frequency pattern should be used. Therefore, each pattern will be analyzed with a statistical approach and the most appropriate pattern will be determined by performing tests with each pattern. An RF-based feature-selective algorithm is used to detect and extract the least important channels in the received data. The data is then normalized and used for both training and testing in the hybrid Attention-based LSTM-MLP algorithm. In this section, we first give an overview of the proposed DM-EEGID and then present the technical details for each component, namely, dataset, preprocessing, EEG pattern analysis and decomposition, hybrid Attention-based LSTM-MLP.
3.1 Dataset
To analyze the accuracy of the proposed method in this study, a publicly shared EEG dataset on the Physionet website was used [32]. Most of the studies in the literature use this dataset. Records were collected from 109 subjects in the dataset. While the data was recorded with a 64-channel EEG device, different motor tasks were performed. The electrodes are placed according to the 10-10 system. The sampling frequency of the recorder is 160 Hz. For motor tasks, subjects were asked to close their fists and feet. In the dataset, one-minute eyes open and closed recordings were also taken. The high number of channels in the dataset consisting of 4 tasks is very important for testing the proposed approach. Of these tasks in the dataset, only the data with eyes closed and open were used. Other tasks included in the dataset:
Task 1: A screen for subjects is divided into left and right. The visual stimulus is displayed on the left or right side of the screen. Subjects open and close the left or right hand depending on where the stimuli arose.
Task 2: A screen for subjects is divided into left and right. The visual stimulus is displayed on the left or right side of the screen. Subjects imaginatively open and close their left or right hand depending on where the stimuli arose.
Task 3: A screen for the subjects is divided into two parts, upper and lower. The visual stimulus is displayed at the top or bottom of the screen. Subjects open and close both hands if the stimulus comes out on top. Subjects open and close both feet if the stimulus comes out on top.
Task 4: For the subjects, a screen is divided into two as upper and lower. The visual stimulus is displayed at the top or bottom of the screen. Subjects open and close both hands imaginatively if the stimulus is on top. Subjects open and close both feet imaginatively if the stimulus is on top.
Table 2. General information of EEG patterns
|
Pattern |
Frequency Range |
Voltage Range |
Brain State |
Produced Location |
|
Delta |
0.5–4 Hz |
Higher |
Deep sleep pattern |
Frontally & Posteriorly |
|
Theta |
4–8 Hz |
High |
Light sleep pattern |
Entorhinal cortex & Hippocampus |
|
Alpha |
8–12 Hz |
Medium |
Closing the eyes, relaxing state |
Posterior regions of the head |
|
Beta |
12–30 Hz |
Low |
Active thinking, focus, high alert, anxious |
Most evident frontally |
|
Gamma |
30–100 Hz |
Lower |
During cross-modal sensory processing |
Somatosensory cortex |
The frequency ranges used and their basic characteristics have been determined using general assumptions.
3.2 EEG preprocessing, pattern decomposition, and pattern analysis
This section will introduce general information about the decomposition of EEG patterns into sub-frequency components determined in the literature and their analysis. Before using the raw datasets, the DC offset, which usually arises from the electrodes, should be removed. However, there is no DC offset in this dataset. Then, the EEG data should be separated into lower frequency bands according to the frequency bands shown in Table 2. Each frequency component appears in a different frequency range and dominates in different situations. Delta pattern is between 0.5-4 Hz, Theta pattern is between 4-8 Hz, Alpha pattern is between 8-12 Hz, Beta pattern is between 12-30 Hz and Gamma pattern is between 30-100 Hz. There are cases in which each pattern is associated. The delta pattern occurs in deep sleep. In cases where the delta pattern occurs, people usually have low awareness. The theta pattern is similar to delta, but occurs in light sleep rather than deep sleep. The alpha pattern emerges in mid-awareness. It usually occurs in a state of deep relaxation. The beta pattern occurs when awareness is highest. Therefore, it appears dominantly when the eyes are open. The gamma pattern emerges when performing motor and cognitive functions [37-39]. In short, each frequency band is related to both awareness and the active region of the brain.
Different EEG patterns have been used in studies in the literature. One of the most important problems in this study is which EEG pattern should be used. Therefore, the EEG signal will be separated into all sub-frequency components and their performance on the algorithm will be analyzed. Inter-section correlation coefficient values, one of the analysis methods in the literature, will also be analyzed to support which pattern should be chosen. The correlation of each pattern with other patterns will also be investigated.
Datasets such as EEG must go through the normalization process before they can be used in artificial intelligence studies. The biggest reason for this is that the weight of each data is reduced to the same ratio. There are different normalization methods in the literature. The most commonly used of these methods are min-max normalization, unity normalization, and z-score normalization. Generally, the z-score normalization process is used in EEG data. The Z-score normalization process is shown in Eq. (1). In the equation, μ represents the mean of the raw data, σ represents the standard deviation of the raw data, E represents the raw dataset, and E' represents the post-z-score data. In this way, the amplitudes of the EEG data are normalized and the effect of high amplitude significant data on cells are prevented from harming the effect on low amplitude meaningful data.
$E^{\prime}=\frac{E-\mu}{\sigma}$ (1)
3.3 Feature selection
Today, wrapper and embedded methods are widely used among feature selection methods. Therefore, improvements are made to these methods with various studies. Using different machine learning methods, new machine learning-based embedded methods are frequently used today. Random Forest (RF) based embedded method is one of these new methods [40]. The RF algorithm is inspired by the architecture of the tree/classifier community. It is also used as the feature selection algorithm of the RF architecture. The RF feature selection increases the accuracy performance, especially in classification-based studies [41-45]. There are different RF-based methods, such as SelRF [41]. In this method, the feature with the lowest importance value is eliminated in each iteration to remove the features that negatively affect the classification. This study aims to increase the accuracy performance by using the binary random forest feature selection algorithm, which is an RF-based feature selection approach.
The algorithm's performance will be tested by using both the channels used in the studies on the public dataset and the channels obtained as a result of the RF feature selection algorithm used in this study. Another issue with feature selection is deciding which EEG pattern to use. The EEG signal has five basic subcomponents accepted by experts. These are differentiated from each other by certain frequency values. Detailed information about these frequency subcomponents is given in section 3. In this study, each sub-component will be tested one by one and the most suitable component will be selected. In addition, the most commonly used inter-section correlation coefficient in the selection of EEG subcomponents will be calculated and the consistency of this method with the accuracy percentages obtained as a result of the trials will be examined.
Generally, feature-selective algorithms select features by scoring different features according to certain criteria. If it is considered that there are Z features related to a dataset, the total number of feature subsets will be 2Z. If a search algorithm has O(2Z) complexity, it looks for a solution impractically [44]. Different methods have been discovered to improve this situation. These methods are basically: filters, wrappers, and embedded methods [45]. To summarize these methods, although the filter method is computationally efficient, it can sometimes reduce performance [46]. Wrappers methods are more complex than filter methods. However, thanks to its predictive models, it generally shows better results than filter methods [47]. In embedded methods, the features obtained from the dataset use the results obtained with the help of a supervised learner. One of the most widely used methods is Recursive Feature Elimination with Support Vector Machine (SVM-RFE). The basic method in this approach is to remove the least weighted features from the SVM structure of the RFE structure.
The more channels that are measured in EEG-based studies, the more meaningful data is collected. In identification systems, it is generally of great importance that users receive sufficient data. Therefore, a publicly available dataset with 64 channels will be used. Multivariate data does not always positively affect accuracy performance for artificial intelligence methods. Thus, selecting meaningful channels is an essential problem in EEG-based studies and any study with a high number of features. In order to increase the performance of the classifiers, the most meaningful features should be selected. Because some data are similar to different data to be classified will negatively affect the performance of algorithms. This directly affects the percentage of accuracy. In recent years, there are studies in which machine learning methods are actively used in feature selection. Similar to the Random Forest (RF) based feature selection algorithm that will be used in this study has been found [40-43]. RF architecture is a classification method based on a collection of trees in numerical and categorical data in this structure developed by Breiman [40]. The binary random forest feature selection method will be used to classify individuals using EEG data to select channel features. RF architecture usually uses the Gini index or out-of-bag (OOB) error rate. Thanks to these methods, the quantitative contributions of the features are analyzed. The features of the algorithm are ranked in order of importance and the bands of the high importance of different combinations are selected. This study will use a binary RF feature selection algorithm based on the Gini index. The Gini index allows quantitatively evaluation of a feature's discriminating effect on different categories [48]. The mathematical expression of the Gini index is shown in Eq. (2). Here’s represents the sample set on each node, m represents the number of categories, and p represents the ratio of observations.
$\operatorname{Gini}(s)=\sum_{i=1}^m p_i\left(1-p_i\right)=1-\sum_{i=1}^m p_i^2$ (2)
Algorithm 1 shows the pseudocode of the binary RF-based feature selection algorithm. The basic operation in decision trees is to search for all features for each node and minimize the Gini purity. In this way, different categories can be separated. Meanwhile, important points are obtained for each feature. The importance score is determined by the effect of the feature in reducing the Gini index. In this way, meaningless channels are eliminated by feature selection in this study. Since the number of channels is obtained manually from the user, the channels determined by the methods in the literature will be tested with different channel numbers. But this is not a very effective method. Therefore, features below a predetermined threshold value (T) for the Gini index are eliminated. In this way, the screened form (F) of low Gini index data containing a certain number of features (M) is obtained. Iterations are run as many as the number of features (M) requested as output. The “imid” parameter is used to determine the right and left trees. First, the accuracy is calculated using the left tree. The accuracy value is updated if the calculated accuracy is better than the previous tree accuracy. The control must be maintained between tree accuracy and node accuracy. If the difference between the two truth values is less than or equal to the specified threshold, the recursive loop is run to search for the node. If the condition is false, it is passed to the right tree and the same operations are performed for this tree.
|
Algorithm 1 Pseudo Code of Binary RF Feature Selection |
|
Function imax = RFFeatureSelection (data, F, Accuracy1, key, imin, imax, index) imid = index + (imax - index) / 2 Accuracy1 = AccuracyCalculator(data, F, imin, imid) if Accuracy2 > Accuracy1then Accuracy1 = Accuracy2 end if if AbsoluteValue(Accuracy1 - Accuracy2) ≤ key then if imax = imid + 1 then return end if imax = imid imax = RFFeatureSelection(data, F, Accuracy1, key, imin, imax, index) else while imax > imid + 1 do index = imax imid = imid + (imax - imid) / 2 Accuracy2 = AccuracyCalculator(data, F, imin, imid) if Accuracy2 > Accuracy1then Accuracy1 = Accuracy2 end if if AbsoluteValue(Accuracy1 - Accuracy2) ≤ key then imax = RFFeatureSelection(data, F, Accuracy1, key, imin, imax, index) end if end while end if end Function |
3.4 Hybrid long short term memory-multi-layer perceptron algorithm
This section will explain the hybrid algorithm created by giving general information about both Long Short Term Memory (LSTM) network and Multi-layer Perceptron (MLP) architecture. The LSTM network is a Recurrent Neural Network (RNN) customised version. The most important feature of the RNN architecture is its high performance in time series. These architectures depend not only on current inputs but also on past inputs. However, in classical neural network architectures, the effect of historical data disappears when adjusting the network weights. To avoid this disadvantage, RNN architecture has been developed. LSTM architecture can detect long-term relationships thanks to the remember gate in the data used in its structure. Therefore, it is suitable for use in regression and classification of time series. The fact that each LSTM cell captures long-term relationships distinguishes it from the RNN architecture. The gate blocks in its structure are specialized for different functions. The first of these gates is called the gate of forgetting. This gate performs an analysis between the previous output and the instantaneous input and produces a value between 0 and 1. If the generated value is 0, it means “forget this state”, if it is 1, it means “keep this state”. The forget gate is denoted by ft. Equation 3 shows the equation indicating the forgetting gate [49].
$f_t=\operatorname{sigmoid}\left(W_f\left[h_{t-1}, x_t\right]\right)+b_f$ (3)
Another layer of doors is the entrance door. This gate structure decides which new values to store. Both sigmoid and tanh functions are used in this gate operator. The sigmoid structure generates the new value to be updated and the tanh structure produces the intermediate value Ctx. Eq. (4) shows the equation of the sigmoid function and Eq. (5) shows the equation of the tanh function. Then these equations are combined [49].
$i_t=\operatorname{sigmoid}\left(W_i\left[h_{t-1}, x_t\right]\right)+b_i$ (4)
$C_{t x}=\tanh \left(W_c\left[h_{t-1}, x_t\right]\right)+b_c$ (5)
Using it and Ctx values, Ct is produced, which allows the old data to be transferred to the next cell. In Eq. (6), the current data equation obtained with old data and new entries shows Ct.
$C_t=f_t * C_{t-1}+i_t * C_{t x}$ (6)
In the next step, the output of that cell should be calculated. This calculated output is branched for use in the next cell. Finally, deciding which data will be used as output from the cell is necessary. The sigmoid function is used to make this decision. The equality of this function used in Eq. (7) is seen. Convert the result of the sigmoid function between -1 and 1 using the tanh function to get the final cell output. Equation 8 shows the last cell output equation [49].
$o_t=\operatorname{sigmoid}\left(W_o\left[h_{t-1}, x_t\right]\right)+b_o$ (7)
$h_t=o_t * \tanh \left(C_{t x}\right)$ (8)
The Attention architecture was developed to improve the performance of the LSTM architecture. This architecture focuses on the most distinctive information. In the Attention-based LSTM architecture, hidden states operate with trainable weights. In this way, it becomes easier to reach the most distinctive information. This process is represented in Eq. (9).
$h_i=\operatorname{LSTM}\left(s_i\right)$ (9)
hi represents the hidden output state vector in the LSTM architecture. The mathematical equations of the Attention architecture that capture the importance of the latent state are represented in Eqns. (10)-(12). In these equations, the vector v represents the output of the attention layer. But here the most important parameters are trainable Ws and bs parameters.
$u_i=\tanh \left(W_s * h_i+b_s\right)$ (10)
$a_i=\frac{\exp \left(u_i\right)}{\sum_j \exp \left(u_j\right)}$ (11)
$v=\sum_i a_i h_i$ (12)
A hybrid algorithm has been developed by combining the Multi-layer Perceptron (MLP) algorithm with the LSTM architecture. The results of the LSTM algorithm are used as input to the MLP algorithm. MLP architecture is a feed-forward neural network [50]. MLP consists of three basic layers: Input, hidden, and output. These layers are connected by a weight factor. The number of neurons in the input layer must be equal to the number of features used as input, and similarly, the number of neurons in the output layer is equal to the number of categories in the dataset [50]. Each of the hidden layers depends on both the layer after it and the layer before it. The outputs of the node in each layer are made ready for the weighting process by using a non-linear activation function. The relationship between the intermediate layers is shown in Eq. (13).
$a^{l+1}=\sigma\left(w^l a^l+b^l\right)$ (13)
here, α represents layers, l indices, b bias value, w weights, and σ activation function. There are different activation functions in the literature. Examples of these activation functions are sigmoid and hyperbolic tangent. The mathematical expression of the output layer with these layer relationships is shown in Eq. (14). In this equation, m represents the total number of layers. The expression in Eq. (15) shows how supervised training works using backpropagation. The main aim of using Eq. (15) is to reduce the difference between the predicted and actual results [50].
$h_{w, b}(x)=a^m$ (14)
$J(W, b ; x, y)=\frac{1}{2}\left\|h_{w, b}(x)-y\right\|^2$ (15)
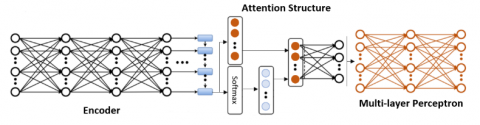
In the hybrid algorithm designed in this study, the features obtained with the Attention-based LSTM algorithm are used as inputs in the Multi-layer Perceptron (MLP) algorithm. Each node in the structure of the MLP algorithm contains nonlinear activation functions. The general architecture of the Attention-based LSTM-MLP algorithm designed in this study is shown in Figure 2.
Figure 2. Flowchart of the hybrid attention-based LSTM-MLP algorithm. LSTM architecture is an algorithm developed especially for time series data. It creates a hybrid approach with the Attention architecture and MLP architecture added to its structure
In the method proposed in this study, an EEG-based identification system is proposed. This proposed system has both feature selection architecture and a hybrid algorithm. Table 3 shows an overall comparison of some biometric data. By examining this table in detail, it should be decided which parameters should be corrected for the system to be designed.
In order to control the performance of the proposed system, tests were carried out on the public dataset in the literature. The dataset is shared on the PhysioNet website. The dataset includes data from 109 subjects during 6 different tasks [37]. Each channel can be used as a feature in a 64-channel dataset. However, the use of all features may adversely affect the performance of the designed algorithm. Therefore, it is important to investigate the effects of different channels on performance. Some studies have only investigated the effect of this. The EEG signal is not just due to the current activity. Basically, the EEG signal is a combination of these signals: noise, EEG resulting from the task, and EEG related to background vital signs. The effect of regional signals is therefore very important. The identification algorithms made comparisons on which point the recorded signal was more effective. The electrode positions used by the studies in the literature are shown in Table 4.
Table 3. Comparison of performances in person identification task of biometric data
|
Biometric |
Uniqueness + |
Stability + |
Performance + |
Universality + |
Complexity - |
Reliability + |
|
Iris |
3 |
3 |
3 |
3 |
3 |
1 |
|
Retina |
3 |
2 |
3 |
3 |
3 |
2 |
|
Voice |
2 |
1 |
1 |
2 |
1 |
1 |
|
Signature |
1 |
1 |
1 |
3 |
2 |
1 |
|
Fingerprint |
3 |
3 |
3 |
3 |
2 |
1 |
|
Face |
2 |
2 |
2 |
3 |
3 |
1 |
|
Gait |
3 |
2 |
3 |
1 |
1 |
3 |
|
EEG |
3 |
1 |
3 |
3 |
2 |
3 |
Scoring was made for each biometric data in the table. It is scored with 3 representing the best, 2 representing the intermediate level, and 1 representing the lowest. – represents the features that should be low, and + represents the features that should be high.
Table 4. Channels are used for identification in the literature
|
References |
Number of Channel |
Channels |
|
[51] |
16 |
Fz, Cz, P3, Pz, P4, Po7, Oz, Po8, C3, C4, F3, F4, Af7, Af8, Cp5, Cp6 |
|
[52] |
14 |
AF3, AF4, F3, F4, F7, F8, FC5, FC6, P7, P8, T7, T8, O1, O2 |
|
[53] |
6 |
C3, C4, P7, P8, O1, O2 |
|
[54] |
19 |
Fp1, Fp2, F3, F4, Fz, F7, F8, T7, T8, C3, Cz, C4, P3, Pz, P4, P7, P8, O1, O2 |
|
[55] |
6 |
Fpz, Cz, Pz, O1, O2, Oz |
|
[31] |
17 |
FZ, F3, F4, F7, F8, CZ, C3, C4, T3, T4, PZ, P3, P4, T5, T6, O1, O2 |
|
[56] |
14 |
AF3, AF4, F3, F4, F7, F8, FC5, FC6, P7, P8, T7, T8, O1, O2 |
|
[57] |
14 |
AF3, AF4, F3, F4, F7, F8, FC5, FC6, T7, T8, P7, P8, O1, O2 |
|
Proposed Closed Eyes |
48 |
Fc5, Fc3, Fc4, Fc6, C5, C3, Cz, C2, C4, C6, Cp5, Cp2, Cp6, Fp1, Fpz, Fp2, Af7, Af3, Af4, Af8, F7, F5, F3, Fz, F2, F6, F8, Ft7, Ft8, T7, T8, T9, T10, Tp7, Tp8, P7, P5, P4, P6, P8, Po7, Po3, Po4, Po8, O1, Oz, O2, Iz |
|
Proposed Opened Eyes |
48 |
Fc1, Fc4, Fc6, C2, C4, C6, Cp5, Cp4, Cp6, Fp1, Fpz, Fp2, Af7, Af3, Afz, Af4, Af8, F7, F1, Fz, F2, F4, F6, F8, Ft7, Ft8, T7, T8, T9, T10, Tp7, Tp8, P7, P5, Pz, P2, P4, P6, P8, Po7, Po3, Poz, Po4, Po8, O1, Oz, O2, Iz |
Some of the channels were determined using a specific channel selection algorithm. In some studies, channels use all channels of EEG recorders.
Figure 3. Graph of gini importance values determined by binary random forest feature selection algorithm for all channels. the channels selected for the training and testing of the algorithm are determined according to these gini importance values
Using a large number of data generally increases the running time of algorithms. However, data measured from the most insignificant points show a performance-reducing effect. Therefore, it is desirable that the number and location of the electrodes used and the amount of recorded data be at the optimum level. In this study, the binary random forest feature selection algorithm was used for optimum channel number selection on the dataset. Different methods have been followed in the studies in the literature. These methods are generally based on correlation analysis. The feature Selection algorithm used in this study was run separately for each user, but the same channels were selected for the feature in all of them. The binary random forest algorithm was executed 10 times with the help of the Gini importance value for each feature selection. The importance value of each channel is shown in Figure 3. Channel names are numbered because they take up space on the chart. The electrodes used and their order in the graph are as follows: 0-Fc5, 1-Fc3, 2-Fc1, 3-Fcz, 4-Fc2, 5-Fc4, 6-Fc6, 7-C5, 8-C3, 9-C1, 10- Cz, 11-C2, 12-C4, 13-C6, 14-Cp5, 15-Cp3, 16-Cp1, 17-Cpz, 18-Cp2, 9-Cp4, 20-Cp6, 21-Fp1, 22-Fpz, 23-Bp2, 24-Nf7, 25-Nf3, 26-Nf, 27-Nf4, 28-Nf8, 29-F7, 30-F5, 31-F3, 32-F1, 33-Fz, 34-F2, 35- F4, 36-F6, 37-F8, 38-Ft7, 39-Ft8, 40-T7, 41-T8, 42-T9, 43-T10, 44-Tp7, 45-Tp8, 46-P7, 47-P5, 48-P3, 49-P1, 50-Pz, 51-P2, 52-P4, 53-P6, 54-P8, 55-Po7, 56-Po3, 57-Pos, 58-Po4, 59-Po8, 60- O1, 61-Oz, 62-O2, 63-Iz. The importance values taken as the output of this algorithm can be limited according to a certain threshold value.
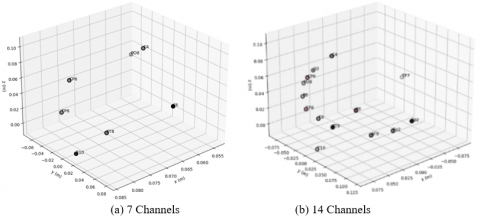
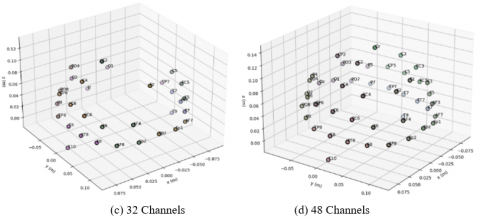
For this study, the importance of accuracy performance has been tried to be emphasized. Therefore, the focus is on the number of channels and electrode positions that give the highest accuracy. All feature Selection results from 1 channel to 64 channels were tested with the help of the binary random forest feature Selection algorithm in a loop. According to these results, the highest accuracy value was achieved by using 48 channels. The 3-dimensional positions of the channels determined by the Feature Selection algorithm are shown in Figure 4. In addition, in Figure 4, the positions of the electrodes with the highest importance according to different channel numbers are shared so that they can be used in different studies. In order to show the performance of the Binary random forest feature Selection algorithm, its effect on different algorithms is shown in Tables 9 and 10. The number of channels shown in Tables 9 and 10 is the number of channels determined by the algorithm. In addition, 64-channel data used without feature selection and EEG data from the same subjects in the dataset with their eyes open were also used for the comparison test. All operations were applied to the dataset with eyes open. The highest accuracy was again achieved with 48 channels. Channel information according to the Gini importance values obtained by the binary random forest feature selection algorithm in the dataset with eyes open and closed are shared in Table 4.
In the proposed approach, the appropriate frequency subcomponent should be selected in the next step after the binary random forest feature selection algorithm determines the selected channels. There are two different approaches to this issue. The first of these approaches is based on when the EEG pattern becomes dominant.
In EEG-based identification systems, studies are not carried out using only resting state data. There are also visual stimulus-based studies. If a visual stimulus-based system has been developed, alpha or beta patterns are explored here [29]. A different approach is a statistical approach. In this approach, the correlations between the patterns are examined and the pattern with the most different (the smallest correlation value) is selected. In this study, correlations between EEG patterns were investigated within mathematical proof. Table 5 shows the correlation coefficients between subjects. If the average correlation coefficients are examined, it is seen that the data with the lowest correlation is the delta pattern. This value proves that the pattern with the lowest similarity between the subjects is delta. In order to obtain each frequency band, a 3rd order Butterworth bandpass filter is used. The filter's low and high cut frequencies are adjusted according to Table 2. Many identification algorithms shy away from the delta pattern. Because the delta pattern is dominant in the deep sleep state. According to some views, the delta pattern that emerges when not asleep is the most stable pattern for studies such as identification. In this study, positive opinions about the delta pattern are supported.
The hyperparameters used in the proposed hybrid Attention-based LSTM-MLP algorithm are shared in Table 6. In order to maximize the accuracy performance, these parameters were obtained as a result of different trials. A search field suitable for each parameter was selected for these trials. Table 6 contains detailed information about the search area and parameters used for both LSTM and MLP architectures. The parameters selected for the parameter space were determined according to similar studies in the literature. In this way, the parameters that will decrease the performance are avoided and time loss is prevented. In future studies, this parameter space can be expanded. Parameter adjustment directly affects accuracy performance.
Table 5. The inter-subject correlation coefficients of EEG patterns
|
Closed Eyes Dataset |
||||
|
Delta |
Theta |
Alpha |
Beta |
Gamma |
|
0.230 |
0.445 |
0.427 |
0.458 |
0.540 |
|
Opened Eyes Dataset |
||||
|
Delta |
Theta |
Alpha |
Beta |
Gamma |
|
0.316 |
0.516 |
0.478 |
0.549 |
0.663 |
Data with a lower inter-subject correlation coefficient will allow higher recognition in identification.
Figure 4. Electrode positions of high-importance channels on the scalp and 3D representation of their positions in different channel numbers according to the blindfolded dataset of the Binary RF Feature Selection algorithm
Table 6. Hyperparameter space and selected parameters of the proposed Hybrid Attention-based LSTM-MLP classifier algorithm
|
Binary Random Forest Feature Selection Algorithm |
||
|
Parameter |
Parameter Search Space |
Selected Parameter |
|
Estimators size |
100, 200, 300, 400, 500, 600, 1000, 1200, 1400, 1600, 1800, 2000 |
200 |
|
Max depth size |
10, 20, 30, 40, 50, 60, 70, 80, 90, 100, None |
70 |
|
Max feature |
auto, sqrt |
auto |
|
Bootstrap |
true, false |
true |
|
Long Short Term Memory Algorithm |
||
|
Parameter |
Parameter Search Space |
Selected Parameter |
|
Optimizer |
adam, adadelta, sgd, rmsprop |
adam |
|
Activation functions of hidden layers |
relu, tanh |
relu |
|
Dropout rate |
0.1-0.5 |
0.3 |
|
Training epoch |
100, 200, 500, 1000, 1500, 2000 |
1500 |
|
Learning rate |
0.001, 0.01 |
0.001 |
|
Batch size |
32, 64, 128, 256 |
128 |
|
Multi-Layer Perceptron Algorithm |
||
|
Parameter |
Parameter Search Space |
Selected Parameter |
|
Activation functions of hidden layers |
logistic, relu, tanh |
relu |
|
Hidden layer size |
40-40-40, 100-100-100, 150-150-150, 300-300-300, 350-350-350, 500-500-500 |
350, 350, 350 |
|
Optimizer |
sgd, adam |
adam |
|
Alpha |
0.001, 0.0001 |
0.0001 |
Each algorithm needs certain parameters to work with the highest accuracy. In order to reach the optimum parameter, a parameter space consisting of the parameters used in the literature is created. The parameter values in the parameter space are tested and the appropriate parameter is selected for the highest accuracy.
With the studies in the literature, it has been proven that the EEG signal can be used in biometric identification systems. This study proposes an algorithm based on the optimum channel hybrid Attention-based LSTM-MLP method by producing solutions to the deficiencies in the literature. The obtained results reveal that the designed system can be used for closed systems in real life. One of the most important parameters that determine the performance of the systems, not only in the proposed approach but in all studies, is the length of the EEG data used in the training and testing phase and the number of channels. This parameter directly affects the running time of the algorithm. In addition, the prices of EEG recorders vary depending on the number of channels. Therefore, the number of channels should be optimized to maintain the cost-accuracy balance. The binary RF-based approach was used to determine the number of channels and which channels to use. In this way, 48 channels from 64-channel EEG data were used and the number of channels was optimized.
In most studies in the literature, the lack of channel selection has been detected. It is shown how the optimized number of channels affects accuracy performance. Accordingly, both eyes-open and eyes-closed datasets achieved the highest accuracy rate in 48 channels with the highest importance determined by the binary RF feature selector. A more effective model has been proposed than the studies in the literature using 64 channels of the same dataset.
In previous studies, together with random forest (RF), decision tree (DT), gradient boost classifier (GBC), multi-layer perceptron (MLP), support vector machine (SVM), k-nearest neighbors (kNN), LSTM algorithms, which are widely used in the literature, some hybrid algorithms we designed are also used for the analysis of LSTM-XGBoost, LSTM-kNN accuracy performance. Different algorithms have been a guide in determining the appropriate model. Algorithms working with high performance in time series data have proven themselves. If the processing times are compared, the training times of deep learning-based studies are longer, but the accuracy values are quite high.
The proposed hybrid attention-based LSTM-MLP method achieved the highest accuracy in both the eyes-closed and the eyes-open datasets. The eyes-open dataset's accuracy, precision, and recall values are 99.70%, 99.71%, and 99.70%, respectively. In this study, it is supported that the recordings with the eyes closed show higher performance. The main reason for this is that EEG signals are highly affected by environmental factors when the eyes are open. The test results also support this situation. The blindfolded dataset's accuracy, precision, and recall values are 99.96%, 99.94%, and 99.94%, respectively. It has been observed that using the entire 64-channel dataset reduces the accuracy value. The performance of the binary random forest feature selection algorithm in this study has also been proven. The purpose of the tests performed according to the number of different channels is that the EEG recorders have different numbers of electrodes.
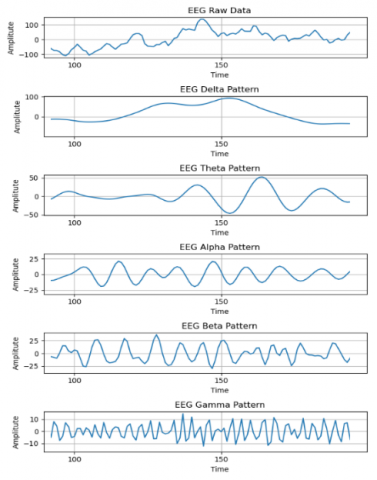
In addition, in Table 7, the test results of the proposed hybrid attention-based LSTM-MLP algorithm with these components are shared to see each frequency subcomponent's effect on accuracy. These results show that the delta band has the highest accuracy. With this test result, it has been proven by both statistical results and test results that the appropriate frequency band was selected for the proposed DM-EEGID method. In addition, an example of the dataset used is shown in Figure 5.
Comparative analysis against studies using the same dataset in the literature is shown in Table 8. The dataset recorded with a recorder with a sampling frequency of 160 Hz has been used in many types of research due to its public availability. It is not only used in identification algorithms. Some studies classify these motor movements because they have motor movements. However, using these studies in identification studies is meaningless. Because the purpose of this data collected from individuals is to be used in studies such as Brain-Computer Interface. Therefore, using such stimuli for a study such as two-factor authentication with a customized interface may make sense. This study does not support the use of data on motor movements in the literature.
When the literature summary table shared in the Related Works section is examined, it is seen that machine learning-based studies have lower accuracy values in classifying complex data such as EEG. Studies carried out after [22] have evolved into deep learning-based studies in order to overcome the inadequacy of machine learning. Because deep learning methods are more effective and perform better than classical shallow neural network methods. There are successful works, especially in feature extraction and selection in studies carried out using these shallow neural networks. Therefore, these studies can be updated with current deep learning algorithms. However, studies in the literature are based on either feature selection or the most appropriate model. Therefore, a hybrid deep-machine learning-based model supported by the binary random forest feature Selection algorithm was created to close this gap. This way, the literature deficiency was eliminated with the proposed DM-EEGID method. In addition, cost due to the optimized number of channels. Thus, a suitable classification algorithm for a biometric authentication scenario applicable to all problems has been developed.
Figure 5. An example subset of the raw EEG dataset and EEG patterns
Table 7. Comparison of the proposed approach (DM-EEGID) with different EEG patterns of 48 channels
|
Data |
Acc% |
Pre% |
Rec% |
|
Delta |
99.96% |
99.94% |
99.94% |
|
Theta |
98.07% |
98.08% |
98.07% |
|
Alpha |
97.00% |
97.01% |
97.00% |
|
Beta |
95.00% |
95.01% |
95.00% |
|
Gamma |
96.81% |
96.83% |
96.81% |
|
All |
90.47% |
90.43% |
90.44% |
Inter-subject correlation coefficient results showed that the delta pattern was the most appropriate frequency subcomponent. In addition, the results of the tests performed with each pattern also support this hypothesis. Acc%: Accuracy, Pre%: Precision, Rec%: Recall
Table 8. Comparison of related works with the same dataset
|
Ref. |
Ch. |
Pattern |
Objective |
Acc % |
Year |
|
[13] |
64 |
γ |
Multiple related tasks are performed simultaneously. EEG signals recorded with left hand movement and eyes open tasks were classified using Two-layer Neural Networks algorithm by extracting the features such as mean and standard deviation. |
95.60 |
2017 |
|
[14] |
4, 16, 32, 64 |
γ |
Identification was made with 1D Convolutional LSTM architecture using motor movements (fists and feet). |
99.58 |
2019 |
|
[19] |
46, 64 |
α, β |
An identification system with fuzzy entropy and Power Spectral Density based features is designed using CNN with motor movements EEG records (fists and feet). In particular, the issue of stability of EEG biometrics was mentioned. |
99.94 |
2019 |
|
[21] |
56 |
All |
By performing network analysis on a set of EEG features, it combined 10 single-channel features (seven spectral and three non-linear) and 10 multi-channel features, creating a distance-based classifier for authentication. |
98.93 |
2018 |
|
[28] |
1 |
All |
The optimum classification result is investigated using only one channel EEG data. SVM and LDA algorithms were used as classifiers. |
82.58 |
2022 |
|
[31] |
14 |
All |
A low-cost CNN-based model was designed using resting-state EEG recordings. By keeping the number of channels very low, the desired optimum accuracy has been achieved. |
99.32 |
2022 |
|
# |
7, 14, 32, 48, 64 |
δ |
Appropriate frequency band selection was determined by correlation analysis. Accuracy is increased with the random forest-based feature selector architecture. The hybrid classifier has also improved accuracy. |
99.96 |
- |
EEG Pattern: Symbols of 5 different frequency bands mentioned in the method section are used. The "All" label is used for the studies that use it without separating into the frequency bands. In some studies, channel selection has been applied, and in general, these studies achieve higher accuracy than studies using all channels. Ref. means references, and # means proposed method. Acc: Accuracy%. Ch: Number of channels. Ref: References.
Table 9. Comparison of algorithms performance metrics of closed eyes dataset
|
|
|
kNN |
MLP |
RF |
DT |
GBC |
LSTM |
SVM |
LSTM XGB |
LSTM kNN |
LSTM MLP |
|
7 Channel |
Acc% |
92.64% |
95.68% |
86.84% |
79.42% |
69.33% |
80.91% |
76.22% |
92.95% |
96.75% |
96.78% |
|
Pre% |
92.80% |
87.04% |
87.04% |
79.48% |
70.73% |
80.94% |
76.70% |
93.02% |
96.79% |
96.82% |
|
|
Rec% |
92.61% |
86.78% |
86.80% |
79.38% |
69.13% |
80.91% |
76.35% |
92.95% |
96.75% |
96.76% |
|
|
14 Channel |
Acc% |
99.08% |
98.95% |
95.44% |
87.32% |
79.57% |
93.18% |
80.60% |
99.18% |
99.69% |
99.81% |
|
Pre% |
99.09% |
99.01% |
95.49% |
87.39% |
80.32% |
93.45% |
80.20% |
99.19% |
99.69% |
99.81% |
|
|
Rec% |
99.09% |
98.96% |
95.44% |
87.32% |
79.57% |
93.19% |
80.60% |
99.19% |
99.69% |
99.81% |
|
|
32 Channel |
Acc% |
99.55% |
99.35% |
97.86% |
89.99% |
85.96% |
97.90% |
86.76% |
99.58% |
99.76% |
99.51% |
|
Pre% |
99.56% |
99.47% |
97.87% |
90.01% |
86.47% |
98.12% |
87.31% |
99.60% |
99.76% |
99.50% |
|
|
Rec% |
99.55% |
99.35% |
97.86% |
89.99% |
85.96% |
97.91% |
86.76% |
99.58% |
99.76% |
99.50% |
|
|
48 Channel |
Acc% |
99.60% |
99.50% |
97.70% |
90.18% |
88.04% |
98.58% |
88.09% |
99.67% |
99.76% |
99.96% |
|
Pre% |
99.61% |
99.51% |
97.72% |
90.21% |
88.38% |
98.64% |
88.56% |
99.76% |
99.76% |
99.94% |
|
|
Rec% |
99.61% |
99.50% |
97.70% |
90.18% |
88.01% |
98.56% |
88.01% |
99.62% |
99.76% |
99.94% |
|
|
64 Channel |
Acc% |
99.60% |
99.35% |
97.62% |
89.82% |
87.66% |
98.43% |
87.01% |
99.78% |
99.06% |
99.78% |
|
Pre% |
99.60% |
99.35% |
97.64% |
89.85% |
88.15% |
98.45% |
87.48% |
99.79% |
99.09% |
99.79% |
|
|
Rec% |
99.60% |
99.35% |
97.62% |
89.82% |
87.66% |
98.43% |
87.01% |
99.78% |
99.06% |
99.79% |
Table 10. Comparison of algorithms performance metrics of opened eyes dataset
|
|
|
kNN |
MLP |
RF |
DT |
GBC |
LSTM |
SVM |
LSTM XGB |
LSTM kNN |
LSTM MLP |
|
7 Channel |
Acc% |
95.88% |
92.75% |
92.75% |
87.38% |
80.69% |
88.50% |
76.70% |
97.30% |
96.80% |
97.30% |
|
Pre% |
95.99% |
92.93% |
92.93% |
87.59% |
81.26% |
88.53% |
77.41% |
97.33% |
96.93% |
97.35% |
|
|
Rec% |
95.88% |
92.75% |
92.75% |
87.38% |
80.69% |
88.50% |
76.70% |
97.30% |
96.80% |
97.31% |
|
|
14 Channel |
Acc% |
99.31% |
93.09% |
97.31% |
90.94% |
91.63% |
97.70% |
80.70% |
98.90% |
99.10% |
99.30% |
|
Pre% |
99.32% |
93.16% |
97.35% |
90.99% |
91.78% |
97.73% |
80.76% |
98.92% |
99.11% |
99.31% |
|
|
Rec% |
99.31% |
93.10% |
97.31% |
90.94% |
91.63% |
97.71% |
80.70% |
98.90% |
99.10% |
99.31% |
|
|
32 Channel |
Acc% |
99.43% |
97.30% |
97.81% |
91.06% |
95.93% |
98.70% |
92.70% |
99.40% |
99.20% |
99.30% |
|
Pre% |
99.44% |
97.35% |
97.83% |
91.09% |
96.02% |
98.72% |
92.75% |
99.42% |
99.21% |
99.31% |
|
|
Rec% |
99.44% |
97.31% |
97.81% |
91.06% |
95.94% |
98.70% |
92.70% |
99.40% |
99.20% |
99.30% |
|
|
48 Channel |
Acc% |
99.56% |
98.68% |
98.68% |
92.25% |
96.88% |
98.90% |
95.20% |
99.50% |
99.60% |
99.70% |
|
Pre% |
99.57% |
98.69% |
98.69% |
92.34% |
96.95% |
98.93% |
95.31% |
99.51% |
99.60% |
99.71% |
|
|
Rec% |
99.56% |
98.68% |
98.69% |
92.25% |
96.88% |
98.90% |
95.20% |
99.50% |
99.60% |
99.70% |
|
|
64 Channel |
Acc% |
99.50% |
99.10% |
97.68% |
90.87% |
96.69% |
98.00% |
95.00% |
98.80% |
99.50% |
99.50% |
|
Pre% |
99.50% |
99.14% |
97.75% |
91.04% |
96.74% |
98.04% |
95.20% |
98.83% |
99.51% |
99.51% |
|
|
Rec% |
99.50% |
99.10% |
97.69% |
90.88% |
96.69% |
98.01% |
95.00% |
98.80% |
99.50% |
99.50% |
In the studies in the literature, datasets recorded with both eyes open and eyes closed are used. Different algorithms have been proposed in the literature. Test results were collected to see both the two datasets and the results of different algorithms.
In this article, a biometric person identification approach called DM-EEGID is proposed. In addition, it aims to design a high-performance person identification algorithm that can be used for closed systems by using the optimum number of channels and the hybrid deep learning and machine learning algorithm. There is no common view on which EEG pattern should be used in the studies in the literature. In this study, the delta pattern has been proven to be the most appropriate pattern by analyzing the correlation analysis results and by conducting individual tests with each pattern. The proposed DM-EEGID approach consists of four basic steps. First, appropriate channels were determined using the binary Random Forest-based feature selector to select suitable channels after signal collection and preprocessing. The highest accuracy performance was obtained in tests using 48 channels. Then, the hybrid LSTM-MLP method is fed with these data and the people are identified. EEG-based methods are very reliable because the EEG data obtained in attack environments differs from the data obtained in the resting state. However, EEG signals are more complex than other biometric data. However, the stability of EEG signals is quite low. In order to prevent this, an Attention-based block is placed in the LSTM architecture. The proposed approach was tested using two different datasets. In these datasets, both eyes open and eyes closed resting state recordings were used. In the studies in the literature, no approach tries both situations. This way, two different datasets were used to solve this dilemma. The accuracy of the proposed DM-EEGID model is 99.70% in data with eyes open and 99.96% accuracy in data with eyes closed. These accuracy values prove the usability of the proposed approach.
The proposed DM-EEGID model is open to development. Different suggestions can be offered for future studies. First of all, more comprehensive tests can be performed on different datasets. EEG-based systems are a new approach. While recording EEG signals with EEG recorders, the recording environment poses a significant problem. EEG signals can be easily affected by any stimulus in conscious subjects. Therefore, EEG signals should be recorded in wider scenarios. In addition, aging poses significant problems for stored EEG data. Generally, the amplitude of the EEG signal decreases inversely with age. Therefore, changes in EEG data due to aging should be analyzed. Generally, the amplitude of EEG signals decreases with age. In future studies of the DM-EEGID model, the data stored in the system should be updated at certain intervals depending on age. However, EEG data can be used as an alternative for hybrid biometrics systems. Also, in future studies, researchers can work on parameter optimization.
[1] Givens, G.H., Beveridge, J.R., Lui, Y.M., Bolme, D.S., Draper, B.A., Phillips, P.J. (2013). Biometric face recognition: From classical statistics to future challenges. Wiley Interdisciplinary Reviews: Computational Statistics, 5(4): 288-308. https://doi.org/10.1002/wics.1262
[2] Latman, N.S., Herb, E. (2013). A field study of the accuracy and reliability of a biometric iris recognition system. Science & Justice, 53(2): 98-102. https://doi.org/10.1016/j.scijus.2012.03.008
[3] Sadikoglu, F., Uzelaltinbulat, S. (2016). Biometric retina identification based on neural network. Procedia Computer Science, 102: 26-33. https://doi.org/10.1016/j.procs.2016.09.365
[4] Ormerod, D. (2017). Sounding out expert voice identification. Expert Evidence and Scientific Proof in Criminal Trials, 283-302. https://doi.org/10.4324/9781315094205-9
[5] Unar, J.A., Seng, W.C., Abbasi, A. (2014). A review of biometric technology along with trends and prospects. Pattern Recognition, 47(8): 2673-2688. https://doi.org/10.1016/j.patcog.2014.01.016
[6] Isenor, D.K., Zaky, S.G. (1986). Fingerprint identification using graph matching. Pattern Recognition, 19(2): 113-122. https://doi.org/10.1016/0031-3203(86)90017-8
[7] Samaria, F.S., Harter, A.C. (1994). Parameterisation of a stochastic model for human face identification. In Proceedings of 1994 IEEE workshop on applications of computer vision, pp. 138-142. https://doi.org/10.1109/ACV.1994.341300
[8] Sun, Y., Lo, B. (2018). An artificial neural network framework for gait-based biometrics. IEEE Journal of Biomedical and Health Informatics, 23(3): 987-998. https://doi.org/10.1109/JBHI.2018.2860780
[9] Zhao, Z., Yang, L., Chen, D., Luo, Y. (2013). A human ECG identification system based on ensemble empirical mode decomposition. Sensors, 13(5): 6832-6864. https://doi.org/10.3390/s130506832
[10] Gui, Q., Jin, Z., Xu, W., Ruiz-Blondet, M.V., Laszlo, S. (2015). Multichannel EEG-based biometric using improved RBF neural networks. In 2015 IEEE signal processing in medicine and biology symposium (spmb), pp. 1-6. https://doi.org/10.1109/SPMB.2015.7405418
[11] Sohankar, J., Sadeghi, K., Banerjee, A., Gupta, S.K. (2015). E-bias: A pervasive EEG-based identification and authentication system. In Proceedings of the 11th ACM Symposium on QoS and Security for Wireless and Mobile Networks, pp. 165-172. https://doi.org/10.1145/2815317.2815341
[12] Bhattacharyya, S., Sengupta, A., Chakraborti, T., Konar, A., Tibarewala, D.N. (2014). Automatic feature selection of motor imagery EEG signals using differential evolution and learning automata. Medical & Biological Engineering & Computing, 52(2): 131-139. 10.1007/s11517-013-1123-9
[13] Kaur, B., Singh, D. (2017). Neuro signals: A future biomertic approach towards user identification. In 2017 7th International Conference on Cloud Computing, Data Science & Engineering-Confluence, pp. 112-117. https://doi.org/10.1109/CONFLUENCE.2017.7943133
[14] Chin, T.Z., Saidatul, A., Ibrahim, Z. (2019). Exploring EEG based authentication for imaginary and non-imaginary tasks using power spectral density method. In IOP Conference Series: Materials Science and Engineering, 557(1): 012031. https://doi.org/10.1088/1757-899X/557/1/012031
[15] Valsaraj, A., Madala, I., Garg, N., Patil, M., Baths, V. (2020). Motor imagery based multimodal biometric user authentication system using EEG. In 2020 International Conference on Cyberworlds (CW), pp. 272-279. https://doi.org/10.1109/CW49994.2020.00050
[16] Sun, Y., Lo, F.P.W., Lo, B. (2019). EEG-based user identification system using 1D-convolutional long short-term memory neural networks. Expert Systems with Applications, 125: 259-267.
[17] Yu, T., Wei, C.S., Chiang, K.J., Nakanishi, M., Jung, T.P. (2019). EEG-based user authentication using a convolutional neural network. In 2019 9th International IEEE/EMBS Conference on Neural Engineering (NER), pp. 1011-1014. https://doi.org/10.1109/NER.2019.8716965
[18] Mao, Z., Yao, W.X., Huang, Y. (2017). EEG-based biometric identification with deep learning. In 2017 8th International IEEE/EMBS Conference on Neural Engineering (NER), pp. 609-612. https://doi.org/10.1109/NER.2017.8008425
[19] Wang, M., Hu, J., Abbass, H.A. (2019). Stable EEG biometrics using convolutional neural networks and functional connectivity. Aust. J. Intell. Inf. Process. Syst., 15(3): 19-26.
[20] Balcı, F., Oralhan, Z. (2020). LSTM ile EEG Tabanlı Kimliklendirme Sistemi Tasarımı. Avrupa Bilim ve Teknoloji Dergisi, Ejosat Special Issue 2020 (HORA), 135-141. https://doi.org/10.31590/ejosat.779526
[21] Hang, J.H., Jo, Y.C., Kim, S.P. (2018). Electroencephalographic feature evaluation for improving personal authentication performance. Neurocomputing, 287: 93-101. https://doi.org/10.1016/j.neucom.2018.01.074
[22] Wilaiprasitporn, T., Ditthapron, A., Matchaparn, K., Tongbuasirilai, T., Banluesombatkul, N., Chuangsuwanich, E. (2019). Affective EEG-based person identification using the deep learning approach. IEEE Transactions on Cognitive and Developmental Systems, 12(3): 486-496. https://doi.org/10.1109/TCDS.2019.2924648
[23] Puengdang, S., Tuarob, S., Sattabongkot, T., Sakboonyarat, B. (2019). EEG-based person authentication method using deep learning with visual stimulation. In 2019 11th International Conference on Knowledge and Smart Technology (KST), pp. 6-10. https://doi.org/10.1109/KST.2019.8687819
[24] Barayeu, U., Horlava, N., Libert, A., Van Hulle, M. (2020). Robust single-trial EEG-based authentication achieved with a 2-stage classifier. Biosensors, 10(9): 124.
[25] Sjamsudin F.P. (2017). EEG-based authentication with machine learning. M.S. thesis, Department of Computer Science and Communications Engineering, Waseda University, Tokyo, Japan.
[26] Krishna, V., Ding, Y., Xu, A., Höllerer, T. (2019). Multimodal biometric authentication for VR/AR using EEG and eye tracking. In Adjunct of the 2019 International Conference on Multimodal Interaction, pp. 1-5. https://doi.org/10.1145/3351529.3360655
[27] Mu, Z., Hu, J., Min, J., Yin, J. (2017). Comparison of different entropies as features for person authentication based on EEG signals. IET Biometrics, 6(6): 409-417. https://doi.org/10.1049/iet-bmt.2016.0144
[28] Hendrawan, M.A., Saputra, P.Y., Rahmad, C. (2021). Identification of optimum segment in single channel EEG biometric system. Indonesian Journal of Electrical Engineering and Computer Science, 23(3): 1847-1854.
[29] Liew, S.H., Choo, Y.H., Low, Y.F., Mohd Yusoh, Z.I. (2018). EEG‐based biometric authentication modelling using incremental fuzzy‐rough nearest neighbour technique. IET Biometrics, 7(2): 145-152. https://doi.org/10.1049/iet-bmt.2017.0044
[30] Moctezuma, L.A., Molinas, M. (2019). Event-related potential from eeg for a two-step identity authentication system. In 2019 IEEE 17th International Conference on Industrial Informatics (INDIN), pp. 392-399. https://doi.org/10.1109/INDIN41052.2019.8972231
[31] Fan, Y., Shi, X., Li, Q. (2021). CNN-based personal identification system using resting state electroencephalography. Computational Intel. and Neuro., 2021: 1160454. https://doi.org/10.1155/2021/1160454
[32] Schalk, G., McFarland, D.J., Hinterberger, T., Birbaumer, N., Wolpaw, J.R. (2004). BCI2000: A general-purpose brain-computer interface (BCI) system. IEEE Transactions on Biomedical Engineering, 51(6): 1034-1043. https://doi.org/10.1109/TBME.2004.827072
[33] Hu, J.F. (2010). Biometric system based on EEG signals by feature combination. In 2010 International Conference on Measuring Technology and Mechatronics Automation, pp. 752-755. https://doi.org/10.1109/ICMTMA.2010.27
[34] Touryan, J., Apker, G., Lance, B.J., Kerick, S.E., Ries, A.J., McDowell, K. (2014). Estimating endogenous changes in task performance from EEG. Frontiers in Neuroscience, 8: 155. https://doi.org/10.3389/fnins.2014.00155
[35] Koelstra, S., Muhl, C., Soleymani, M., Lee, J.S., Yazdani, A., Ebrahimi, T., Patras, I. (2011). Deap: A database for emotion analysis; using physiological signals. IEEE Transactions on Affective Computing, 3(1): 18-31. https://doi.org/10.1109/T-AFFC.2011.15
[36] Kasprowski, P., Komogortsev, O.V., Karpov, A. (2012). First eye movement verification and identification competition at BTAS 2012. In 2012 IEEE fifth International Conference on Biometrics: Theory, Applications and Systems (BTAS), pp. 195-202. https://doi.org/10.1109/BTAS.2012.6374577
[37] Goldberger, A.L., Amaral, L.A.N., Glass, L., Hausdorff, J.M., Ivanov, P.C., Mark, R.G., Stanley, H.E. (2000). Components of a new research resource for complex physiologic signals. PhysioBank, PhysioToolkit, and Physionet.
[38] Başar, E. (1980). EEG-brain dynamics: Relation between EEG and brain evoked potentials. Elsevier-North-Holland Biomedical Press.
[39] Steriade, M. (1991). Alertness, quiet sleep, dreaming. In Normal and Altered States of Function, pp. 279-357.
[40] Breiman, L. (2001). Random forests. Machine Learning, 45(1): 5-32. https://doi.org/10.1023/a:1010933404324
[41] Díaz-Uriarte, R., Alvarez de Andrés, S. (2006). Gene selection and classification of microarray data using random forest. BMC Bioinformatics, 7(1): 1-13.
[42] Reif, D.M., Motsinger, A.A., McKinney, B.A., Crowe, J.E., Moore, J.H. (2006). Feature selection using a random forests classifier for the integrated analysis of multiple data types. In 2006 IEEE Symposium on Computational Intelligence and Bioinformatics and Computational Biology, pp. 1-8. https://doi.org/10.1109/CIBCB.2006.330987
[43] Genuer, R., Poggi, J.M., Tuleau-Malot, C. (2010). Variable selection using random forests. Pattern Recognition Letters, 31(14): 2225-2236. https://doi.org/10.1016/j.patrec.2010.03.014
[44] Kohavi, R., John, G.H. (1997). Wrappers for feature subset selection. Artificial Intelligence, 97(1-2): 273-324. https://doi.org/10.1016/S0004-3702(97)00043-X
[45] Guyon, I., Elisseeff, A. (2003). An introduction to variable and feature selection. Journal of Machine Learning Research, 3(Mar): 1157-1182.
[46] Hall, M.A. (2000). Correlation-based feature selection of discrete and numeric class machine learning. (Working paper 00/08). Hamilton, New Zealand: University of Waikato, Department of Computer Science.
[47] Cotter, S.F., Kreutz-Delgado, K., Rao, B.D. (2001). Backward sequential elimination for sparse vector subset selection. Signal Processing, 81(9): 1849-1864. https://doi.org/10.1016/S0165-1684(01)00064-0
[48] Li, J., Cheng, K., Wang, S., Morstatter, F., Trevino, R.P., Tang, J., Liu, H. (2017). Feature selection: A data perspective. ACM Computing Surveys (CSUR), 50(6): 1-45. https://doi.org/10.1145/3136625
[49] Deng. L., Yu, D. (2014). Deep learning methods and applications. Foundations and Trends Signal Processing, (7): 198-250. http://dx.doi.org/10.1561/2000000039
[50] Atkinson, P.M., Tatnall, A.R. (1997). Introduction neural networks in remote sensing. International Journal of Remote Sensing, 18(4): 699-709.
[51] Wu, Q., Zeng, Y., Zhang, C., Tong, L., Yan, B. (2018). An EEG-based person authentication system with open-set capability combining eye blinking signals. Sensors, 18(2): 335. https://doi.org/10.3390/s18020335
[52] Koike-Akino, T., Mahajan, R., Marks, T.K., Wang, Y., Watanabe, S., Tuzel, O., Orlik, P. (2016). High-accuracy user identification using EEG biometrics. In 2016 38th Annual International Conference of the IEEE Engineering in Medicine and Biology Society (EMBC), pp. 854-858. https://doi.org/10.1109/EMBC.2016.7590835
[53] Keshishzadeh, S., Fallah, A., Rashidi, S. (2016). Improved EEG based human authentication system on large dataset. In 2016 24th Iranian Conference on Electrical Engineering (ICEE), pp. 1165-1169. https://doi.org/10.1109/IranianCEE.2016.7585697
[54] Thomas, K.P., Vinod, A.P. (2018). EEG-based biometric authentication using gamma band power during rest state. Circuits, Systems, and Signal Processing, 37(1): 277-289. https://doi.org/10.1007/s00034-017-0551-4
[55] Gui, Q., Ruiz-Blondet, M.V., Laszlo, S., Jin, Z. (2019). A survey on brain biometrics. ACM Computing Surveys (CSUR), 51(6): 1-38. https://doi.org/10.1145/3230632
[56] Kumar, P., Saini, R., Kaur, B., Roy, P.P., Scheme, E. (2019). Fusion of neuro-signals and dynamic signatures for person authentication. Sensors, 19(21): 4641.
[57] Huang, H., Hu, L., Xiao, F., Du, A., Ye, N., He, F. (2019). An EEG-based identity authentication system with audiovisual paradigm in IoT. Sensors, 19(7): 1664. https://doi.org/10.3390/s19071664