Yu Zhang* | Zhenfeng Wei
© 2022 IIETA. This article is published by IIETA and is licensed under the CC BY 4.0 license (http://creativecommons.org/licenses/by/4.0/).
OPEN ACCESS
E-commerce has unmatched advantages over conventional ways of consumption, but it also restricts the amount of contact that customers have with the things they are purchasing. The first step in the transaction product information flow is an effective transaction product display image, which is crucial for product sales. The influence of the emotions present in the current transaction product display image on the buyer's purchase intention has not been established, and as the number of commodity classes rises, there is also a lack of scientific guidance regarding the buyer's efficient retrieval of transaction products. Therefore, this work investigates image classification and retrieval methods for product presentation in e-commerce transactions. A robust network architecture was created for the e-commerce transaction product display and image classification. The image polarity emotion feature extraction backbone module, the polarity emotion intensity perception module, and the emotion feature fusion classification module are the three specific components of the model. The network training approach is an innovation to address the issue that the polarity emotion intensity cannot be effectively conveyed in the e-commerce transaction product display image. The research improves the design of the similarity retrieval algorithm for e-commerce transaction product display images, which increased the retrieval effectiveness for buyers. The correctness of the classification model and retrieval approach was confirmed by the experimental results.
e-commerce, transaction product display, image classification, image retrieval
The percentage of e-commerce in all transaction modes is gradually rising as Internet technology develops [1-7]. E-commerce has unmatched benefits over conventional consumption techniques, but it also restricts the amount of contact that consumers have with the things they are purchasing [8-16]. Therefore, the buyer can only rely on the information provided by the seller in the e-commerce transaction product display in order to understand the transaction product. The informational display of e-commerce transaction products has a direct impact on the buyer's perception of value [17-22]. The first item in the transaction product information flow, which is particularly significant for product sales, is the efficient transaction product display image.
Taxonomies are frequently used on e-commerce websites to better categorize the products. A novel neural product categorization model was put forth by Chen et al. [23] to extract fine-grained classes from product content. By simultaneously recognizing classes from the product content and projecting classes from a predefined class vocabulary, the model classifies products. Extensive tests on actual e-commerce platform datasets show how well the suggested methodology works. Hidden Markov Model (HMM) performance in e-commerce product classification was examined by Mathivanan et al. [24], who also provided a parameter estimation method for HMM evaluation. In order to portray the material colors and textures of products in general, Yamashita and Mujibiya [25] presented a way to assist users in capturing and creating product visualizations. Users can see the product through the auto-discovered view path or manually travel through the automatically detected camera spots. Users may be able to recognize materials and gain a better understanding of product quality by visualizing objects from various perspectives that reveal information about light reflection and refraction. E-commerce systems often use images to communicate qualities that are challenging to describe in plain text. Wroblewska et al. [26] made a contribution to demonstrating how to offer quantifiable measures of product image business quality by highlighting the benefits of deep learning approaches over more conventional methods for identifying information in images.
Insufficient attention is paid to the e-commerce transaction product display image, a special transaction product information, and a lack of in-depth study, as shown by the findings of the current studies conducted both domestically and overseas. As the number of commodity classes rises, there is also a lack of scientific guidance for the buyer's efficient retrieval of transaction products because it has not been established that the emotions present in the current transaction product display image have any effect on the buyer's purchase intention. In order to do this, this work investigates image classification and retrieval methods for product presentation in e-commerce transactions. The network architecture for e-commerce transaction product display and image categorization is designed in section 2. The model primarily consists of three components: the core module for extracting image polarity emotion features, the polarity emotion intensity perception module, and the classification module for emotion feature fusion. The model developed in this paper makes use of the network learning concepts of weak supervision and distributed label smoothing to address the issue that e-commerce transaction product display images are susceptible to, namely the issue that the intensity of polar emotions cannot be accurately reflected. In section 3, the network training method is improved. Section 4 completes the design of the e-commerce transaction product display image similarity retrieval algorithm, which improves the buyer's retrieval efficiency of transaction product display images. The experimental results verify the validity of our classification model and retrieval method.
Considering how the buyer's purchase intention is affected by the emotion content of the product display image in an e-commerce transaction, this study develops a convolutional neural network model for emotion classification in product display images used in e-commerce transactions. The model primarily has three key modules for extracting image polarity emotion feature, perceiving polarity emotion intensity, and classifying emotion feature fusion.
The foundational module of e-commerce transaction product display image polarity emotion feature extraction is built in this article based on the fully convolutional network of ResNet-101. A convolutional layer plus 33 residual blocks make up this module. The convolutional layer is 7 by 7 in size. Three convolutional layers are contained in each residual block. It could either be an identical residual block or a convolutional residual block.
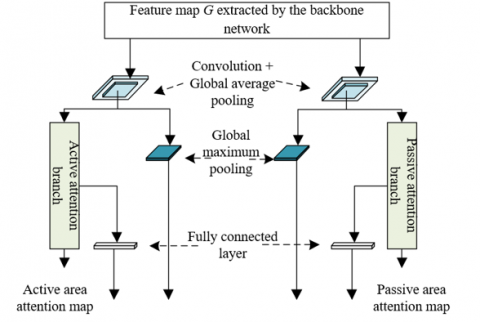
In particular, two parallel branches with the same structure but different parameter sharing are employed by the polarity emotion intensity perception module to identify the positive and negative emotion intensity in the e-commerce transaction product display image. The structural layout of the perception module for polarity emotion intensity is shown in Figure 1.
The feature map G extracted by the backbone network is imported to the branch of the polar emotion intensity perception module. Let q, f, and n be the width, height, and channel number of the feature map, respectively; $G^{\prime} \in R^{q \times f \times n}$ be the output of the feature channel; $X_Z \in R^{1 \times 1 \times n}$ be the weight vector of the feature channel of parallel branches, reflecting the importance of each feature channel. In the module, $G^{\prime} \in R^{q \times f \times n}$ is adjusted by a 1x1 convolutional layer. Then, $X_Z \in R^{1 \times 1 \times n}$ is solved and taken as channel attention. Let FCL(.) be the full connection, GAP(.) be the global average pooling, Ω(.) be the class normalization, and Γ(.) be the ReLU activation function. Then, we have:
$q_Z=G A P\left(G^{\prime}\right)$ (1)
$q_z^{\prime}=F C L\left(\Gamma\left(F C L\left(q_z\right)\right)\right)$ (2)
$X_z=\Omega\left(q_z^{\prime}\right)$ (3)
XZ achieves its dimensionality reduction and dimensionality reduction operations through the bottleneck structure formed by two fully connected layers in the polarity emotion intensity perception module. Then, weight the channel dimension of G' based on dimensionality reduction XZ, and finally obtain the attention map ATTFi corresponding to the positive and negative emotion regions of the e-commerce transaction product display image based on the cross-depth summation operation. Assuming that the element-wise multiplication is represented by ⊗, and the cross-depth summation operation is represented by Sumz(.). Then, ATTFi can be calculated by:
$\operatorname{ATTF}_i=\rho\left(\operatorname{Sum}_z\left(X_{z_i} \otimes G^{\prime}\right)\right)$ (4)
The active emotion intensity yt of the e-commerce transaction product display image can be calculated by:
$u_t=\Gamma\left(F C L\left(q_z\right)\right)$ (5)
The passive emotion intensity ym of the e-commerce transaction product display image can be calculated by:
$y_t=F C L\left(u_t\right)$ (6)
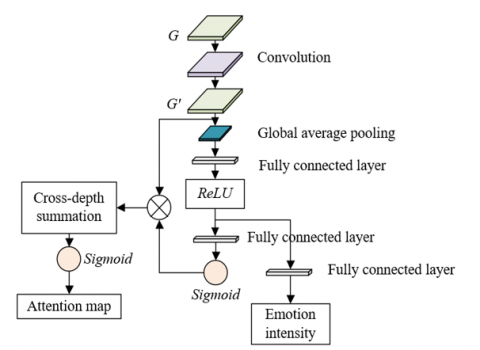
Then, yt and ym are connected in series, and normalized to obtain the overall polar emotion intensity vector y of e-commerce transaction product display image. Figure 2 shows the generation flow of the polar emotion intensity and attention map. The relevant calculations are as follows:
$y=\Omega\left(F D\left(y_t, y_m\right)\right)$ (7)
Figure 1. Structure of the polar emotion intensity perception module
Figure 2. Generation flow
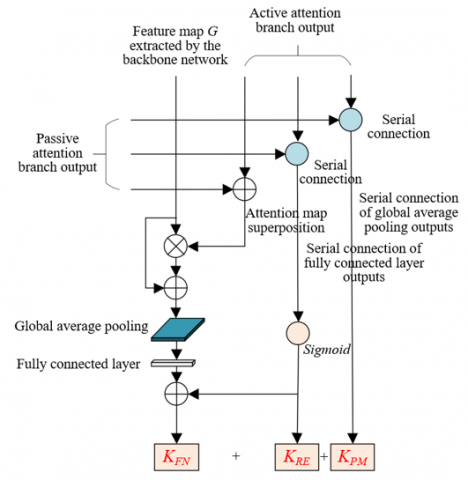
Figure 3. Structure of emotion feature fusion classification module
The output of the polar emotion intensity perception module is combined with the overall features of the product display image in the emotion feature fusion classification module, which completes the classification of the product display image. The structure diagram of the classification module for emotion feature fusion is shown in Figure 3. The network model may pay greater attention to the significant polar emotion regions in the e-commerce transaction product display image if it is given the positive and negative emotion attention Nm and Nt maps that correspond to the positive and negative emotion intensity. Go designates the features that result from feature fusion using leftover blocks. Go can be calculated by:
$G_o=G+\Omega\left(N_m+N_t\right) \otimes G$ (8)
The positive and negative emotion vectors of product display images can be obtained by Go through the global average pooling operation, and the emotion probability distribution of product display images can be predicted by inputting the emotion vectors into the fully connected layer. Finally, by superimposing y and the prediction result of the emotion probability distribution, the final polarity emotion score B of the e-commerce transaction product display image can be obtained. The calculation formula is:
$B^{\prime}=\Gamma\left(F C L\left(\operatorname{GAP}\left(G_o\right)\right)+y\right)$ (9)
The polarity emotion classification model for e-commerce transaction product display images developed in this study learns the results of two parallel branches based on class labels, including positive and negative emotion attention maps, emotion intensity, and the final polar emotion classification results of e-commerce transaction product display images. Since image-level tags are typically used to identify product display images for e-commerce transactions, there is a risk that the intensity of polar emotions will not be adequately conveyed. To address this issue, the model developed in this paper, which refers to the network learning concepts of distributed label smoothing and weak supervision, innovates the network training method.
Let $\{A, B\}=\left\{\left(A_i, B_i\right)\right\}^{M_{i=1}}$ be a training set containing $\mathrm{M}$ transaction product display image samples, the image sample is represented by $A_i$, and the emotion class label of $A_i$ is represented by $B_i \in\{0,1\}$. Assume that the weighting coefficients of the corresponding item loss function are represented by $\mu_1$ and $\mu_2$, the loss function that guides the learning of the polar emotion intensity perception module is represented by $K_{P M}$, the loss function that constrains the intensity of polar emotion is represented by $K_{R E}$, and the loss function that constrains the final polar emotion classification result Represented by $K_{F N}$. The multi-task loss function of the network model can be expressed as:
$K=K_{P M}+\mu_1 K_{F N}+\mu_2 K_{R E}$ (10)
In order to improve the detection accuracy of the two parallel branches of the polar emotion intensity perception module on the emotion regions of different polarities in the transaction product display image, the model constructed in this paper sets the loss function KPM:
$K_{P M}(B, u)=-\frac{1}{M} \sum_{i=1}^M \sum_{j=t, m} B_i^j \log \left(u_i^j\right)$ (11)
Let $u_i \in R^2$ be the predicted emotion polarity of transaction product display image; FD(.) be the serial connection; GAPmax(.) be the global average pooling; $G^{t^{\prime}}{ }_i$ and $G^{m^{\prime}}{ }_i$ be the active emotion feature map and passive emotion feature map, respectively. The calculation flow can be expressed as follows:
$u_i^t=G A P_{\max }\left(G A P\left(G_i^{t^t}\right)\right)$ (12)
$u_i^m=G A P_{\max }\left(G A P\left(G_i^{m^{\prime}}\right)\right)$ (13)
$u_i=\Gamma\left(F D\left(u_i^t, u_i^m\right)\right)$ (14)
To ensure that the predicted value of the image polarity emotion intensity output by the network model is positively correlated with the real value of the image emotion of the ecommerce transaction product display, it is assumed that $\Psi($. $)$ is the tanh activation function; |.|1 is the $K_1$ norm; $B_i-\dot{B}_i$ is the label mapping of image $A_i ; y^{m_i-y_i^t}$ is the polar emotion intensity difference of $A_i$. Both $B_i-\dot{B}_i$ and $y^m{ }_i-y_i^t$ fall in the value range of $\{-1,1\}$. This paper introduces the polar consistent constraint loss function $K_{R E}$ :
$K_{R E}(B, y)=\frac{1}{M} \sum_{i=1}^M\left|\Psi\left(B_i-\dot{B}_i\right)-\Psi\left(y_i^m-y_i^t\right)\right|_1$ (15)
To display the polar emotion of the e-commerce transaction product display image in the form of intensity, this paper caries out distributed label training of KFN:
$K_{F N}\left(B, B^{\prime}\right)=\frac{1}{M} \sum_{i=1}^M \sum_{j=t, m} u_i^j \log \left(B_i^{\prime j}\right)$ (16)
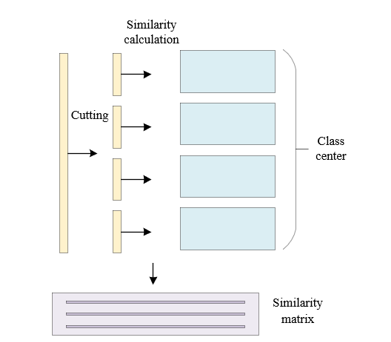
Figure 4. Similarity calculation process
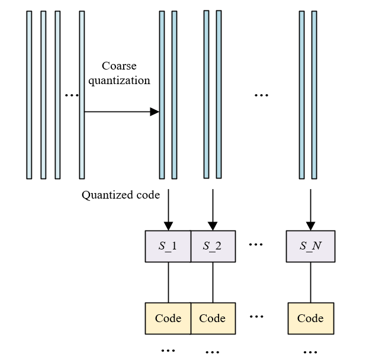
Figure 5. Flow of coarse quantization
Improving the buyer's ability to retrieve transaction product display images is vital to encourage the successful transaction of e-commerce goods. The idea of the traditional similarity retrieval algorithm is used in this paper. It compares the eigenvectors of the e-commerce transaction products that the buyer must identify to the eigenvectors in the transaction product feature database, calculates their similarity, sorts them from large to small, and then recommends the transaction product images with the highest similarity to the buyer as search results.
Assume that the eigenvector of the e-commerce transaction product to be identified and the vector in the transaction product feature library are represented by X=(x1,x2,…,xr)T and Y=(y1,y2,…,yr)T, respectively. The similarity can be calculated based on Euclidean distance and cosine distance:
$C_{E D}(X, Y)=\sqrt{\sum_{i=1}^r\left(X_i-Y_i\right)^2}$ (17)
$C_{C D}(X, Y)=1-\frac{\sum_{i=1}^r X_i Y_i}{\sqrt{\sum_{i=1}^r X^2}{ }_i \sqrt{\sum_{i=1}^r Y^2{ }_i}}$ (18)
The amount of feature vectors in the feature library is enormous for linearly increasing e-commerce transaction products. Comparing features, calculating similarity, and ranking all take a long time. As a result, the traditional similarity retrieval algorithm is optimized in this paper based on the improved product quantization algorithm, which compresses the vast e-commerce transaction product retrieval space through clustering operations. This optimization decreases the complexity and processing time of the algorithm. The steps of the algorithm are as follows:
Step1: The vectors in the e-commerce transaction product feature library must first be quantized and encoded.
Step 2: Following the completion of the quantitative coding, the distance between each feature vector in the transaction product feature library and the feature vector of the e-commerce transaction product to be identified is calculated, i.e., the distance is determined in the similarity matrix and accumulated. The similarity calculation technique is shown in Figure 4.
Step3: Sort the similarity calculation results to obtain the transaction product display image retrieval results.
Although the quantitative coding operation of the feature vectors to be identified for e-commerce transaction products greatly simplifies the calculation process of the similarity retrieval algorithm, it is necessary to perform distance calculations on all feature vectors in the transaction product feature library to obtain a similar sample of e-commerce transaction products to be identified beforehand in order to reduce the number of similarity calculations. This study introduces a coarse quantization step before the quantization encoding stage as a result. The coarse quantization steps are displayed in Figure 5.
In this section, this paper compares the constructed e-commerce product display image classification network model with 11 existing advanced image classification models to verify the superiority of the constructed model. Table 1 compares the performance of different image classification models in different sample sets.
As shown in Table 1, compared with state-of-the-arts like ImageNet, AlexNet, VGGNet, GoogLeNet, ResNet, MobileNet, EfficientNet, EfficientDet, NFNet, Faster R-CNN, and CenterNet, our model achieved better indices on all six e-commerce transaction product datasets.
The model in this study divides the polar emotion sections of the image to be identified and predicts the polarity of each zone, avoiding the classification results being impacted by other algorithms that integrate global features, visual attention, and multi-scale data to predict image emotion. There are instances where significant errors are produced without respect to the impact of features. As a result, the model in this study can more accurately anticipate how consumers will feel about e-commerce transaction products, increasing the impact of those outcomes on consumers' purchase intentions. The distributed label smoothing method, which is used in this paper to learn and train the network model, enhances the network model's capacity for learning and reduces noise in the sample set. As a result, the performance of the model in this work significantly outperforms that of other image classification models on sample sets 2, 3, and 5. Additionally, compared to other image classification models, the model from this paper with the polar emotion intensity perception module configured has less network parameters.
In order to verify the effectiveness of the polar emotion intensity perception module set in this paper, and the generalization of the calculation of positive and negative emotion intensities, this paper conducts a structural ablation experiment, and Table 2 gives the corresponding experimental results.
Table 1. Performance comparison of different image classification models
|
Algorithm |
Parameter size |
Sample set 1 |
Sample set 2 |
Sample set 3 |
Sample set 4 |
Sample set 5 |
Sample set 6 |
|
ImageNet |
- |
52.41 |
69.15 |
64.37 |
66.01 |
61.38 |
69.72 |
|
AlexNet |
- |
60.38 |
72.48 |
72.61 |
74.53 |
64.52 |
74.58 |
|
VGGNet |
152M |
85.63 |
62.15 |
69.45 |
76.51 |
74.19 |
73.92 |
|
GoogLeNet |
23.14M |
81.27 |
70.36 |
63.72 |
74.29 |
78.25 |
71.28 |
|
ResNet |
43.62M |
89.51 |
79.48 |
70.64 |
78.01 |
73.62 |
73.85 |
|
MobileNet |
- |
83.62 |
- |
- |
70.63 |
79.51 |
81.69 |
|
EfficientNet |
- |
81.69 |
85.26 |
82.39 |
74.58 |
73.15 |
85.37 |
|
EfficientDet |
40.96M |
- |
84.31 |
85.15 |
- |
- |
- |
|
NFNet |
41.58M |
87.26 |
- |
- |
71.62 |
70.59 |
89.41 |
|
Faster R-CNN |
- |
84.62 |
89.42 |
86.39 |
- |
- |
87.26 |
|
CenterNet |
57.42M |
93.58 |
- |
- |
85.74 |
73.85 |
83.74 |
|
Our model |
49.68M |
94.16 |
88.39 |
84.27 |
81.69 |
85.37 |
83.59 |
Table 2. Results of structural ablation experiment
|
Method |
Sample set 1 |
Sample set 2 |
Sample set 3 |
Sample set 6 |
|
ImageNet |
60.24 |
61.38 |
72.46 |
82.41 |
|
AlexNet |
72.69 |
62.41 |
72.38 |
86.39 |
|
VGGNet |
75.81 |
72.63 |
71.52 |
81.27 |
|
AlexNet+single branch attention |
83.62 |
86.29 |
85.69 |
93.62 |
|
Our model minus coarse quantization |
88.59 |
84.27 |
83.74 |
85.27 |
|
Our model (ImageNet) |
81.37 |
81.06 |
81.57 |
81.69 |
|
Our model (AlexNet) |
87.26 |
89.24 |
89.62 |
87.25 |
|
Our model (VGGNet) |
89.41 |
87.49 |
80.57 |
90.38 |
Table 3. Time costs of different retrieval models
|
Eigenvector number |
Time cost of conventional method |
Time cost of our method |
|
100000 |
13.6 |
1.3 |
|
200000 |
25.1 |
1.5 |
|
500000 |
73.5 |
1.9 |
|
1000000 |
125.8 |
2.7 |
1)
2)
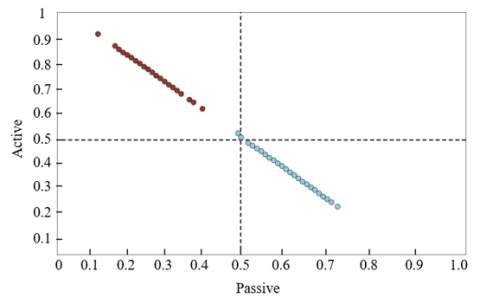
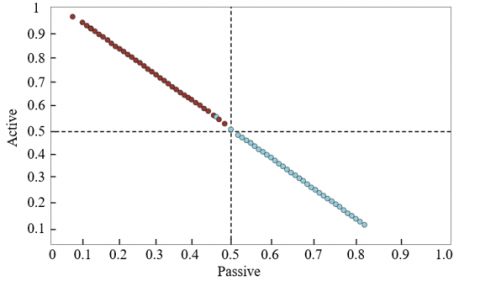
Figure 6. Scatterplot of positive and negative emotion intensity predictions for transaction product images
Table 4. Performance comparison of similarity measurement methods and retrieval algorithms
|
Similarity measure |
Retrieval algorithm |
Retrieval time cost |
Accuracy |
|
CED |
Conventional method |
2.36 |
92.68 |
|
CED |
Optimized by product quantization |
0.12 |
89.27 |
|
CED |
Optimized by improved product quantization |
0.74 |
90.63 |
|
CCD |
Conventional method |
2.96 |
97.48 |
|
CCD |
Optimized by product quantization |
0.15 |
90.52 |
|
CCD |
Optimized by improved product quantization |
0.13 |
96.74 |
Table 2 shows that the classification accuracy is lowest when only the backbone module of image polarity emotion feature extraction is used to extract the global characteristics of e-commerce transaction product images. Performance has increased greatly when ImageNet, AlexNet, and VGGNet are used in place of the created model's backbone network, proving the generalizability of the configuration for the polar emotion intensity perception module.
To verify whether the prediction of the polarity intensity of each polar region of the e-commerce transaction product display image is effective and whether the positive and negative emotion intensities show a certain positive correlation, this paper uses the form of scattered points in the two-dimensional coordinate space to analyze the polarity intensity of the polarity area. Figure 6 shows the scatterplot of positive and negative emotion intensity predictions of transaction product images corresponding to different sample sets. It can be seen that the upper left area and the lower right area of the scatter plot respectively gather the predicted values of emotion intensity of positive samples and negative samples, and the overall positive and negative emotion intensities show a strong positive correlation. The main reason is that the model in this paper introduces the loss function KRE that constrains the intensity of polar emotion and the loss function that guides the learning of the polar emotion intensity perception module is KPM, which further verifies the rationality of setting the polar emotion intensity perception module.
Table 3 shows the time costs of different retrieval models. It can be seen that with the increase of the number of eigenvectors, the time consumption of traditional method retrieval continues to increase linearly. However, the retrieval method based on the improved product quantization algorithm optimization takes only about 1/70 of the time-consuming of the traditional method retrieval algorithm, reflecting a huge advantage in retrieval efficiency.
Table 4 compares the performance of similarity measurement methods and retrieval algorithms. It can be seen that, when the retrieval algorithm is the same, the image retrieval accuracy of e-commerce transaction products corresponding to the similarity calculation method based on cosine distance CCD is higher, but the algorithm time cost correspondingly increases. When the similarity measurement method is the same, compared with the traditional method retrieval algorithm, the improved product quantization algorithm optimization retrieval algorithm adopted in this paper reduces the retrieval accuracy by 2.05% and 0.74%, respectively, but increases the time cost by 1.62ms and 2.83ms. Compared with the traditional product quantization algorithm optimization retrieval algorithm, the proposed improved product quantization algorithm optimization retrieval algorithm improves the retrieval accuracy rate by 1.36% and 6.22% under the condition that the retrieval time cost is not much different, which verifies the retrieval accuracy and effectiveness of our method.
This study investigates image classification and retrieval techniques for displaying products in e-commerce transactions. The polar emotion intensity perception module, the emotion feature fusion classification module, and the image polarity emotion feature extraction backbone module were all explicitly included in the design of the e-commerce transaction product display image classification network architecture. The network training approach is an innovation to address the issue that the polarity emotion intensity cannot be effectively conveyed in the e-commerce transaction product display image. completed the design of the similarity retrieval algorithm for e-commerce transaction product display photos, which increased the retrieval effectiveness for buyers. The proposed e-commerce product display image classification network model is compared with 11 other sophisticated image classification models using both experiments and comparisons to demonstrate the constructed model's superiority. The structural ablation experiment was conducted, the associated experimental findings were presented, and the polarity intensity of each polar zone was visually confirmed as scattered points in the two-dimensional coordinate space. In this article, the effectiveness of the polar emotion intensity perception module is set. Its generalizability for calculating affective intensities (both positive and passive). The efficiency of the retrieval method suggested in this research is confirmed by the labor-intensive comparison findings of various retrieval models and the performance comparison results of various similarity assessment methods and retrieval algorithms.
This paper was supported by the Research Subject of China Education Information Technology. “Research on the Development and Application of Higher Vocational E-commerce Entrepreneurship Training Guidance Platform Based on Open API”, (Grant No.: 186140029); and the Research on the Construction of Teaching Innovation Team of the Ministry of Education of China. “Research on teaching quality evaluation system of Teaching Innovation Team in higher vocational colleges” (Grant No.: ZI2021010106).
[1] Cerqueus, T., Bonnaud, J., Dashkov, O., Morin, E. (2020). Thesaurus matching in electronic commerce. Electronic Commerce Research, 22(2): 513-538. https://doi.org/10.1007/s10660-020-09438-9
[2] Wu, W., Lin, D. (2020). Optimal quality of information service in an electronic commerce website. In International Conference in Communications, Signal Processing, and Systems, 1-8. https://doi.org/10.1007/978-981-15-8411-4_1
[3] Sriwardiningsih, E., Saputra, P.C., Wibowo, S.H., Febriani, D., Riyanto, S. (2021). The effectiveness of electronic WOM in electronic commerce and social media. In 2021 3rd International Conference on Cybernetics and Intelligent System (ICORIS), 1-6. https://doi.org/10.1109/ICORIS52787.2021.9649596
[4] Kukartsev, V.V., Volneikina, E.S., Zinner, S.E., Strokan, A.I., Briukhanova, E.R., Pikov, N.O. (2021). Evaluating possible classifications of websites by design type in electronic commerce. In Journal of Physics: Conference Series, 2032(1): 012126. https://doi.org/10.1088/1742-6596/2032/1/012126
[5] Chen, D., Liu, Y. (2020). Big data helps the healthy development of rural electronic commerce. In International conference on Big Data Analytics for Cyber-Physical-Systems, 1321-1326. https://doi.org/10.1007/978-981-33-4572-0_190
[6] Panasenko, S., Seifullaeva, M., Ramazanov, I., Mayorova, E., Nikishin, A., Vovk, A.M. (2022). Impact of the pandemic on the development and regulation of electronic commerce in Russia. International Journal of Advanced Computer Science and Applications, 13(5): 652-658. https://doi.org/10.14569/IJACSA.2022.0130576
[7] Feng, L. (2022). Application research of computer artificial intelligence technology in electronic commerce information retrieval system. In 2022 IEEE 2nd International Conference on Electronic Technology, Communication and Information (ICETCI), 1374-1377. https://doi.org/10.1109/ICETCI55101.2022.9832320
[8] Park, J., Waqar, Z. (2022). Life cycle assessment of returnable mailers used for apparel electronic commerce: A case study in Canada. Packaging Technology and Science, 35(9): 651-662. https://doi.org/10.1002/pts.2653
[9] Xiao, Y. (2022). Compensation method of electronic commerce data transmission delay based on fuzzy encryption algorithm. Mobile Networks and Applications, 27(4): 1339-1348. https://doi.org/10.1007/s11036-022-01924-8
[10] Song, X., Yang, S., Huang, Z., Huang, T. (2019). The application of artificial intelligence in electronic commerce. In Journal of Physics: Conference Series, 1302(3): 032030. https://doi.org/10.1088/1742-6596/1302/3/032030
[11] Okamoto, T., Yatsuhashi, J., Mizutani, N. (2019). Japanese University students’ acceptance of cross-border electronic commerce. In International Conference on Multidisciplinary Social Networks Research, pp. 106-117. https://doi.org/10.1007/978-981-15-1758-7_9
[12] Yuan, L., Dennis, A.R. (2019). Acting like humans? Anthropomorphism and consumer’s willingness to pay in electronic commerce. Journal of Management Information Systems, 36(2): 450-477. https://doi.org/10.1080/07421222.2019.1598691
[13] Zhang, S.F. (2019). Electronic commerce commodity entity identities based on hierarchical probability model. Cluster Computing, 22(4): 7787-7794. https://doi.org/10.1007/s10586-017-1437-8
[14] Burunova, A., Ponomarev, A., Teslya, N. (2019). Enactable electronic contracts in e-commerce: models, technologies and architectures. In 2019 24th Conference of Open Innovations Association (FRUCT), pp. 54-59. https://doi.org/10.23919/FRUCT.2019.8711951
[15] Herzallah, F.A., Al-Sharafi, M.A., Alajmi, Q., Mukhtar, M., Arshah, R.A., Eleyan, D. (2018). Conceptualizing a model for the effect of information culture on electronic commerce adoption. In International Conference of Reliable Information and Communication Technology, pp. 861-870. https://doi.org/10.1007/978-3-319-99007-1_80
[16] Yang, Q., Ye, Y. (2018). A dual-channel equilibrium management model for service products under electronic commerce environment. IEEE Access, 7: 702-713. https://doi.org/10.1109/ACCESS.2018.2885650
[17] Gao, S., Ren, Z., Zhao, Y., Zhao, D., Yin, D., Yan, R. (2019). Product-aware answer generation in e-commerce question-answering. In Proceedings of the Twelfth ACM International Conference on Web Search and Data Mining, pp. 429-437. https://doi.org/10.1145/3289600.3290992
[18] Vovk, A., Tochilkin, D., Narayana, P., Sone, K., Basu, S. (2019). Product phrase extraction from e-commerce pages. In Companion Proceedings of the 2019 World Wide Web Conference, pp. 393-397. https://doi.org/10.1145/3308560.3316608
[19] Kulkarni, A., Mehta, K., Garg, S., Bansal, V., Rasiwasia, N., Sengamedu, S. (2019). Productqna: Answering user questions on e-commerce product pages. In Companion Proceedings of the 2019 World Wide Web Conference, 354-360. https://doi.org/10.1145/3308560.3316597
[20] Suvarna, A., Dey, K., Nagar, S., Madaan, N., Mehta, S. (2019). Handling gender biases in e-commerce product specifications. In 2019 Grace Hopper Celebration India (GHCI), pp. 1-5. https://doi.org/10.1109/GHCI47972.2019.9071916
[21] Wang, J. (2019). Countermeasures for the development of agricultural product e-commerce. In International Conference on Application of Intelligent Systems in Multi-modal Information Analytics, pp. 1469-1473. https://doi.org/10.1007/978-3-030-15740-1_189
[22] Skinner, M., Kallumadi, S. (2019). E-commerce Query Classification Using Product Taxonomy Mapping: A Transfer Learning Approach. In eCOM@ SIGIR.
[23] Chen, H., Zhao, J., Yin, D. (2019). Fine-grained product categorization in e-commerce. In Proceedings of the 28th ACM International Conference on Information and Knowledge Management, 2349-2352. https://doi.org/10.1145/3357384.3358170
[24] Mathivanan, N.M.N., Ghani, N.A.M., Janor, R.M. (2019). Text classification of e-commerce product via hidden Markov model. In SoMeT, 310-318.
[25] Yamashita, S., Mujibiya, A. (2015). POVeye: enhancing e-commerce product visualization by providing realistic image based point-of-view. In Proceedings of the 6th Augmented Human International Conference, pp. 199-200. https://doi.org/10.1145/2735711.2735807
[26] Wróblewska, A., Czerwiński, M., Pięta, L., Fleiszer, A., Sędek, M., Bartczak, T., Bogusz, D. (2018). Optimal products presentation in offer images for e-commerce marketplace platform. In 2018 Baltic URSI Symposium (URSI), pp. 287-291. https://doi.org/10.23919/URSI.2018.8406704