Sajja Tulasi Krishna* | Hemantha Kumar Kalluri
© 2022 IIETA. This article is published by IIETA and is licensed under the CC BY 4.0 license (http://creativecommons.org/licenses/by/4.0/).
OPEN ACCESS
A public health emergency threat is happening due to novel coronavirus 2019 (nCoV-2019) throughout the world. nCoV-2019 is also named Severe Acute Respiratory Syndrome-CoronaVirus-2 (SARS-CoV-2). COVID-19 is the disease caused by this virus. The virus originates in bats and is transmitted to humans by some unidentified intermediate animals. This virus started around December 2019 at Wuhan of China. After that, it turned into a pandemic. Even though there is no efficient vaccination, the entire world fights against the COVID-19. This article presents an overview of the scenario of the world as well as India. Some of the leading countries in the world are also affected by this virus badly. Even India is the 2nd highest population, is taking necessary precautions to protect it. With the Government of India's decisions, along with effective social distancing and hygienic measures, India is in a better position. But, in the future, COVID19 cases in India, still unpredictable. We designed an algorithm based on Convolutional Neural Network (CNN), which helps to classify COVID19+ and COVID19- persons using people's chest X-ray images automatically generated within the shortest time. The proposed method discovered that employing CT scan medical images produced more accurate results than X-ray images.
coronavirus, COVID19, SARS, convolutional neural network, CT scan images
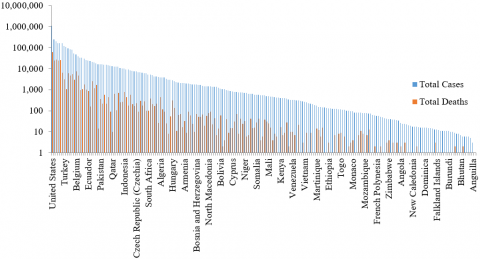
In 2019, the novel Corona Virus (nCoV-2019) or Severe Acute Respiratory Syndrome-CoronaVirus-2 (SARS-CoV-2) spread exponentially from Wuhan City, the capital of China Hubei Province, to the rest of the countries [1]. The root cause of this virus came from bats to humans, and unknown intermediate animals transmitted it. From there onwards, it spreads human to human [2]. Coronavirus first started in December 2019 in China. Firstly, it considers an epidemic when it is in China, but rapidly it spreads to the other countries, become into a pandemic. On 30 January 2020 COVID-19 was declared an international emergency for public health by the World Health Organization (WHO), and also, it has announced the novel COVID-19 outbreak a global pandemic on 11th March 2020 by WHO Director-General, Dr. Tedros Adhanom Ghebreyesus [3]. From December 2019 to March 2022, around 472 816 657 confirmed cases and 6 099 380 confirmed deaths have been reported from 213 out of 233 countries or territories globally [4], and its graphical representation shown in Figure 1.
To diagnose COVID-19 disease, present a few diagnostic test methods [5] are available, they are Reverse Transcription Polymerase Chain Reaction (RT-PCR), this is present test system for COVID-19. Still, it is too costly. Another diagnostic system is Loop-Mediated Isothermal Amplification (LAMP): It is a less developed testing system. Lateral flow is another testing system that is hand-held but single-use for an individual patient. An enzyme-linked immunosorbent assay (ELISA) fast and simple usage system ELISA test is not yet well for COVID-19 testing. All these diagnostic systems had their limitations, due to that the current situation demands a fast, cost-efficient, and accurate method.
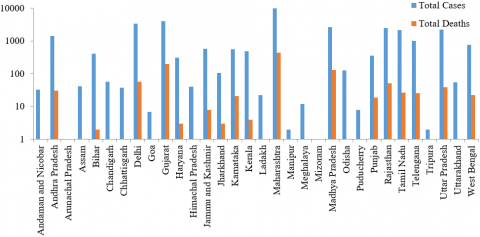
In India, a total of 43,018,032 COVID19+ cases and 520,885 deaths have been reported up to March 2022, included with 111 foreign nationals, belonging to 32 states/union territories [6]. The COVID19+ cases report of each state in India is shown in Figure 2, a graphical representation; of the data provided by the Indian government [7]. The disease is mainly caused by the transmission of droplets, contact with infected persons. The fecal-oral transmission was also observed in the fecal samples of the USA and China affected persons [8, 9]. The incubation period of this virus in the human body is approximately 2 to 14 days. During this period, may observe the symptoms like dry cough, fever, throat pain, breathing problem, uneasiness.
Krishna and Kalluri [10] gave a brief review of the CNN and pre-trained networks about detecting and recognizing objects. Sajja et al. [11] proposed a novel network, which detects lung cancer very effectively. The researchers proposed net classifying the malignant and benign CT scan images with 99% accuracy in lung cancer. Hussain et al. [12] used a transfer learning technique to classify the images from large datasets and got 96.5% accuracy. Sethy and Behera [13] compared with the existing networks such as AlexNet, VGG16, VGG19, Resnet50, and GooleNet and decided that ResNet50 gave 95.38% accuracy, which detects the COVID19 disease based on features. Sajja and Kalluri [14] have classified Gender through SVM and SCGBPNN. In this method, the features are extracted manually using the LBPH method. Later, the feature vector is fed to polynomial SVM and SCG Back Propagation Neural Network to achieve 100% accuracy. Still, this method is applied for small datasets, and also, this is not automatic. Pandit et al. [15] the authors explored the results by using the VGG-16 model for classification, they reported 96% accuracy only.
Al-Waisy et al. [16] The suggested COVID-CheXNet system improved image quality and reduced noise by using the CLAHE technique and the Butterworth bandpass filter, respectively. The suggested COVID-CheXNet system has achieved comparable results to expert radiologists, with a DAR of 99.99%.
The remaining manuscript is explained as follows: The history, symptoms, and preventive measures of the coronavirus are briefed in Section 2. Section 3 discussed the methodology of the proposed system. Section 4 gives the experimental setup and results of the network. The conclusions are made in Section 5.
Figure 1. Country/Territories COVID-19 report in Globe
Figure 2. State-wise COVID-19 report in India
Since December 2019, in Wuhan of China, patients have been continuously suffering from fever, dry cough, reduced number of white blood cells diagnosed as pneumonia. SARS - CoV-2 has been identified as the agent causing this unexplained infected pneumonia. After that, bat coronaviruses were given special attention. Because two coronaviruses have already emerged that cause unexpected illnesses in humans.
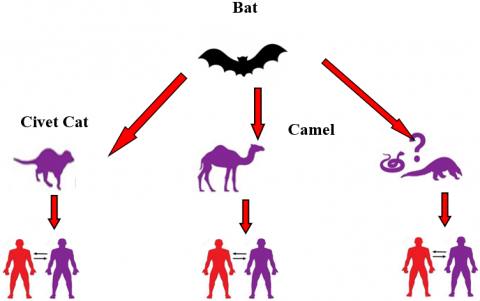
The 21st century is due for bats as a consequence of Severe Acute Coronavirus Syndrome (SARS-CoV) and the Middle-Eastern Coronavirus Respiratory Syndrome (MERS-CoV). So, Bats are identified as the potential repositories of a wide variety of viruses [2]. Various known coronaviruses are circulating in animals, but humans do not yet infect them. Earlier, two coronaviruses are observed as epidemics [17]. SARS source country is Hong Kong in China; SARS-CoV was transmitted due to Asian civet cats to humans in China in 2002. MERS source country is Saudi Arabia. MERS-CoV was transmitted due to camels to humans in Saudi Arabia in 2012. In 2019, the pandemic novel Corona Virus source country was China's Wuhan city. nCoV-2019 transmitted through unknown animals to humans. Flowchart for the transition of the virus and the sources of coronavirus seen in Figure 3. Based on currently available information, coronaviruses may be transmitted from person to person through droplets or contact, etc. The reported cases and death cases of total and origin country, the relationship of SARS, MERS, and COVID19 are shown in Figure 4 for comparative purposes.
For conversational sake, some buzzwords are used to know the importance of those and help understand the health news. Regularly some words we frequently hear such as Pandemic, Epidemic, and Outbreak [18].
• AN EPIDEMIC is a buzzword that describes a disease that affects a wide geographical region of more people than usual, for example, Ebola.
• A PANDEMIC is an epidemic; it spreads in a geographical region and affects Whole County or multiple countries.
AN OUTBREAK is an increasingly unknown disease rapidly than expected. If it is not controlled, then it can become an epidemic.
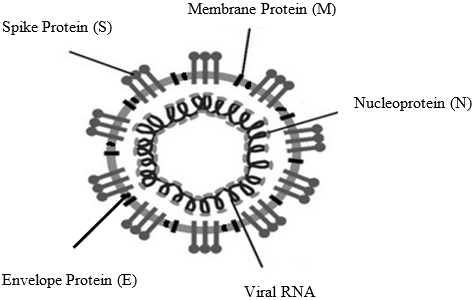
Present, the entire world is rigorously fighting with an invisible enemy, which is popular nowadays as the coronavirus. The disease caused by this virus is termed COVID-19 [19]. The persons affected by this virus are called COVID-19+ patients. Under the microscope, the virus appears as a point structure that is covered like a crown. The schematic diagram of the coronavirus is shown in Figure 5.
Coronavirus structure has four main structural proteins, such Spike protein (S), Membrane protein(M), an Envelope protein (E), and Nucleoprotein (N) [20].
Spike Protein (S)
Coronavirus, Spike, S is an important viral transcriptional protein multifunctional. The S protein is between 1160 and 1400 amino acids. The Spike is preferably one of the vital immune-dominant coronaviral proteins which can induce immune action in the host.
Membrane Protein (M)
The M protein is the viral protein most critically found in a virion particle and gives the viral envelope a definite form. It contains N protein and acts as a key organizer for the assembly of coronaviruses.
Envelope Protein (E)
The coronaviruses, E, are the smallest and most enigmatic of the main structural proteins. In pathogenesis, assemblage, and release of the virus, it has a multifunctional role.
Nucleoprotein (N)
Coronavirus N protein is multifunctional. The M protein interaction, which is necessary during the virus assembly, facilitates and improves the virus transcription efficiency, plays a part among several functionalities in complex formation.
Symptoms
In humans, novel coronavirus (nCoV-2019) causes a mild infection in the upper respiratory portion, like the common old, but more severe in lower respiratory region infections. These infections have been declared as pneumonia or a severe respiratory illness called a nCoV SARS-2 or coronavirus disease 19 (COVID-19). If persons are affected with COVID-19, they might be suffering from some symptoms like dry cough, fever, runny nose, muscle aches, sore throat, and taste loss. Some rare cases may lead to severe breathing problems, kidney failure, and causes death.
Preventive measures
Still, there is no vaccination for nCoV-2019 but follows social distancing and maintains effective hygienic practices [21]. The two most successful preventive measures to control the outbreak are currently in place.
The only efficient method is Lockdown to maintain social distancing. Chloroquine derivative hydroxyl chloroquine (HCQ) sulfate is effective against novel coronavirus [22]. Fortunately, this drug is produced in India, despite the shortage of medicines. All countries urged for medicines [23].
As COVID-19+ growth rates grew up on 21 March 2020, Indian Prime Minister Shri Narendra Modi, on 22 March 2020, declared "Janata Curfew" a one-day lockdown, which reduced positive growth from 3 to 1 [24]. This led to a 21-day further Lockdown declaration in the country until 14 April 2020. During this period, the cases were increased rapidly. The government focused on the rapid growth, then the viral news coming out as most of the positive persons participate, a religious meeting named "TablighiJamaat" at Nizamuddin in Delhi held in March. Day by day, the cases are grown; this leads to the lockdown period further extended up to 3rd May 2020 again it was extended to 17th May 2020. Due to this Lockdown and self-hygienic, the positive cases are significantly less compared to other countries in India.
Figure 3. Flowchart for coronavirus transition from the origin (Bat) to human
Figure 4. Comparative relation between SARS, MERS, and COVID-19 cases the origin (Bat) to human
Coronavirus
Figure 5. Schematic representation of the nCov-2019 structure the origin (Bat) to human
Currently, due to a lack of diagnosis systems everywhere, this causes a panic situation. From the above section, we concluded the COVID19 attacks on the respiratory system, so we can use X-ray images to analyze the patient belongs to COVID19+ or COVID19-. The X-ray images are easily available with the diagnostics, and nearly all hospitals have X-ray machines. It is possible to use X-ray images to test this disease without particular test kits. Based on the X-ray images, we can't say directly whether a person is negative or positive. We need a radiology expert who belongs to analyze the X-ray images properly, which is also time taking and precious in this situation. Therefore, an automated system is necessary to make decisions that save experts’ time.
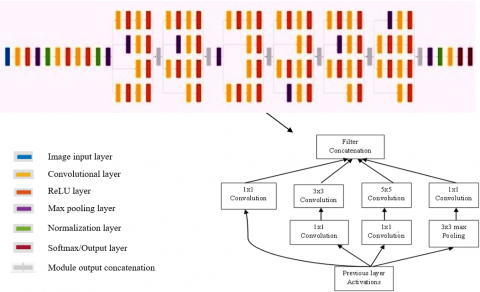
This paper proposed a model to classify the positive and negative persons based on the automated system. This system constitutes convolutional neural networks. For classifications some existing architectures developed such as AlexNet [25], GoogleNet [26], VGG16 [27, 28], VGG19 [28] and ResNet50 [28, 29]. The problem is analyzed using these existing architectures and the proposed model. To sum up, the performance of the proposed model is better than modern models. The proposed architecture and a detailed module view are shown in Figure 6.
The proposed network consists of an input layer that accepts a 224x224 size image, followed by three convolutional layers before modules, a fully connected layer, a softmax layer, and an output classification layer. In the proposed network, we used six modules containing a stack of convolutional layers. Each module is constructed with different sizes of kernels. Instead of applying the kernels directly in the module, we used 1x1 convolution before kernels (3x3, 5x5), then all the convolution results are concatenated at the end of the module. Because of these 1x1 convolutions, the number of dimensions was reduced drastically, which leads to less learnable parameters. The proposed net was trained with 2,618,722 lakhs, learnable parameters, detailed layers, and learnable parameters in Table 1. The proposed net achieved good performance with lakhs of parameters only, but pre-trained networks trained with millions of parameters [10]. The parameter comparison with pre-trained networks is placed in Table 2. It achieves better performance results than the existing nets.
Figure 6. Proposed architecture (from left to right)
Table 1. Proposed net parameter calculations for convolutional layers and their modules
|
Name |
Kernel Size |
Activations |
Learnable |
Total Learnables Parameters |
|
conv1 |
7x7 |
112×112×64 |
Weights, Bias, 7×7×3×64, 1×1×64 |
9472 |
|
conv2 |
1x1 |
56×56×64 |
Weights, Bias, 1×1×64×64, 1×1×64 |
4160 |
|
conv3 |
3x3 |
56×56×192 |
Weights, Bias, 3×3×64×192, 1×1×192 |
110784 |
|
module 1 |
3x3_reduce |
28×28×96 |
Weights, Bias, 1×1×192×96, 1×1×96 |
18528 |
|
1x1 |
28×28×64 |
Weights, Bias, 1×1×192×64, 1×1×64 |
12352 |
|
|
5x5_reduce |
28×28×16 |
Weights, Bias, 1×1×192×16, 1×1×16 |
3088 |
|
|
pool_proj |
28×28×32 |
Weights, Bias, 1×1×192×32, 1×1×32 |
6176 |
|
|
5x5 |
28×28×32 |
Weights, Bias, 5×5×16×32, 1×1×32 |
12832 |
|
|
3x3 |
28×28×128 |
Weights, Bias, 3×3×96×128, 1×1×128 |
110720 |
|
|
module 2 |
3x3_reduce |
28×28×128 |
Weights, Bias, 1×1×256×128, 1×1×128 |
32896 |
|
pool_proj |
28×28×64 |
Weights, Bias, 1×1×256×64, 1×1×64 |
16448 |
|
|
3x3 |
28×28×192 |
Weights, Bias, 3×3×128×192, 1×1×192 |
221376 |
|
|
1x1 |
28×28×128 |
Weights, Bias, 1×1×256×128, 1×1×128 |
32896 |
|
|
5x5_reduce |
28×28×32 |
Weights, Bias, 1×1×256×32, 1×1×32 |
8224 |
|
|
5x5 |
28×28×96 |
Weights, Bias, 5×5×32×96, 1×1×96 |
76896 |
|
|
module 3 |
5x5_reduce |
14×14×16 |
Weights, Bias, 1×1×480×16, 1×1×16 |
7696 |
|
1x1 |
14×14×192 |
Weights, Bias, 1×1×480×192, 1×1×192 |
92352 |
|
|
5x5 |
14×14×48 |
Weights, Bias, 5×5×16×48, 1×1×48 |
19248 |
|
|
3x3_reduce |
14×14×96 |
Weights, Bias, 1×1×480×96, 1×1×96 |
46176 |
|
|
3x3 |
14×14×208 |
Weights, Bias, 3×3×96×208, 1×1×208 |
179920 |
|
|
pool_proj |
14×14×64 |
Weights, Bias, 1×1×480×64, 1×1×64 |
30784 |
|
|
module 4 |
5x5_reduce |
14×14×24 |
Weights, Bias, 1×1×512×24, 1×1×24 |
12312 |
|
5x5 |
14×14×64 |
Weights, Bias, 5×5×24×64, 1×1×64 |
38464 |
|
|
3x3_reduce |
14×14×112 |
Weights, Bias, 1×1×512×112, 1×1×112 |
57456 |
|
|
3x3 |
14×14×224 |
Weights, Bias, 3×3×112×224, 1×1×224 |
226016 |
|
|
pool_proj |
14×14×64 |
Weights, Bias, 1×1×512×64, 1×1×64 |
32832 |
|
|
1x1 |
14×14×160 |
Weights, Bias, 1×1×512×160, 1×1×160 |
82080 |
|
|
module 5 |
3x3_reduce |
14×14×128 |
Weights, Bias, 1×1×512×128, 1×1×128 |
65664 |
|
1x1 |
14×14×128 |
Weights, Bias, 1×1×512×128, 1×1×128 |
65664 |
|
|
5x5_reduce |
14×14×24 |
Weights, Bias, 1×1×512×24, 1×1×24 |
12312 |
|
|
pool_proj |
14×14×64 |
Weights, Bias, 1×1×512×64, 1×1×64 |
32832 |
|
|
5x5 |
14×14×64 |
Weights, Bias, 5×5×24×64, 1×1×64 |
38464 |
|
|
3x3 |
14×14×256 |
Weights, Bias, 3×3×128×256, 1×1×256 |
295168 |
|
|
module 6 |
3x3_reduce |
14×14×144 |
Weights, Bias, 1×1×512×144, 1×1×144 |
73872 |
|
5x5_reduce |
14×14×32 |
Weights, Bias, 1×1×512×32, 1×1×32 |
16416 |
|
|
1x1 |
14×14×112 |
Weights, Bias, 1×1×512×112, 1×1×112 |
57456 |
|
|
3x3 |
14×14×288 |
Weights, Bias, 3×3×144×288, 1×1×288 |
373536 |
|
|
5x5 |
14×14×64 |
Weights, Bias, 5×5×32×64, 1×1×64 |
51264 |
|
|
pool_proj |
14×14×64 |
Weights, Bias, 1×1×512×64, 1×1×64 |
32832 |
|
|
Dropout |
1×1×528 |
- |
0 |
|
|
|
Fully Connected |
1×1×2 |
Weights, Bias, 2×528, 2×1 |
1058 |
|
Total parameters |
2618722 |
|||
Table 2. Parameter comparison with proposed net and pre-trained model
|
Model |
Learnable Parameters |
|
Alexnet |
62.3 million |
|
VGG16 |
138 million |
|
VGG19 |
143 million |
|
GoogleNet |
4 million |
|
Resnet50 |
25 million |
|
Proposed Net |
2.6 million |
The proposed net uses different layers; the explanation regarding each layer is discussed in the following.
3.1 Input layer
It holds the raw pixels of the image; the network accepts the WidthxHeightxDepth (WxHxD) image. This is the first layer of the network.
3.2 Convolutional layer
The stacks of kernels are convolved on top of the image, which gives a convolved stack of images. This layer accepts the input from the input layer as WinxHinxDin and need hyperparameters like filter size f, Stride s, padding p, number of kernels k, and produce output size as WoutxHoutxDout.
Here Wout, Hout, and Doutcalculated from Eq. (1).
$\left.\begin{array}{c}\text { Wout }=(\text { Win }-\mathrm{f}+2 \mathrm{p}) /(\mathrm{s}+1) \\ \text { Hout }=(\text { Hin }-\mathrm{f}+2 \mathrm{p}) /(\mathrm{s}+1) \\ \text { Dout }=\mathrm{k}\end{array}\right\}$ (1)
3.3 Activation function
This is one type of activation function. In neural networks, the most popular activation function is ReLU. Mathematically it is defined from Eq. (2). For all negative input values, it is zero.
$b=\max (0, a)$ (2)
$f(a)= \begin{cases}0, & a<0 \\ a, & a \geq 0\end{cases}$ (3)
Here f(a) is zero when a is less than zero, and f(a) is equal to a when a is greater than or equal to zero.
3.4 Max-pooling layer
Pooling layers have three types, max pooling, min pooling, and average pooling. In our proposed net, max pooling is used because it gives a high value from the specified block, has significant features. This layer accepts the input from the input layer as WprevxHprevxDprev and need hyperparameters like filter size f, Stride s, and produce output size as WnxtxHnxtxDnxt.
Here Wnxt, Hnxt, and Dnxt. Calculated from Eq. (3).
$\left.\begin{array}{c}\text { Wnxt }=(\text { Wprev }-\mathrm{f}) /(\mathrm{s}+1) \\ \text { Hnxt }=(\text { Hprev }-\mathrm{f}) /(\mathrm{s}+1) \\ \text { Dnxt = Dprev }\end{array}\right\}$ (4)
3.5 Normalization layer
After fetching the features, the range of all features is not in the same range; this causes the learning delay. To speed up the learning process, we have to normalize all the features from 0 to 1. This normalization done batch-wise is called Batch Normalization.
$y=\frac{x_i-\mu_b}{\sqrt{\sigma_b^2+\epsilon}}$ (5)
where,
$\sigma_b=\frac{1}{m} \sum_{i=1}^m\left(x_i-\mu_b\right)^2$ (6)
$\mu_b=\frac{1}{m} x_i$ (7)
m=Number of inputs; xi= 1 to m.
σb=standard deviation; μb=Mean of input data; y=normalized values.
3.6 Softmax layer
This is also an activation function like ReLU, etc. This layer gives the probabilities of the input classes for the output within the range of 0 to 1. The probabilities are calculated using Eq. (7).
$f(x)=\frac{\exp \left(x_i\right)}{\sum_{j=0}^u \exp \left(x_j\right)}$ (8)
where i=0, 1, …, u.
3.7 Dropout
This is used for regularization purposes. During the training phase, randomly, some specified percentage of neurons are deactivated to prevent overfitting. The name itself indicated the dropout of the neurons. In the proposed network, 50% of the neurons were dropped.
3.8 Fully connected layer
Data taken from the previous layer is converted into a 1-D vector and predict the correct labels. And calculate the probabilities of each label. The usage of the fully connected layer in each model may be different. The equation is for this layer is shown in Eq. (8). The parameter for the fully connected layer is 2 in our proposed model because the classes are 2.
$s_i=\sum_j w_{i j} y_j$ (9)
where i,j represents neuron number, w_ij weight in the hidden layer, y_j value of hidden neuron, s_i the output value for this layer.
3.9 Output layer
This layer gives the final classification output from the probabilities of the softmax layer. The output is equal to the number of classes. In this proposed net, the model concludes COVID19+ and COVID19- the patient.
Dataset 1
A research team from various countries created this X-ray image dataset in collaboration with doctors in the medical field [30]. The dataset includes 219 X-ray images and 1,341 pictures of normal people. The X-ray images infected are grouped into COVID-19+ and normal COVID-19- pictures are collected. In the Kaggle repository, the X-ray images are collected. The details of the dataset are shown in Table 3, and some of the images are shown in Figure 7.
Figure 7. Sample images of an infected and normal from Dataset 1
Figure 8. Sample images of an infected and normal from Dataset 2
Figure 9. Sample images of an infected and normal from Dataset 3
Dataset 2
COVID-19 CT scan images [31] are very useful during the pandemic. This dataset was available publicly with a total number of 746 images of JPG format. Out of total images 349 positive cases and 397 negative cases. All images were captured from same equipment. The details of the dataset are shown in Table 3, and some of the images are shown in Figure 8.
Dataset 3
COVIDGR dataset [32] contains total of 852 images. They are categorized into COVID-19+ and COVID-19- cases, 426 positive cases and 426 negative cases. These images were captured using RT-PCR within a time span of at most 24 hours between the x-ray scanned image and the test. The details of the dataset are shown in Table 3, and some of the images are shown in Figure 9.
Performance metrics
A confusion matrix is a flexible and possible visual depiction of the performance of architecture in a binary or multi-class class. Basic terminology for model performance measurement [33].
True Positive (TP): A person's chest image is predicted as positive, and its ground truth is also positive.
True Negative (TN): A person's chest image is predicted as Negative, and its ground truth is also Negative.
False Positive (FP): A chest image of a person is predicted as Negative, but actually, it is positive.
False Negative (FN): A person's chest image is predicted as positive, but it is negative.
The performance of the proposed model is measured by using the Eqns. (10)-(14).
Accuracy$=\frac{T P+T N}{T P+F P+T N+F N}$ (10)
Sensitivity or recall $=\frac{T P}{T P+F N}$ (11)
Specificity $=\frac{F P}{F P+T N}$ (12)
Precision $=\frac{T P}{F P+T P}$ (13)
$\mathrm{F}-$score $=\frac{2 * \text { precision } * \text { recall }}{\text { precision }+\text { recall }}$ (14)
Table 3. Details about datasets
|
|
|
# of Images |
Total Images |
Image Format |
|
X-ray Images |
COVID-19+ |
219 |
1560 |
PNG |
|
COVID-19- |
1341 |
|||
|
COVID-19 CT Scan Images |
COVID-19+ |
349 |
746 |
JPG |
|
COVID-19- |
397 |
|||
|
COVID-19 GR X-ray Images |
COVID-19+ |
426 |
852 |
JPG |
|
COVID-19- |
426 |
Table 4. Analysis of different existing classification models with proposed CNN model on various datasets
|
Model |
Accuracy |
Sensitivity |
Specificity |
Precision |
F-Score |
|
Alexnet |
81.20 |
81.20 |
81.20 |
67.64 |
87.20 |
|
VGG16 |
92.76 |
97.47 |
88.05 |
64.56 |
90.76 |
|
VGG19 |
92.91 |
95.11 |
90.70 |
92.78 |
92.91 |
|
GoogleNet |
95.00 |
95.83 |
95.83 |
73.00 |
96.69 |
|
Resnet50 |
95.54 |
87.26 |
87.26 |
86.92 |
82.43 |
|
Proposed Net with Dataset 1 |
98.98 |
99.01 |
97.74 |
59.47 |
97.98 |
|
Proposed Net with Dataset 2 |
99 |
95.55 |
84.27 |
71.05 |
98.2 |
|
Proposed Net with Dataset 3 |
96.43 |
95.04 |
88 |
64.5 |
95.15 |
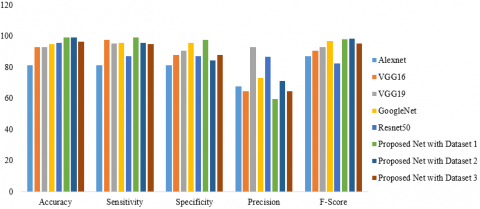
Figure 10. Graphical analysis of existing and proposed model performances
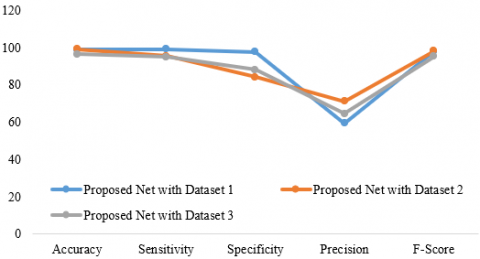
Figure 11. Graphical plot for proposed model performance measures on various datasets
In this paper, the performance was measured in terms of accuracy, sensitivity, specificity, recall, and F- score. The experimental results were observed by using a deep learning toolbox of MATLAB 2019a licensed version. The training and testing ratios are selected randomly by using 10-fold cross-validation. The average values are considered as the final result. Table 4 shows that the accuracy of the proposed net is higher than the other models, which is shown in Figure 10 and Figure 11. The proposed net with dataset 1 results is accuracy, sensitivity, specificity, precision, and F-score is 98.98%, 99.01%, 97.74%, 59.47%, and 97.98%, respectively. The proposed net with dataset 2 results is accuracy, sensitivity, specificity, precision, and F-score is 99%, 95.55%, 84.27%, 71.05%, 98.2%. The proposed net with dataset 3 results is accuracy, sensitivity, specificity, precision, and F-score is 96.43%, 95.04%, 88%, 64.5%, 95.15%.
This paper gives an overview of the COVID19 and also proposes a diagnosis system based on neural networks. It gives an overview of the origin of the disease and the early viruses, a comparison among them, and India's current scenario. To validate the test results of COVID+, there is no accurate, fast, low-cost equipment in India. So, we proposed a CNN-based network that helps classify COVID19+ and COVID19- persons based on their chest X-ray images. The network consists of layers, along with input, convolutional, pooling, normalization, and six special modules used while designing the network. A module consists of different kernels, but before applying each convolution operation, 1x1 convolution happened, causes dimensionality reduction, and the number of parameters, as well as the number of operations, also reduced. The proposed net was compared with the available pre-trained networks. Our proposed method discovered that employing CT scan medical images produced more accurate results than X-ray images.
[1] Wang, C., Horby, P.W., Hayden, F.G., Gao, G.F. (2020). A novel coronavirus outbreak of global health concern. The Lancet, 395(10223): 470-473. https://doi.org/10.1016%2FS0140-6736(20)30185-9
[2] Hu, B., Ge, X., Wang, L.F., Shi, Z. (2015). Bat origin of human coronaviruses. Virology Journal, 12(1): 1-10. https://doi.org/10.1186/s12985-015-0422-1
[3] Cucinotta, D., Vanelli, M. (2020). WHO declares COVID-19 a pandemic. Acta Bio Medica: Atenei Parmensis, 91(1): 157-160. https://doi.org/10.23750%2Fabm.v91i1.9397
[4] https://www.who.int/emergencies/diseases/novel-coronavirus-2019, accessed on 20 March 2022.
[5] https://www.cebm.net/covid-19/what-tests-could-potentially-be-used-for-the-screening-diagnosis-and-monitoring-of-covid-19-and-what-are-their-advantages-and-disadvantages/, accessed on 12 May 2020.
[6] https://www.worldometers.info/coronavirus/country/india/, accessed on 12 May 2020.
[7] https://www.mygov.in/corona-data/covid19-statewise-status, accessed on 12 May 2020.
[8] Zhang, W., Du, R.H., Li, B., et al. (2020). Molecular and serological investigation of 2019-nCoV infected patients: implication of multiple shedding routes. Emerging Microbes & Infections, 9(1): 386-389. https://doi.org/10.1080/22221751.2020.1729071
[9] Lu, Q., Shi, Y. (2020). Coronavirus disease (COVID-19) and neonate: What neonatologist need to know. Journal of Medical Virology, 92(6): 564-567. https://doi.org/10.1002/jmv.25740
[10] Krishna, S.T., Kalluri, H.K. (2019). Deep learning and transfer learning approaches for image classification. International Journal of Recent Technology and Engineering (IJRTE), 7(5S4): 427-432.
[11] Sajja, T., Devarapalli, R., Kalluri, H. (2019). Lung cancer detection based on CT scan images by using deep transfer learning. Traitement du Signal, 36(4): 339-344. https://doi.org/10.18280/ts.360406
[12] Hussain, M., Bird, J.J., Faria, D.R. (2018). A study on CNN transfer learning for image classification. In UK Workshop on computational Intelligence, Nottingham, UK, pp. 191-202. https://doi.org/10.1007/978-3-319-97982-3_16
[13] Sethy, P.K., Behera, S.K. (2020). Detection of coronavirus disease (COVID-19) based on deep feature. (Preprint). https://doi.org/10.20944/preprints202003.0300.v1
[14] Sajja, T.K., Kalluri, H.K. (2019). Gender classification based on face images of local binary pattern using support vector machine and back propagation neural networks. Adv Model Anal B, 62: 31-35. https://doi.org/10.18280/ama_b.620105
[15] Pandit, M.K., Banday, S.A., Naaz, R., Chishti, M.A. (2021). Automatic detection of COVID-19 from chest radiographs using deep learning. Radiography, 27(2): 483-489. https://doi.org/10.1016/j.radi.2020.10.018
[16] Al-Waisy, A.S., Mohammed, M.A., Al-Fahdawi, S., et al. (2021). COVID-DeepNet: Hybrid multimodal deep learning system for improving COVID-19 pneumonia detection in chest X-ray images. Computers, Materials and Continua, 67(2): 2409-2429. https://doi.org/10.32604/cmc.2021.012955
[17] Peeri, N.C., Shrestha, N., Rahman, M.S., et al. (2020). The SARS, MERS and novel coronavirus (COVID-19) epidemics, the newest and biggest global health threats: What lessons have we learned? International Journal of Epidemiology, 49(3): 717-726. https://doi.org/10.1093/ije/dyaa033
[18] https://intermountainhealthcare.org/blogs/topics/live-well/2020/04/whats-the-difference-between-a-pandemic-an-epidemic-endemic-and-an-outbreak/, accessed on 12 May 2020.
[19] Singhal, T. (2020). A review of coronavirus disease-2019 (COVID-19). The Indian Journal of Pediatrics, 87(4): 281-286. https://doi.org/10.1007/s12098-020-03263-6
[20] Kurian, N.K. (2020). Novel coronavirus (COVID-19) in India. (Preprints). https://doi.org/10.20944/preprints202003.0436.v1
[21] Jha, V., Dinesh, T.A., Nair, P. (2020). Are we ready for controlling community transmission of COVID 19 in India? Epidemiology International, 5(1): 10-13.
[22] Liu, J., Cao, R., Xu, M., et al. (2020). Hydroxychloroquine, a less toxic derivative of chloroquine, is effective in inhibiting SARS-CoV-2 infection in vitro. Cell Discovery, 6(1): 16. https://doi.org/10.1038/s41421-020-0156-0
[23] Choo, E.K., Rajkumar, S.V. (2020). Medication shortages during the COVID-19 crisis: What we must do. Mayo Clinic Proceedings, 95(6): 1112-1115. https://doi.org/10.1016/j.mayocp.2020.04.001
[24] https://www.mohfw.gov.in/, accessed on 25 June 2022.
[25] Krizhevsky, A., Sutskever, I., Hinton, G.E. (2017). Imagenet classification with deep convolutional neural networks. Communications of the ACM, 60(6): 84-90. https://doi.org/10.1145/3065386
[26] Szegedy, C., Liu, W., Jia, Y., et al. (2015). Going deeper with convolutions. In 2015 IEEE Conference on Computer Vision and Pattern Recognition (CVPR), Boston, MA, pp. 1-9. https://doi.org/10.1109/CVPR.2015.7298594
[27] Rezende, E., Ruppert, G., Carvalho, T., Theophilo, A., Ramos, F., Geus, P.D. (2018). Malicious software classification using VGG16 deep neural network’s bottleneck features. In Information Technology-New Generations, pp. 51-59. https://doi.org/10.1007/978-3-319-77028-4_9
[28] Mohanraj, V., Sibi Chakkaravarthy, S., Vaidehi, V. (2019). Ensemble of convolutional neural networks for face recognition. In Recent Developments in Machine Learning and Data Analytics, pp. 467-477. https://doi.org/10.1007/978-981-13-1280-9_43
[29] Peng, J., Kang, S., Ning, Z., et al. (2020). Residual convolutional neural network for predicting response of transarterial chemoembolization in hepatocellular carcinoma from CT imaging. European Radiology, 30(1): 413-424. https://doi.org/10.1007/s00330-019-06318-1
[30] Muhammad, C. COVID-19 Radiology Database. Can AI help in screening Viral and COVID-19 pneumonia? 2020. https://www.kaggle.com/datasets/tawsifurrahman/covid19-radiography-database.
[31] Yang, X., He, X., Zhao, J., Zhang, Y., Zhang, S., Xie, P. (2020). COVID-CT-dataset: A CT scan dataset about COVID-19. arXiv preprint arXiv:2003.13865.
[32] Tabik, S., Gómez-Ríos, A., Martín-Rodríguez, J.L., et al. (2020). COVIDGR dataset and COVID-SDNet methodology for predicting COVID-19 based on chest X-ray images. IEEE Journal of Biomedical and Health Informatics, 24(12): 3595-3605. https://doi.org/10.1109/JBHI.2020.3037127
[33] Hossin, M., Sulaiman, M.N. (2015). A review on evaluation metrics for data classification evaluations. International Journal of Data Mining & Knowledge Management Process, 5(2): 1. https://doi.org/10.5121/ijdkp.2015.5201