Thiyagarajan Annamalai* | Murukesh Chinnasamy | Mary Joans Samuel Soundara Pandian
© 2022 IIETA. This article is published by IIETA and is licensed under the CC BY 4.0 license (http://creativecommons.org/licenses/by/4.0/).
OPEN ACCESS
Identifying affected cancer cells in women’s breasts is mammogram, which is the major issue in the field of medicine all over the world. In order to raise the endurance of patients, it is most essential to identify the issue as early as possible. It also helps them to inflate the different options for treatment. With the new dramatic development in computation, machine learning made a revolution with dataset includes huge volume of breast images which could assist in recognizing malignant tumor with better diagnostics. Digital mammography images are taken, in that the x-ray images are read and stored in computer such that data can be easily enhanced and classified for further action. A novel approach is proposed in this paper to diagnose cancer affected cells with a good accuracy rate. Classification of mammogram with hybrid model includes feature extraction, various kinds of features are extorted from the intensity mammogram. A Particle Swarm Optimization optimizer is used in this paper which selects the features, and kernel-based Support Vector Machine classifier classifies the cancer lump from the taken mammogram metaphors. The exactness of a specific model can be assessed by the level of right forecasts made by the model.
feature extraction, image classification, mammogram, particle swarm optimization, segmentation, support vector machine
In women, the majority of recurrent sort of disease is breast cancer. Also, it leads to a high risk of deaths in middle-aged and elderly women, particularly in countries of western world [1]. In Middle East countries, at least one out of every eight women is expected to develop this type of cancer at some point in their lives [2-4]. In the year 2012, around 14.1 million breast cancer patients were diagnosed in and around the world. With 8.2 million women dying as a result of the disease [2-4]. Early breast cancer detection and characterization has the potential to significantly improve treatment options and patient survival rate.
In women, Adenocarcinoma (another name for breast cancer) is the second highest origin of bereavement. This is second chance of high-risk disease compared with skin and lung carcinoma in terms of fatalities. Nowadays, though we have lots of awareness, still we lag behind in identifying symptoms and causes of carcinoma. Of course, preventive measures and remedies are very less [4]. As a result, early detection is the most effective mode to develop the prediction of breast cancer. Mammograms are taken at as early as possible to detect the presence of tumor even in early stage. Using mammography technique enables us to detect invasive, non-invasive and non-palpable tumors. Almost all medical/diagnostic centers, however, are currently struggling to analyze the increasing volume of mammograms. Computer Aided Diagnosis (CAD) is more popular in diagnosing suspicious tumors in women’s breasts with good results in terms of improved precision and accuracy [5-9].
In general, CAD systems aim to increase the likelihood of detecting and evaluating proper lesions [2-4]. The most important work in the image processing is to identify a group of significant attributes of images which are capable of distinguishing between normal and abnormal mammograms. Medical images are complicated while processing because of their low quality in contrast and noise with high threat of noise [10]. Breast cancer can be detected using a variety of methods such as Magnetic Resonance Imaging (MRI), biopsy, and X-ray mammograms. For detecting Adenocarcinoma in its nascent stage as accurate as possible is only by obtaining X-ray mammography images. Radiologists, on the other hand, find it extremely difficult to specifically evaluate the large quantity of mammograms produced in prevalent selection during a screening mammographic examination.
By this screening procedure, there is high chance of classifying normal cells as cancerous; also, abnormal cells as non-cancerous. Therefore, it directly affects the classification accuracy. From research it is identified that 12% to 35% of patients with cancerous cells are missed because of this misclassification during the screening procedure by the radiologists [11]. In this situation, in order to perform and obtain accurate classification and screening procedure, radiologists need an aided system such as CAD [12]. This model is capable of detecting suspicious areas and determining whether the cells are normal or affected cells. It also finds out the clause of the cell by discriminating between cases. The CAD system can able to improve tumor abnormality prediction accuracy such as micro calcification, misrepresentation and masses. Sensitivity accuracy is increased by 12% to the radiologist by using the CAD system [2-4].
Statistics point out a spurt in the occurrence of breast cancers in urban nations as much as in evolving ones. In the 1960s and 70s, all the incidents with their rates along with the age attributes were registered by using the 10-fold extend method in most information on cancers in various international locations [13] as stated by World Health Organization (WHO). Within the ultimate decapods, several lookup tasks were accepted for increasing computational structures to assist experts even in the challenge of interpreting images from radiography.
In recent days, in the field of medicine, both Computer Aided Detection (CAD) and prognosis (CADx) has advanced structure for imparting professionals with intelligent classification of severe sickness such as breast cancers [14, 15]. The effectiveness of both CAD/CADx structures relies upon the methods utilized for both segmentation and extraction of points.
Outline of mammograms are defined and viewed by ROI, which is more desirable sharp aspect. Some morphological approaches like statistical approaches are used to do the segmentation in ROI. Three most important tasks are followed in this work. The beginning step is to pull out the unwanted identification and image labels, then depth primarily related image segmentation is taken part in this for putting off all the affected cells. Once this segmentation is done, those identified affected cells are marked and features are extracted by this fantastic technique to apprehend a model. This photo radically changes approach in which function extraction of precise photo with unique form inside a photograph is able to be achieved [16]. This additionally converts authentic photographs into two-dimensional tasks. In classification, feature extraction is a major role. The extracted features are then compared in both training and testing session. A lot of strategies like Convolutional neural networks, LDA-Linear discriminate analysis and classification techniques have been used. Finally, Support Vector Machine is used to classify the features [7-9, 16].
In this paper, we propose a hybrid PSO-SVM classification method. A novel feature selection method is proposed to increase the efficacy of the classification; also, dimension of features are reduced. For the classification of tissues those two features are used. Our experiments prove to facilitate this method yields improved results in terms of accuracy in a more efficient manner.
There are several current methods that are developed in the growth of technology for the prediction of breast cancer. A new modern approach wavelet-based contour let is proposed for the breast cancer detection. In this, three different methodologies are used for classification such as Radial Groundwork Feature (RGF), Probabilistic Neural Network (PNN) and Multi-Layer Perceptron (MLP). The overall quality of the algorithm is defined by calculating Accuracy, Sensitivity and Specificity. By using MLP 98.42% and 98.01% was achieved in both testing and training.
Lee et al. [10] established a machine learning algorithm to identify the cancer tumor using Rotation Forest (RF) and Genetic Algorithm, which removes the needless features from the images and presents splendid statistics. For classification, various computer-based auto systems were utilized. The accuracy rate of 99.5% was achieved with the aid of this proposed technique. A Genetic Algorithm (GA) MOONN was proposed for cancer cells in breast of women [1]. Already discussed GA algorithm choosing ultimate features on a standard feature. For testing, training and validation, the dataset is partitioned as 50-25-25 percent respectively.
Dimension reduction was described through Burgess as the mapping of records to a decreased dimensional area by way of eliminating uninformative variance in facts, such that a subspace in which the information lives is then detected [17, 18]. Dimension discount can be divided into characteristic extraction and function decision [14, 15]. Feature extraction is the method of distinguishing and brushing off irrelevant, much less relevant or redundant attributes of dimensions in a given dataset. With function selection, it is viable to perceive and eliminate a whole lot of inappropriate and redundant statistics as feasible to construct sturdy mastering fashions. Thus, function decision now not solely reduces the computational and processing fees; however, additionally improves the mannequin developed from the chosen facts. A variety of current works have been carried out with the use of the function choice approach on healthcare information [19, 20]. The function decision techniques can be labelled into three kinds of algorithms: filters, wrappers, and embedded techniques.
We can, in addition, divide dimension discount into occasion choice or discount and function determination strategies. Instance discount is the system of decreasing the inappropriate situations from the dataset to make bigger the classification accuracy, whilst characteristic determination is the determination of a subset of the applicable points used in the mannequin building. These beside the point cases are now not really helpful for classification and might also minimize the classification performance. Feature determination helps in putting off irrelevant, redundant, and noisy facets that are no longer instrumental to the accuracy of the mannequin. Therefore, it turns into less complicated to decide solely the beneficial and applicable elements for classification as a substitute than the usage of all of them [19, 20]. This results in fewer quantity of features, which is desirable, as it simplifies the mannequin and makes it simpler to understand. Implementing characteristic resolution in healthcare information will limit the wide variety of checks required to pick out a disease, saving time and money for the affected person to process the tests. In general, we can generally divide regular function choice algorithms into three classes which are filter approaches, wrapper approaches, and embedded techniques.
Feature choice performs a very substantial position for the success of the gadget in fields like sample focus and statistics mining. Feature determination affords a smaller, however, extra distinguishing subset compared with the beginning data, choosing the distinguishing points from a set of elements and removing the inappropriate ones. These effects in each decreased processing time and multiplied classification accuracy. For function selection, there are many strategies in the literature masking a large vary from filtering to wrapping processes [11, 21]. In the filter approach, the goodness of an attribute or set of attributes is estimated with the aid of the usage of solely intrinsic homes of the data, whilst in the wrapper approach, the advantage of a given candidate subset is got by means of gaining knowledge of and evaluating a classifier the use of solely the variables covered in the proposed subset [22]. Principle Component Analysis (PCA) and linear discriminate evaluation (LDA) are the famous function decision techniques to minimize dimension [17, 18]. In the current years, many techniques have been used for function selection, especially synthetic intelligence, function conversion techniques and statistical methods. Boosting characteristic resolution for neural community based totally regression [16], filter mannequin for function subset choosing primarily based on genetic algorithm [23], software of ant colony algorithm for function decision [24], function choice the use of particle swarm optimization [1], a discrete particle swarm optimization approach for function choice [25, 26], function decision by way of Weighted-SNR for most cancers microarray records classification [27-29], Bhattacharyya area for characteristic choice, subspace primarily based characteristic decision approach [14, 15], aid vector-based characteristic resolution the usage of Fisher’s linear discriminate and aid vector desktop, HMM (Hidden Markov Models) based totally function house radically changed for voice pathology detection have been used [1].
Since the mammogram is wide and complex problem to analyse as well as to obtain accurate result of disease identification. Different literature survey were taken in this work to get a clear idea about the algorithm which is proposed. Here before classifying the affected cells, an optimization is performed which included all the pre-processing, filtering, segmentation etc. From these, it is possible to achieve good accuracy rate compared with some other existing methodology.
Particle swarm optimization algorithms [16-18] are population-based approaches similar to genetic algorithms [22] and other evolutionary algorithms. The PSO algorithm is used in heuristic searches to randomly and uniformly initialize candidate solutions in the parameter space of the problem to be solved. PSO particles (candidate solutions) move and work together during the search process to find the best solution for your parameter selection task.
SVM pattern recognition is based on finding the optimal hyperplane that maximizes the geometric margin between patterns of different classes [23, 24]. In a binary classification problem, input pattern m, A€ n represents two classes, each with a unique class label as m € {-1, 1}. In general, linear separation of input patterns in the original feature space is not always possible, and there may be some learning errors. The first problem was solved by using an SVM kernel classifier that non-linearly maps the original feature space to a high-dimensional space. This step allows you to linearly separate the template from the different classes. Several kernel functions such as Gaussian kernel and polynomial kernel are commonly mentioned in the literature.
Tang et al. [24] introduced a soft-margin SVM classifier and a loose concept of variables, and a positive regularization (or penalty) constant C for training errors. A soft-margin SVM learning problem is defined as a double-convex optimization problem with inequalities and linear constraints.
The standard solution for convex SVM optimization does not necessarily guarantee a high level of generalization. As a result, you need to run a learning model or parameter selection process. The model selection stage aims to improve the generalization capabilities of the SVM classifier by determining the optimal values for the kernel control parameters and the regularization parameter E.
In the second step, 14 GLCM texture feature sets are extracted from input mammogram. As in the article of Liu and Tang [13], it first computes 14 texture descriptors for each GLCM matrix. The descriptors are energy, correlation, homogeneity, contrast, entropy, sum of squares (variance), sum mean, sum entropy, mean difference, variance of difference, entropy of difference, two measures of correlation and normalized inverse difference. A summary function is formed by combining the two primary statistics (mean and range) of each descriptor, resulting in 14 GLCM functions.
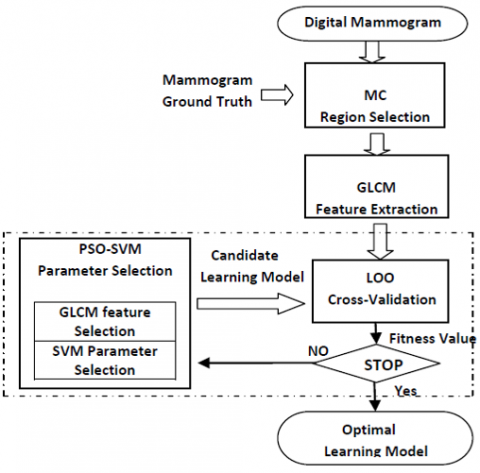
The third step uses the heuristic search-based PSOSVM framework to find the best training model that gives the system the best generalization performance. Built-in features that use the PSOSVM heuristic approach in SVM training include feature selection tasks. This heuristic method uses binary feature search to find the best texture feature and improves the generalization ability of the nonlinear SVM classifier by adjusting the regularization constants and kernel control parameters.
As a result, the PSOSVM framework uses a hybrid PSO with particles with 30 dimensions or coordinates, i.e., two coordinates correspond to the SVM model with parameters and E, and 14 coordinates are for feature selection.
Figure 1. Classification of mammogram using PSO-KSVM
The proposed SVM based PSO optimizer in Figure 1 for mammogram classification follows the following five main steps: 1. Pre-processing; 2. Feature enhancement and segmentation; 3. Extraction of features; 4. Selecting features; 5. Image Classification.
3.1 Preprocessing
The pre-processing stage removes noise and artifacts while suppressing the pectoral muscle. To begin, every mammogram image is rotated to the left. To do these vales of intensity from first half of the columns that is from left to right be compared with second half of the columns of intensity values. Sum values of both first and second columns are calculated for first half and second half, now the values of sum from first half are greater than the second half, and then the image is slopped to the left of the existed image. If this is not the case, then the orientation of the images is changed to left from right by mirroring the image. A 2-D median filter is used to remove the noise sources, from the output image whose pixel having the value of median is 5-5 neighbourhood in the region and interest of each pixel, so that the image boundaries at edges are reinstated as 0. Comparatively median filter performance is higher than the other filters like linear in reducing noise sources in mammographic images while preserving texture. Mammogram artifacts like brand name, label and markers are concealed based on morphology, where from these images the breast profiles are estranged by the available component, those are connected and labelled properly. Finally, the biggest object from these is extracted.
Figure 2(a) – 2(c) is an input mammographic image which is already filtered images of mass types that are restricted, conjecture or distracted. The real input mammogram images were obtained from the universal available Image Analysis Society's database (MIAS). After the noise and artifact sources had been removed, the pectoral part of muscles from the image was removed by the seed growing technique such as contour growing, histogram thresholding and edge detection [7-9]. The defined method is perfect and completely computerized. To check mammography images of different densities are examined using this model. In left side images the pectoral can be present at the upper left, also for right oriented images it is in the upper half of the images, because of this position all the images are rotated to the left side prior to the application of seed growing procedure. A threshold (th) value is calculated and set, the window from the image is set into the left corner of the upper side also slid in the right side in anticipation of pixels sum exceeds the threshold value. At last, execution of the algorithm stops while the window reaches bottom of the image. After that, in order to form a straight line, the area between the Pecs is smoothed. Figure 2(d), 2(e), and 2(f) illustrate images obtained after the pectoral muscles were removed in the three cases studied.
Figure 2. MIAS mammography image behind noise and label removal
3.2 Segmentation
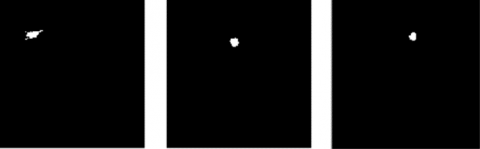
There are two types of noise in a standard mammogram: a black background and medical labels. A cropping operation is used to reduce this type of noise. To enhance segmentation process automatically, the Region of Interest (ROI) is calculated by removing unwanted noise from the interest point which is set initially. The watershed algorithm is used in segmentation, the ROI boundary is then extracted from mammogram images in a reproducible and accurate manner. To identify suspicious part there is no need to use entire raw data. Instead we compared them to their surrounding tissue to extract more features rather than shape features. The segmentation results for three active cases are depicted in Figure 3. The centre of the tumor is extracted from the segmentation process' output binary format for each case and used to generate a ROI area of 128X128 pixels. Figure 3 and 4 show the ROI segmentation and extraction results respectively.
Figure 3. Region of interest segmentation
Figure 4. ROI extraction
3.3 Feature extraction
Features are extracted even if the images are sub-divided, based on the ROI (Region of Interest), the overall cost of the algorithm implemented in this paper would increase. As a result, feature extraction was performed on the entire Region without partitioning it to sub images. Wavelet-Based Contourlet Transform algorithm is used to extract the features in Region of Interest.
However, because some benign tumors can mimic malignant tumors and also the malignant as benign along this feature on texture based is also extracted. Gray Level Co-occurrence Matrices (GLCM) was used to calculate the likelihood of two adjacent grey level pixels occurring in the same direction for a given vector. To evaluate the classifier performance, an optimizer is needed; in this work, Particle Swarm Optimization optimizer is used [22]. The optimization technique used here is to select features without becoming trapped in local optima.
3.4 Feature selection
Features of ROI are obtained from previous feature selection, which is reduced by eradicating data which are closely related to ROI. Those data should be removed without affecting the accuracy of classification. Feature selection is also known as feature decline, which is a method to choose specific attributes from a large set of extracted features based on the fact that only these features influence the classification process. The region's shape, texture and intensity features were extracted, yielding a total of 14 features. From among these 14 features, the PSO Algorithm is then used to select only the features that aid in classification.
Finally in Table 1, the features with fewer than the total number of features will be used to train the SVM classifier to detect the type of tumors. The selected 14 features were used at both training and testing dataset for the classification of mammogram.
Table 1. Feature extraction using PSO
|
Texture |
Statistical |
Shape |
PSO selected feature |
|
Contrast |
Mean |
Area |
0 |
|
Homogeneity |
Standard Deviation |
Perimeter |
0 |
|
Correlation |
Smoothness |
- |
0 |
|
Energy |
|
Major Axis |
1 |
|
Mean |
|
|
0 |
|
Standard Deviation |
|
|
0 |
|
Perimeter |
|
|
0 |
|
Entropy |
|
|
1 |
3.5 Classification
Sample mammograms are taken from the specified database for all classes like malignant, benign and normal. After obtaining features from mammogram images, the values are given to the classifier called Support vector machine. It is a classifier used here to attain better efficiency than other classifiers. It aims on reducing bounds on the generalization error (error made by the learning machine data unseen during training phase) rather than minimizing the mean square error over the dataset. As a result SVM led to perform well when data was applied outside the training set. It attains the accuracy of 94%, which is higher when compared with all other classifier. Values obtained from the mammogram images of both cancerous and non-cancerous is used to determine a maximum margin hyper plane between the two classes.
The chosen features are fed into a classifier model in Machine Learning (ML), which uses them toward distinguish among tumors of both benign and malignant. Figure 5 shows the detailed implementation of feature-based classification in Kernel based Support Vector Machine (K-SVM) is proposed in this paper. Also, the accuracy and performance of this classifier is evaluated with existed conventional linear SVM.
In this linear SVM, a hyperplane is used for data classification whereas the proposed kernel-based classifier uses a function named as kernel function, which is used to fix the margin at maxima for the hyperplane in already fitted space for feature selection. By using this optimizer, we can achieve an exclusive classification given by the universal minimum for the optimized function. Instead of providing related solutions with minimum in local value as in Neural Network (NN).
This proposed K-SVM approach is used when we have large dimensional linear dataset. We can achieve good accuracy rate if we choose correct kernel, then this model gives us good transformation result. The linear, polynomial and radial basis function or gaussian kernel are essentially made disparate in the event of hyperplane decision boundary between the classes. The kernel functions are utilized to make the original dataset (linear/non-linear) into a higher dimensional space with view to make it linear dataset. Usually linear and polynomial kernels are less time consume and provides less accuracy than the RBF or Gaussian kernels.
Figure 5. Feature based classification
To analyze the efficiency of mammogram for the proposed CAD system, from the Mammographic Image Analysis Society (MIAS) database mammograms are taken into account. This database includes 523 mammography images that have been classified as normal, benign or malignant masses. Each mammogram in this database is with 1024 pixels in size, with an 8-bit intensity for each pixel.
To begin, the projected CAD system categorizes each of the 523 mammogram images as normal or abnormal, which is shown in Figure 6. This database is further divided into 60% for training dataset and 40% into testing dataset.
Figure 6. Count of malignant and benign cases
The given dataset contains two types of tumor classes: benign and malignant. The classifier’s accuracy is compared with PSO’s, where its features are selected from the training section. Sensitivity (SN), Specificity (SP) and Accuracy (ACC) and time consumption by the algorithm is calculated to measure the proposed CAD system. Here SN, SP are true positive and false positive rate respectively. Also, ACC is the percentage of correct classification obtained from the testing set of the classifier. Those calculation criteria are as follows:
Sensitivity $(S N)=\frac{\text { True Positive }(T P)}{(\text { True Positivite }(T P)+\text { False Negative }(F N)}$ (1)
Specificity $(S P) =\frac{\text { True Negative }(T N)}{\text { True Negative }(T N)+\text { False Positive }(F P)}$ (2)
$\operatorname{Accuracy}(A C C)=\frac{((T P)+(T N))}{((T P)+(F P)+(T N)+(F N)}$ (3)
Table 2. Result comparision
|
Classifier |
FP |
FN |
SN |
SP |
ACC |
|
PSO-Kernel SVM |
0 |
2 |
97.2 |
98.9 |
99.1 |
|
PSO-SVM |
1 |
1 |
57.9 |
61.2 |
60.4 |
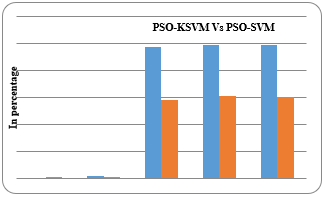
According to Table 2, the classification accuracy with the fusion model of kernel based PSO-SVM is 99.1%, where it is higher than the classification accuracy with the simple SVM classifier, which is 60.4%.
A performance Comparison is plotted in Figure 7 and we can see that we achieve an accuracy of 99.1% on the held-out test dataset. From this matrix, there is only one case of misclassification. The efficiency of this procedure is supposed to be high, given the side effects for breast cancer disease ought to show specific clear patterns.
Figure 7. Comparison of output
In this work, a kernel-based hybrid PSO-SVM classifier is used to classify breast tumors. In this work a well-organized repeated model is introduced for both image segmentation and feature extraction from the Region of Interest, that does not rely on MIAS database ground truth or crop the ROI. Rather than including all of the features, we use bio-inspired algorithms known as PSO to select only those that are absolutely necessary. A smaller number of features, but all of them important, results in better classification accuracy. Incorporating critical features only improves efficiency and reduces computation time. The PSO-Kernel SVM method, on the other hand, converges faster while maintaining an acceptable level of accuracy. To review the efficacy of the proposed K-SVM method, more sets of data from the MIAS database are used. In this PSO is used for optimizing and scaling the features from the dataset and for feature based classification, kernel SVM classifier is used efficiently. According to the results, PSO kernel SVM classifier is more accurate than the existing method for classifying both benign and malignant cases.
Also, by using Hough transform, normal and abnormal classes are effectively classified. Use of more intensity features like mean, variance and entropy can improve the results. By having SVM classifier, we obtained the accuracy range of 99.1% (shown in Table 2) which is higher when compared with other classifiers like LDA.
[1] Hariraj, V., Khairunizam, W., Vikneswaran, V., Ibrahim, Z., Shahriman, A.B., Zuradzman, M.R., Sathiyasheelan, R. (2018). Fuzzy multi-layer SVM classification of breast cancer mammogram images. International Journal of Mechanical Engineering and Technology, 9(8): 1281-1299.
[2] Salama, M.S., Eltrass, A.S., Elkamchouchi, H.M. (2018). An improved approach for computer-aided diagnosis of breast cancer in digital mammography. In 2018 IEEE International Symposium on Medical Measurements and Applications (MeMeA), pp. 1-5. https://doi.org/10.1109/MeMeA.2018.8438650
[3] Symmans, W.F., Yau, C., Chen, Y.Y., Balassanian, R., Klein, M.E., Pusztai, L., Esserman, L.J. (2021). Assessment of residual cancer burden and event-free survival in neoadjuvant treatment for high-risk breast cancer: an analysis of data from the I-SPY2 randomized clinical trial. JAMA Oncology, 7(11): 1654-1663. https://doi.org/10.1001/jamaoncol.2021.3690
[4] Tiwari, D., Dixit, M., Gupta, K. (2021). Deep multi-view breast cancer detection: A multi-view concatenated infrared thermal images based breast cancer detection system using deep transfer learning. Traitement du Signal, 38(6): 1699-1711. https://doi.org/10.18280/ts.380613
[5] Nithya, R., Santhi, B. (2011). Classification of normal and abnormal patterns in digital mammograms for diagnosis of breast cancer. International Journal of Computer Applications, 28(6): 21-25.
[6] Shrivastava, A., Chaudhary, A., Kulshreshtha, D., Singh, V.P., Srivastava, R. (2017). Automated digital mammogram segmentation using dispersed region growing and sliding window algorithm. In 2017 2nd International Conference on Image, Vision and Computing (ICIVC), pp. 366-370. https://doi.org/10.1109/ICIVC.2017.7984579
[7] Sampaio, W.B., Diniz, E.M., Silva, A.C., De Paiva, A.C., Gattass, M. (2011). Detection of masses in mammogram images using CNN, geostatistic functions and SVM. Computers in Biology and Medicine, 41(8): 653-664. https://doi.org/10.1016/j.compbiomed.2011.05.017
[8] Punitha, S., Amuthan, A., Joseph, K.S. (2018). Benign and malignant breast cancer segmentation using optimized region growing technique. Future Computing and Informatics Journal, 3(2): 348-358. https://doi.org/10.1016/j.fcij.2018.10.005
[9] Ponnaganti, N.D., Anitha, R. (2022). A novel ensemble bagging classification method for breast cancer classification using machine learning techniques. Traitement du Signal, 39(1): 229-237. https://doi.org/10.18280/ts.390123
[10] Lee, C.H., Dershaw, D.D., Kopans, D., Evans, P., Monsees, B., Monticciolo, D., Burhenne, L.W. (2010). Breast cancer screening with imaging: Recommendations from the Society of Breast Imaging and the ACR on the use of mammography, breast MRI, breast ultrasound, and other technologies for the detection of clinically occult breast cancer. Journal of the American College of Radiology, 7(1): 18-27. https://doi.org/10.1016/j.jacr.2009.09.022
[11] Mundra, P.A., Rajapakse, J.C. (2009). SVM-RFE with MRMR filter for gene selection. IEEE Transactions on Nanobioscience, 9(1): 31-37. https://doi.org/10.1109/TNB.2009.2035284
[12] Görgel, P., Sertbas, A., Ucan, O.N. (2013). Mammographical mass detection and classification using local seed region growing–spherical wavelet transform (LSRG–SWT) hybrid scheme. Computers in Biology and Medicine, 43(6): 765-774. https://doi.org/10.1016/j.compbiomed.2013.03.008
[13] Liu, X., Tang, J. (2013). Mass classification in mammograms using selected geometry and texture features, and a new SVM-based feature selection method. IEEE Systems Journal, 8(3): 910-920. https://doi.org/10.1109/JSYST.2013.2286539
[14] Moayedi, F., Azimifar, Z., Boostani, R., Katebi, S. (2010). Contourlet-based mammography mass classification using the SVM family. Computers in Biology and Medicine, 40(4): 373-383. https://doi.org/10.1016/j.compbiomed.2009.12.006
[15] Rahmani, A., Katouli, M. (2020). Breast cancer detection improvement by grasshopper optimization algorithm and classification SVM. Rev. d'Intelligence Artif., 34(2): 195-202. https://doi.org/10.18280/ria.340210
[16] Vijayarajeswari, R., Parthasarathy, P., Vivekanandan, S., Basha, A.A. (2019). Classification of mammogram for early detection of breast cancer using SVM classifier and Hough transform. Measurement, 146: 800-805. https://doi.org/10.1016/j.measurement.2019.05.083
[17] Islam, M.J., Ahmadi, M., Sid-Ahmed, M.A. (2010). An efficient automatic mass classification method in digitized mammograms using artificial neural network. arXiv preprint arXiv:1007.5129.
[18] Chakravarthy, S.S., Rajaguru, H. (2022). Automatic detection and classification of mammograms using improved extreme learning machine with deep learning. IRBM, 43(1): 49-61. https://doi.org/10.1016/j.irbm.2020.12.004
[19] Alba, E., Garcia-Nieto, J., Jourdan, L., Talbi, E.G. (2007). Gene selection in cancer classification using PSO/SVM and GA/SVM hybrid algorithms. In 2007 IEEE Congress on Evolutionary Computation, pp. 284-290. https://doi.org/10.1109/CEC.2007.4424483
[20] Shuran, C., Yian, L. (2020). Breast cancer diagnosis and prediction model based on improved PSO-SVM based on gray relational analysis. In 2020 19th International Symposium on Distributed Computing and Applications for Business Engineering and Science (DCABES), pp. 231-234. https://doi.org/10.1109/DCABES50732.2020.00067
[21] Mandelblatt, J.S., Cronin, K.A., Bailey, S., Berry, D.A., De Koning, H.J., Draisma, G., Feuer, E.J. (2009). Effects of mammography screening under different screening schedules: model estimates of potential benefits and harms. Ann Intern Med, 151(10): 738-747. https://doi.org/10.7326/0003-4819-151-10-200911170-00010
[22] Reyad, Y.A., Berbar, M.A., Hussain, M. (2014). Comparison of statistical, LBP, and multi-resolution analysis features for breast mass classification. Journal of Medical Systems, 38(9): 1-15. https://doi.org/10.1007/s10916-014-0100-7
[23] Boughorbel, S., Al-Ali, R., Elkum, N. (2016). Model comparison for breast cancer prognosis based on clinical data. PloS One, 11(1): e0146413. http://doi.org/10.1371/journal.pone.0146413
[24] Tang, J., Rangayyan, R.M., Xu, J., El Naqa, I., Yang, Y. (2009). Computer-aided detection and diagnosis of breast cancer with mammography: recent advances. IEEE Transactions on Information Technology in Biomedicine, 13(2): 236-251. http://doi.org/10.1109/TITB.2008.2009441
[25] Tang, J., Liu, X. (2011). Classification of breast mass in mammography with an improved level set segmentation by combining morphological features and texture features. In Multi Modality State-of-the-Art Medical Image Segmentation and Registration Methodologies, 119-135. https://doi.org/10.1007/978-1-4419-8204-9_5
[26] Sridhar, B. (2021). Investigations of medical image segmentation methods with inclusion mathematical morphological operations. Traitement du Signal, 38(5): 1531-1540. https://doi.org/10.18280/ts.380530
[27] Gao, X., Wang, Y., Li, X., Tao, D. (2009). On combining morphological component analysis and concentric morphology model for mammographic mass detection. IEEE Transactions on Information Technology in Biomedicine, 14(2): 266-273. http://doi.org/10.1109/TITB.2009.2036167
[28] Jahwar, A., Ahmed, N. (2021). Swarm intelligence algorithms in gene selection profile based on classification of microarray data: A review. Journal of Applied Science and Technology Trends, 2(1): 1-9. https://doi.org/10.38094/jastt20161
[29] Hengpraprohm, S., Chongstitvatana, P. (2009). Feature selection by weighted-SNR for cancer microarray data classification. International Journal of Innovative Computing, Information and Control, 5(12): 4627-4636.