Filiz Sari* | Ali Burak Ulas
© 2022 IIETA. This article is published by IIETA and is licensed under the CC BY 4.0 license (http://creativecommons.org/licenses/by/4.0/).
OPEN ACCESS
Manually detecting defects on the surfaces of glass products is a slow and time-consuming process in the quality control process, so computer-aided systems, including image processing and machine learning techniques are used to overcome this problem. In this study, scratch and bubble defects of the jar, photographed in the studio with a white matte background and a -60° peak angle, are investigated with the Yolo-V3 deep learning technique. Obtained performance is 94.65% for the raw data. Color space conversion (CSC) techniques, HSV and CIE-Lab Luv, are applied to the resulting images. V channels select for preprocessing. While the HSV method decreases the performance, an increase has been observed in the CIE-Lab Luv method. With the CIE-Lab Luv method, to which is applied the adaptive histogram equalization, the maximum recall, precision, and F1-score reach above 97%. Also, Yolo-V3 compared with the Faster R-CNN, it is observed that Yolo-V3 gave better results in all analyzes, and the highest overall accuracy is achieved in both methods when adaptive histogram equalization is applied to CIE-Lab Luv.
adaptive histogram equalization, color space conversion, glass defect detection, deep learning
Glass products are preferred for packaging in the food industry because they do not give taste and color, are not easily deformed, and are resistant to internal pressure [1, 2]. The transparent structure of the glass makes quality processes important and difficult. Traditional human-based vision inspection methods are insufficient and time-consuming processes so machine vision techniques including image capturing, digital image processing techniques, and computer-based fault detection are used for quality improvement [2-7]. Common defects in glass are surface and edge defects, impurities in the glass, various cracks and chips, bubbles, concretion, holes, and dirt [3, 8-11].
Image processing techniques help to perceive the defects of the glass. In 2012, Nishu and Agrawal used RGB (red, green, blue) to color space conversion (CSC) [12], in 2013, Kumar and Kaur used gray color space and the adaptive histogram technique [13], Zhou et al. used grayscale distribution for glass bottle bottom in 2019 [14], binary feature histogram technique was utilized by Zhao et al. in 2011 [4], in 2012, Zhang et al. used discrete Fourier transform with optimal threshold segmentation [15], image filtering was applied by Peng et al. in 2008 [6] and in 2015, Akdemir and Öztürk utilized wavelet transform with Shannon threshold [16] techniques for detecting the defects.
In addition to digital image processing, artificial intelligence, machine learning (ML), and deep learning (DL) techniques are applied to the glass industry to improve the quality process. In 2009, Kang et al. [17] used the support vector machine (SVM) technique for the production of the liquid crystal display and classification accuracy was 86.409%. Öztürk and Akdemir utilized fuzzy-logic-based segmentation techniques in 2018, RGB and luminance values of the flat glasses were applied to fuzzy inputs, the success rate of the algorithm was 83.5% [18]. Bükücü and Görkem classified the flat glasses with SVM, quadratic discriminant, and medium tree classifiers in 2020, the success rate was 93.8% [1]. In 2020, Jin et al. [19] added Laplacian convolution layer to the Faster regional-convolutional neural network (R-CNN) to improve the feature extraction network and the mean detection accuracy rate was 94% for float glass. It is observed that the Faster R-CNN DL model achieved maximum success in these studies.
In 2021, defects on the surfaces of jars were investigated by Ulaş and Sari, faster R-CNN model was used to determine the studio environment and to detect scratch and bubble defects on the jar surface [20]. When determining the studio environment, the highest accuracy was found as 82.8% for the white matte background and -60 degree peak angle. When CSC and adaptive histogram equalization pre-processing techniques were applied to the images, the success rate increased to 90.4%. These results showed that pre-processing techniques increased the success rate, but could not reach the rates in flat and float glasses.
Another DL model that is used to detect surface defect detection is Yolo (You Only Look Once).
In 2018, Redmon and Farhadi modeled Yolo-V3 called as Darknet-53 and showed that it is faster than other object detection models on the COCO dataset [21]. Shu et al. applied the Yolo-V3 to commutator surfaces in 2021, and compared the results with other models and the accuracy rate of Yolo-V3 higher than the Faster R-CNN [22]. Kou et al., developed Yolo-V3 based model with added dense blocks to Darknet-53 for steel strip surface detection in 2021 and got higher performance [23].
In this study, Yolo-V3 (You Only Look Once) DL process has been investigated to increase the success rate for detecting defects on jar surfaces. Our research is carried out in the following steps: In the first stage, raw data of the images obtained from the studio environment which was determined from the study of Ulaş and Sari [20], trained and tested with Yolo-V3. In the second stage CSC methods, CIE-Lab Luv and HSV, were applied to raw data and success rates were obtained. In the third stage, adaptive histogram equalization processes applied to the V channels of CIE-Lab Luv and HSV. In the fourth stage acquired results are compared with the results of the Faster R-CNN.
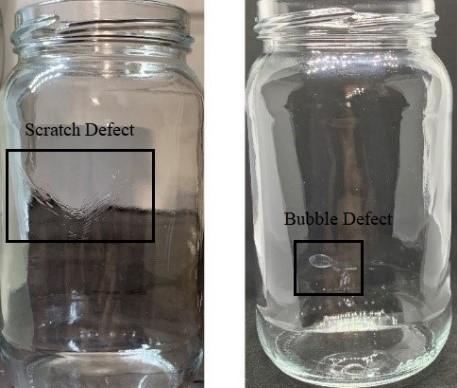
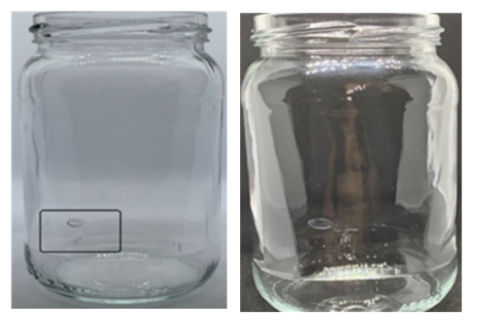
Bubble defect occurs when air bubbles remain in the glass raw material pressed into the molds during production. The fluctuations that occur with the missing or pasted area while coming out of the mold are called scratch errors.
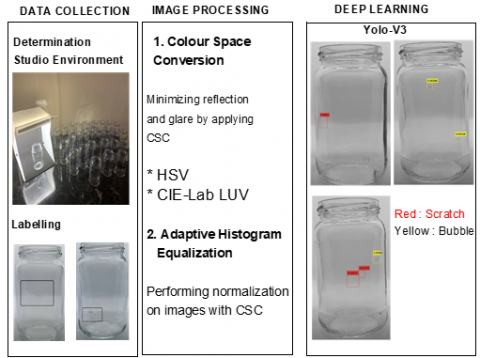
At the first stage, jar glasses including bubble and scratch defects were obtained from Basturk Cam Company. Bubble and scratch defects using in the study are given in Figure 1. The system architecture is given in Figure 2.
Figure 1. Scratch and bubble defects
Figure 2. System architecture
As can be seen from Figure 1, transparent structure of jar effected from ambient conditions such as reflection and shinning so determination of the studio environment and taking the images are important for the defect detection. Image enhancement is done with image processing techniques. In this study, CSC and adaptive histogram equalization methods are used for defect detection. Yolo-V3 DL method is applied to the images.
2.1 Feature extraction
Color space conversion (CSC) techniques utilize to separate the defects in the glass product visuals from the environmental effects (reflection, stain, dust, etc.). Also, these techniques are not affected by the image rotation, translation, and scale changing [11].
Hue, saturation, value is the features of the HSV color model. H is the property of the reflection and changes from 0 to 360 degrees, S is the purity of the color and V is the brightness of the color. Normalized values of S and V vary between 0 and 1 [12, 24 25]. RGB to HSV transformation equations is given in Eq. (1) [25-28].
$H=\cos ^{-1} \frac{0.5(2 R-G-B)}{\sqrt{(R-G)^{2}-(R-B)(G-B)}}, \quad S=\frac{\max (\mathrm{R}, \mathrm{G}, \mathrm{B})-\min (R, G, B)}{\max (R, G . B)}, \quad V=\max (R, G, B)$ (1)
The CIE-Lab Luv color space is perceptually uniform space, based on the Euclidean distance between two color points and non-linear mapping of the XYZ coordinates are used for the computation of the luminance (L) and the color (ab or uv) [25, 29]. RGB to Luv transformation is given in Eq. (2) and (3).
$\left[\begin{array}{l}X \\ Y \\ Z\end{array}\right]=\left[\begin{array}{ccc}0.412453 & 0.357580 & 0.180423 \\ 0.212671 & 0.715160 & 0.072169 \\ 0.0193334 & 0.119193 & 0.950227\end{array}\right]\left[\begin{array}{l}R \\ G \\ B\end{array}\right]$ (2)
$L^{*}=116 f\left(\frac{Y}{Y_{n}}\right)-16, a^{*}=500\left(f\left(\frac{X}{X_{n}}\right)-f\left(\frac{Y}{Y_{n}}\right)\right), b^{*}=200\left(f\left(\frac{Y}{Y_{n}}\right)-f\left(\frac{Z}{Z_{n}}\right)\right)$ (3)
where, $f(q)=q^{1 / 3}$ for $q>0.008856$ otherwise $f(q)=$ $7.787 q+16 / 116$ and $X_{n}, Y_{n}, Z_{n}$ represent as a reference white.
The adaptive histogram equalization (AHE) method is adapted from the histogram equalization method. In this method, the image enhancement process is applied by adjusting the contrast on a certain region of any image according to neighboring pixels [30-32].
2.2 YOLO
Yolo (You Only Look Once) deep learning model is an artificial neural network that can detect objects on the image together with their positions at once. It divides the image into cells and generates output vectors that attempt to predict the confidence score and bounding boxes for the objects in each cell. Yolo-V3 implements feature extraction using Darknet-53 because it has 53 convolution layers [21, 22]. Yolo-V3 uses end-to-end sensing. First, the image enters the Darknet53 network for feature extraction, and then anchor generation and loss calculation are performed on the three output scales of the feature extraction network. Finally, the target image is determined and found. Thus, it increases the detection accuracy and speed.
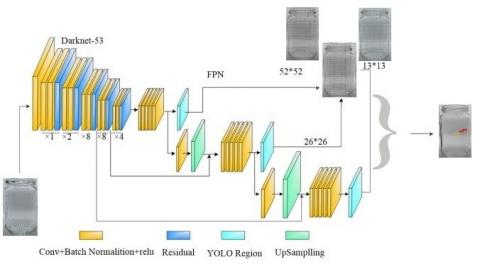
Yolo-V3 region of feature extraction data shown in Figure 3, Darknet-53 contains 3x3 and 1x1 convolution layers and residual blocks at x1, x2, x8, x8 and x4 stages. Yolo-V3 uses the idea of feature pyramid networks (FPN) to make predictions at three different scales, these scales are generated through convolutional networks and divided into SxS grid. The grid is responsible for predicting the target object falling into one of the grids in the image. In object recognition, bounding boxes are recommended for all objects in the image. For the bounding box drawing, 4 different parameters are required, the center point (x, y) where the object is located, as well as height and width. If these parameters are estimated correctly, the predicted bounding box and the ground truth bounding box will largely overlap, resulting in a high IoU (Intersection over Union).
In this study, the learning is done by creating 13x13, 26x26 and 52x52 boxes with FPN application.
Figure 3. The architecture of Yolo-V3
Precision rate, recall rate, and F1 score, presented in Eq. (4) through (6), respectively, is the evaluation criterion used to measure the accuracy of deep learning algorithms.
Precision Rate $=\frac{\text { True Positive }}{\text { True Positive }+\text { False Positive }}$ (4)
Recall Rate $=\frac{\text { True Positive }}{\text { True Positive }+\text { False Negative }}$ (5)
$F 1-$ score $=\frac{2 x \text { Precision } x \text { Recal }}{\text { Precision }+\text { Recall }}$ (6)
Photographs collected with a 12 MP color image camera, the digital dimensions of the photographs taken at the maximum resolution were taken as 710 pixels horizontally and 1280 pixels vertically. Aperture and depth adjustments have been made to ensure professional quality and to minimize reflection in the data to be imaged.
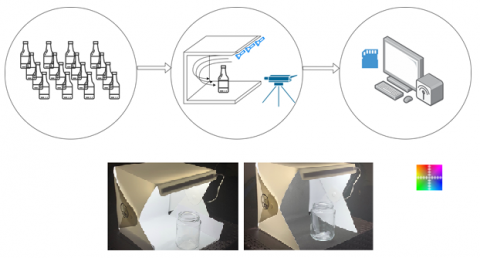
As indicated in the study [20], jars were photographed by the camera for the different backgrounds and peak angle of the studio, Figure 4. The Faster R-CNN DL technique was used to determination of the studio environment to obtain raw data; results are given in Table 1.
Table 1. Studio background results [20]
|
Studio Background / Peak Angle |
Success Rate (%) |
|
Black glossy |
75.07 |
|
White glossy |
76.47 |
|
Black matte |
77.47 |
|
White matte |
79.72 |
|
Black matte / -60° |
80.56 |
|
White matte / -60° |
82.82 |
Figure 4. Background determination with studio
White matte background and -60 degree apex angle studio environment was chosen depend on the Table 1. The studio environment and daylight pictures are given in Figure 5, respectively. It is visually observed that the images obtained in the studio environment are less affected by reflection.
Figure 5. Studio environment and daylight lighting pictures
In deep learning, a large number of labelled data is needed, which is very costly to collect and prepare, methods such as mirroring, bleaching, rotation, and scaling prefer for data augmentation [33]. 360 original images increased to 1180 with MATLAB®'s image data augmenter, including reflection, bleaching, rotation, and scaling. The dataset was labelled and the expected result values were introduced. For this process, the images in the training dataset were labelled using the Image Labeler application on the MATLAB® platform.
Randomly selected 70% of the data set was used for training purposes and 30% was used for testing and validation. At the first stage, raw data classified with Yolov3 and results are given in Table 2.
Table 2. Raw data success rates
|
|
Precision Rate |
Recall Rate |
F1-Score |
|
Raw data |
94.55 |
94.66 |
94.60 |
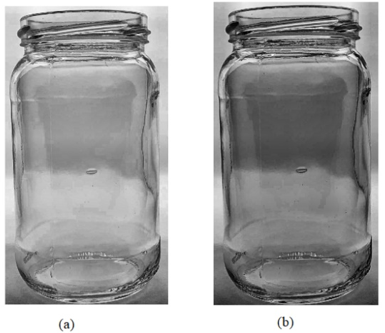
To increase the output rates CSV techniques were applied to the obtained images, Figure 6.
As can be seen from Figure 6, V channels are suitable for labeling bubbles and scratch defects so V channels are selected for training and testing. Also adaptive histogram equalization algorithms were applied to the V channels, Figure 7.
Pre-processing techniques and their performances are given in Table 3.
Figure 6. Glass image treated with (a) HSV, (b) CIE-Lab Luv
Figure 7. Adaptive histogram equalization operation on V channels of (a) HSV (b) CIE-Lab Luv
Table 3. Pre-processing techniques and performances
|
Pre-processing techniques |
Precision Rate |
Recall Rate |
F1-Score |
|
HSV |
93.13 |
93.40 |
93.26 |
|
CIE-Lab Luv |
94.69 |
94.80 |
94.74 |
|
AHE applied to HSV |
97.10 |
93.13 |
95.07 |
|
AHE applied to CIE-Lab Luv |
97.44 |
97.27 |
97.35 |
According to the results in Table 3, the HSV method decreases the performance of Yolo-V3. Performance is increasing with AHE applied to CSC. The reason for this is the reduction of reflections on the glass surface with AHE. Maximum performance was obtained as 97.35% when AHE was applied to CIE-Lab Luv.
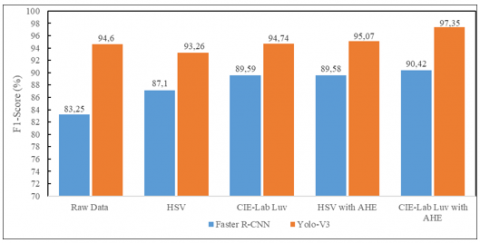
Obtained results are compared with the Faster R-CNN [20] in Figure 8.
Figure 8. Comparison of Yolo-V3 with faster R-CNN
When Figure 8 is examined, the Yolo-V3 technique has higher performance than Faster R-CNN in all analyses. AHE with CIE-Lab Luv gives the highest overall accuracy in both DL methods. The HSV method improves the F1-score in Faster R-CNN, while a decrease occurs in Yolo-V3.
In the image processing and deep learning algorithms which evaluated performances, the average training time in the Faster R-CNN model was 8.75 hours, while the test time was approximately 0.4 ms. In the YoloV3 deep learning model, the average training time was 6.50 hours, while the average test time was 0.27 ms.
In this study, scratch and bubble defects on glass are investigated. Yolo-V3 deep learning technique was applied to the images taken in the white matte background and a -600 peak angle illuminated studio environment. To improve the obtained results, color space conversion and adaptive histogram equalization methods are utilized for pre-processing respectively. In the analyzes performed by selecting V channels, it was observed that the performance is decreasing with pre-processed HSV method no significant increase is observed in the use of CIE-Lab Luv alone, but it reached the highest performance when it used together with AHE. The most important reason why CIE-Lab Luv gives higher rates in the Yolo-V3 deep learning technique than the HSV method is that it reduces reflections on the glass surface by using the Euclidean distance between two color points.
Also, the Yolo-V3 method gives higher results in all analyzes than Faster R-CNN, and obtained highest overall accuracy is achieved with the together use of CIE-Lab LUV and AHE technique for both methods, individually.
Relevant material and data samples are provided by Basturk Cam Company.
[1] Bükücü, C.C., Görkem L. (2020). A new prototype that performs real-time error detection in glass products. International Journal of Engineering Research and Development, 12(2): 510-519. https://doi.org/10.29137/umagd.681653
[2] Zhou, X., Wang, Y., Zhu, Q., Mao, J., Xiao, C., Lu, X., Zhang, H. (2020). A surface defect detection framework for glass bottle bottom using visual attention model and wavelet transform. IEEE Transaction on Industrial Informatics, 16(4): 2189-2201. https://doi.org/10.1109/TII.2019.2935153
[3] Nishu, Agrawal, S. (2011). Glass defect detection techniques using digital image processing-A review. Special issues on IP Multimedia Communication, (1): 65-67.
[4] Zhao, J., Kong, Q.J., Zhao, X., Liu, J., Liu, Y. (2011). A method for detection and classification of glass defects in low resolution images. 2011 Sixth International Conference on Image and Graphics, pp. 642-647. https://doi.org/10.1109/ICIG.2011.187
[5] Duan, F., Wang, Y.N., Liu, H.J., Li, Y.G. (2007). A machine vision inspector for beer bottle. Engineering Applications of Artificial Intelligence, 20(7): 1013-1021. https://doi.org/10.1016/j.engappai.2006.12.008
[6] Peng, X., Chen, Y., Yu, W., Zhou, Z., Sun, G. (2008). An online defects inspection method for float glass fabrication based on machine vision. The Internatiol Journal of Advanced Manufacturing Technology, 39: 1180-1189. https://doi.org/10.1007/s00170-007-1302-7
[7] Xue, P., Jiang, C.H., Pang, H.L. (2021). Detection of various types of metal surface defects based on image processing. Traitement du Signal, 38(4): 1071-1078. https://doi.org/10.18280/ts.380417
[8] Jian, C., Gao, J., Ao, Y. (2017). Automatic surface defect detection for mobile phone screen glass based on machine vision. Applied Soft Computing, 52: 348-358. https://doi.org/10.1016/j.asoc.2016.10.030
[9] Jin, Y., Wang, Z., Zhu, L., Yang, J. (2011). Research on in-line glass defect inspection technology based on dual CCFL. Procedia Engineering, 15: 1797-1801. https://doi.org/10.1016/j.proeng.2011.08.334
[10] Cabral, J., Araújo, S.A. (2012). Computer vision system for automatic quality inspection of glass products used for food packaging. International Conference on Industrial Engineering and Operations Management, pp. 1-10.
[11] Ming, W., Shen, F., Li, X., Zhang, Z., Du, J., Chen, Z., Cao, Y. (2020). A comprehensive review of defect detection in 3C glass components. Measurement, 158: 107722. https://doi.org/10.1016/j.measurement.2020.107722
[12] Nishu, Agrawal, S. (2012). Automated inspection of defects in glass by proper color space selection and segmentation technique of digital image processing. Int.J.Computer Technol. Appl., 3(3): 1058-1063.
[13] Kumar, R., Kaur, N. (2013). Detection of defects in glass using edge detection with adaptive histogram equalization. International Journal of Innovative Research in Computer and Communication Engineering, 1(6): 1321-1327.
[14] Zhou, X., Wang, Y., Xiao, C., Zhu, Q., Lu, X., Zhang, H. Ge, J., Zhao, H. (2019). Automated visual inspection of glass bottle bottom with saliency detection and template matching. IEEE Transactions on Instrumentation and Measurement, 68(11): 4253-4267. https://doi.org/10.1109/TIM.2018.2886977
[15] Zhang, H., Guo, Z., Qi, Z. (2012). Research of glass defects detection based on DFT and optimal threshold method. International Conference on Computer Science and Information Processing, pp. 1044-1047. https://doi.org/10.1109/CSIP.2012.6309035
[16] Akdemir, B., Öztürk, Ş. (2015). Glass surface defects detection with wavelet transforms. International Journal of Materials, Mechanics and Manufacturing, 3(3): 170-173. https://doi.org/10.7763/ijmmm.2015.v3.189
[17] Kang, S.B., Lee, J.H., Song, K.Y., Pahk, H.J. (2009). Automatic defect classification of TFT-LCD panels using machine learning. IEEE International Symposium on Industrial Electronics, pp. 2175-2177. https://doi.org/10.1109/ISIE.2009.5213760
[18] Öztürk, Ş., Akdemir, B. (2018). Fuzzy logic-based segmentation of manufacturing defects on reflective surfaces. Neural Computing and Applications, 29: 107-116. https://doi.org/10.1007/s00521-017-2862-6
[19] Jin, D.B., Xu, S.Q., Tong, L.J., Wu, L.Y., Liu, S.M. (2020). End image defect detection of float glass based on faster region-based convolutional neural network. Traitement du Signal, 37(5): 807-813. https://doi.org/10.18280/ts.370513
[20] Ulaş, A.B., Sari, F. (2021). Detection of errors in glass products in studio environment with image processing and deep learning methods. 5th International Conference on Engineering Technologies, pp. 198-204.
[21] Redmon, J., Farhadi, A. (2018). YOLOv3: An incremental improvement. https://arxiv.org/pdf/1804.02767.
[22] Shu, Y.F., Li, B., Li, X., Xiong, C., Cao, S., Wen, X.Y. (2021). Deep learning-based fast recognition of commutator surface defects. Measurement, 178: 109324. https://doi.org/10.1016/j.measurement.2021.109324
[23] Kou, X., Liu, S., Cheng, K., Qian, Y. (2021). Development of a YOLO-V3-based model for detecting defects on steel strip surface. Measurement, 182: 109454. https://doi.org/10.1016/j.measurement.2021.109454
[24] Li, S., Guo, G. (2010). The application of improved HSV color space model in image processing. 2010 2nd International Conference on Future Computer and Communication, pp. V2-10-V2-13. https://doi.org/10.1109/ICFCC.2010.5497299
[25] Acharya, T., Ray, A.K. (2005). Image Processing: Principles and Applications. Wiley-Interscience.
[26] Ganesan, P., Rajini, V. (2014). Assessment of satellite image segmentation in RGB and HSV color space using image quality measures. International Conference on Advances in Electrical Engineering, pp. 1-5. https://doi.org/10.1109/ICAEE.2014.6838441
[27] Lesiangi, F.S., Mauko, A.Y., Djahi, B.S. (2021). Feature extraction Hue, Saturation, Value (HSV) and Gray Level Cooccurrence Matrix (GLCM) for identification of woven fabric motifs in South Central Timor Regency. Journal of Physics: Conference Series, 2017: 012010. https://doi.org/10.1088/1742-6596/2017/1/012010
[28] Ouannes, L., Ben Khalifa, A., Essoukri Ben Amara, N. (2021). Comparative study based on de-occlusion and reconstruction of face images in degraded conditions. Traitement du Signal, 38(3): 573-585. https://doi.org/10.18280/ts.380305
[29] Wiharto, Nashrullah, F.H., Suryani, E., Salamah, U., Prakisya, N.P.T., Setyawan, S. (2021). Texture-based feature extraction using Gabor filters to detect diseases of tomato leaves. Revue d'Intelligence Artificielle, 35(4): 331-339. https://doi.org/10.18280/ria.350408
[30] Zimmerman, J.B., Pizer, S.M., Staab, E.V., Perry, J.R, McCartney, W., Brenton, B.C. (1988). An evaluation of the effectiveness of adaptive histogram equalization for contrast enhancement. IEEE Transactions on Medical Imaging, 7(4): 304-312. https://doi.org/10.1109/42.14513
[31] Pizer, S.M., Amburn, E.P., Austin, J.D., Cromartie, R., Geselowitz, A., Greer, T., Romeny, B.H., Zimmerman, J.B., Zuiderveld, K. (1987). Adaptive histogram equalization and its variations. Computer Vision, Graphics, and Image Processing, 39(3): 355-368. https://doi.org/10.1016/S0734-189X(87)80186-X
[32] Subramani, B., Veluchamy, M. (2018). MRI brain image enhancement using brightness preserving adaptive fuzzy histogram equalization. International Journal of Imaging Systems and Technology, 28(3): 217-222. https://doi.org/10.1002/ima.22272
[33] Park, J., Riaz, H., Kim, H., Kim, J. (2020). Advanced cover glass defect detection and classification based on multi-DNN model. Manufacturing Letters, 23: 53-61. https://doi.org/10.1016/j.mfglet.2019.12.006