Hemant Choubey* | Sandeep Sharma | Rajendra Bahadur Singh | Vimlesh Kumar Ray
© 2022 IIETA. This article is published by IIETA and is licensed under the CC BY 4.0 license (http://creativecommons.org/licenses/by/4.0/).
OPEN ACCESS
A neurological disorder called Epilepsy which causes the sudden occurrence of epileptic seizures. The electroencephalogram (EEG) is the recorded electrical activities of the brain to examine the epileptic patient through EEG pattern for diagnosis. Epileptic seizure is one of the abnormality or brain disorder in which seizure patterns shows large spikes for specific time domain or area. This work mainly focused on detecting the Epileptic seizures or Epilepsy through the extracted feature like Higuchi Fractal Dimension (HFD) and Masking and Check-in based feature extraction technique (MCFET). Three scaling features of HFD viz. fractal dimension, the standard deviation of fractal dimension and scaling factor while twenty masking and check-in-based features of the upper and the lower envelope along with ten features of the Discrete Wavelet Transform (DWT) coefficients (Table 1) from raw EEG signals are required as input to the Artificial Neural Network (ANN) for classifications. The overall performance is improved in terms of Accuracy, Sensitivity, Specificity through both HFD and MCFET features. Further, the overall accuracy using HFD and MCFET based feature extraction technique around 98% with a bit of computational time of about 1 second by reducing the training percent from 80% to 60%.
Higuchi fractal dimension (HFD), electroencephalogram (EEG) signal, Levenberg Marquardt (LM), k-Nearest neighbour (kNN), least fitting square (LS)
Electroencephalogram is a diagnostic tool for the prediction of Epilepsy. As per the World Health Organization (WHO) fact sheet, over 2% of the world population suffer from a persistent neuronal disease known as Ictal or Epilepsy with uncertain seizure signals. Epilepsy can be occurred almost all ages of people and majorly it divides in two parts i.e. Internal and External. Internal Epilepsy occurs due to stress, lack of oxygen during birth and genetically transfer through parents while external Epilepsy occurs due to severe head injury and excess consumption of alchol during stress. This brain electrical activity is read through Electroencephalogram. Electroencephalograms appear to be complicated assemblies of disorganized, randomly superimposed, and varying activity of Epileptic seizures.
MCFET is a statistical technique for extraction of stationarity behaviour of EEG signal while HFD is the pattern recognition approach in which different fractal dimension parameter values identify the class of EEG signal. Detection of Epilepsy or concurrent seizure in EEG signal requires the following steps:
1. Extraction of MCFET and HFD parameters.
2. Classification based on above parameters using Artificial Neural Network classifier with little computational time.
Others works based on seizure prediction algorithms discussed in this section 1.1.
1.1 Related works on seizure prediction algorithm
Choubey and Pandey [1] proposed K-Nearest Neighbor (KNN) classification technique and MCFET for detection and classification of EEG signal samples. While in their other work, they have used a combination of statistical parameters to detect epilepsy and EEG classification using Artificial Neural Network (ANN) and K-Nearest Neighbour(K-NN) classifiers [2]. This approach is limited to HFD parameters with maximum accuracy of 91.33%. In another work, Bilal et al. [3] used multiresolution dynamic mode decomposition (DMD) to detect Epilepsy whereas, Imtiaz et al. [4] used the six main blocks for seizure sample data reduction together with other supporting blocks for efficient classification. Zeng et al. [5] analyzed the Visibility Heights Entropy of Hierarchical Neighbors for detecting Epileptic seizures. Zhao et al. [6] used three entropies (Spectral Entropy, Renyi Entropy, and Approximate Entropy) for epileptic seizure detection. Another work carried out by Chen et al. [7] reached eight entropies for seizure detection in which optimised performance with an accuracy, sensitivity and specificity of 99.50%, 100.00%, and 99.40% respectively and compared the results with traditional machine learning methods. Yuan et al. [8] developed a Deep Learning model to detect Epileptic seizures. This paper transforms the EEG segment into the time-frequency domain and then adds a sparsity and selectivity constrain module to detect effective EEG channels. Andy et al. used an SVM classifier to detect seizure signals from EEG signals. A Bayesian optimization algorithm has been used to optimize the hyper-parameters of SVM with extracted features like entropy and connectivity on publicly available CHB-MIT database. Hussein et al. [9] worked on a critical review for Focal and Non-Focal Epilepsy. This paper mainly reviews on EMD, Entropy, Tensors, DWT and Dynamic Analysis-based feature extraction techniques for detecting the Epileptic seizure from EEG signal. Satapathy et al. [10] classified EEG signals using RBF neural network with Particle Swarm Optimization (PSO) technique and produced a maximum accuracy of around 99% compared to the other techniques. Saminu et al. [11] reviewed standard statistical features like mean, median, skewness, kurtosis, curve length, and DWT to detect Epileptic seizures from EEG signals. The current progress on Epileptic Seizure detection based on automatic seizure detection using deep and machine learning technique which require complex optimization approach for improving performance parameter in terms of Accuracy and Sensitivity. From the above study, it is clearly analyzed that the existing Epileptic seizure detection techniques have the following drawbacks:
This work aims to develop an Artificial Neural Network based classification technique with reduced statistical features like HFD and MCFET to solve these issues. Also, this work classifies three sets of EEG data classes. Class A and B for Normal (Healthy) EEG signal samples, class B and C for Pre-Ictal EEG signal samples, and class C for Ictal EEG signal samples based on pattern recognition and identification technique.
The main research objectives of this work are depicted in this Section 1.2.
1.2 Research objectives
The step-by-step sequence of this research work for seizure prediction are:
The rest of this work is divided into three sections. Section 2 discusses feature extraction while Section 3 shows performance parameters and results using ANN Classifier. In the last, Conclusion with Future Work depicted in Section 4.
1.3 Data set description
EEG datasets consist of total 500 channels provided by the University of Bonn, Germany. Each channel is of 23.6s duration according to the international 10-20 electrode system.
Table 1. Data set description
|
Class |
No of Channels |
State |
|
Z (Set A) |
100 |
Normal EEG data with eyes close |
|
O (Set B) |
100 |
Normal EEG data with open eyes |
|
N (Set C) |
100 |
Inter-ictal (State before Epileptic Seizure) |
|
F (Set D) |
100 |
Inter-ictal (State before Epileptic Seizure) |
|
S (Set E) |
100 |
Ictal or Epileptic Seizure |
2.1 Higuchi fractal dimension based feature extraction technique
The length of irregular curve with small number of points used in Higuchi method for the approximation of fractal dimension at multiple scale [12, 13]. Geometrical shape of EEG samples at different scales is the feature input for the EEG segments classification depicted in the work of Nandy et al. [13] which is based on non-linear techniques. Three scaling features required for classifications are Fractal Dimension FD, which measures the complexity of series, SFD, the standard deviation of the fractal dimension; and Sb, the standard deviation of the scaling factor in which k is the hopping interval of signal. These feature values as input to the ANN classifier. According to the algorithm proposed by Higuchi [12], for HFD calculation shown in Figure 1, as Fractal Dimension (FD) can be calculated using a LS fitting procedure as Y=aX+b, where, a=Df according to the formula as Eq. (1).
$D_{f}=\frac{n \sum\left(x_{k} \cdot y_{k}\right)-\sum x_{k} \sum y_{k}}{n \sum x_{k}^{2}-\left(\sum x_{k}\right)^{2}}$ (1)
where, yk=ln(Zmean) and xk=ln(1/k) for k=1, 2, 3, …, kmax.
n denotes the number of k values for which linear regression is calculated ($2 \leq n \leq k_{\max }$). The standard deviation of Df can be calculated as Eq. (2).
$S D_{f}=\sqrt{\frac{n \cdot\left[\sum y_{k}^{2}-D_{f} \sum x_{k} y_{k}-b \cdot \sum y_{k}\right]}{(n-2) \cdot\left[n \cdot \sum x_{k}^{2}-\left(\sum x_{k}\right)^{2}\right]}}$ (2)
where, $b=\frac{1}{n}\left(\sum y_{k}-D_{f} \sum x_{k}\right)$ with standard deviation as Eq. (3).
$S_{b}=\sqrt{\frac{1}{n} \cdot S D_{f}^{2} \cdot \sum x_{k}^{2}}$ (3)
Figure 1. Higuchi fractal dimension-based feature extraction
2.2 MCFET algorithm
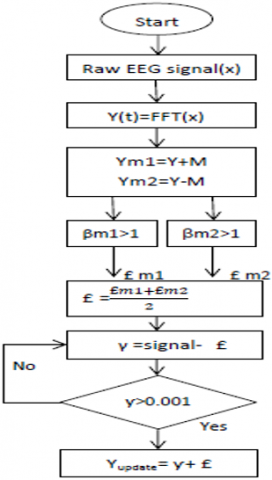
The MCFET works on the stationary behavior of EEG signals during masking. This technique offers a large volume of useful and important vector sets with minimum information loss. The basic steps of this algorithm are to transform a EEG samples using fast Fourier transform that’s divide time domain signals into frequency domain. It is actually a single sinusoidal oscillation at different frequencies. After that the process for mask generation is applied to the given EEG samples, in which the threshold value is fixed at 5.5 for better extraction of features. And this value estimates the length between two peak points, upper and lower after providing the masking over the signal. According to the study [1], algorithm for feature extraction from MCFET as explained in Figure 2.
Figure 2. Flowgraph of MCFET algorithm
Apply check-in function to calculate the following parameters for £;
$¥_{\text {update }}=\gamma+£$ (4)
$¥_{\text {final }}=(1 / \pi) * ¥_{\text {update }}$ (5)
Compute the SNR, variance, and standard 2 deviation for $¥_{\text {final }}$, which helps us extract the features with large feature values for better classification purposes.
Performance parameter such as Accuracy, Sensitivity, Selectivity and ADR determine the effectiveness of the detection model. This is based on the values of TP, TN, FP, and FN of confusion matrix. Detection of Epileptic sample from the total EEG samples characterizes model performance.
3.1 Accuracy
The correct classification EEG data samples to the total number of the correct and incorrect EEG data samples defined Accuracy as Eq. (6).
$\operatorname{Accuracy}(\%)=\frac{\text { True Positive+True Negetive }}{(\text { True Positive+True Negetive+False Positive+False Negetive })} * 100(\%)$ (6)
3.2 Selectivity
Selectivity for the ictal segment defined from the False rejection as Eq. (7). It characterizes the rejection of False data from EEG sample.
Selectivity $(\%)=\frac{\text { True Positive }}{\text { True Positive }+\text { False Positive }} * 100(\%)$ (7)
3.3 Sensitivity
Epileptic seizure(ictal) data segments from EEG data segments defined as Eq. (8). It is based on the selection of correct data.
Sensitivity $(\%)=\frac{\text { True Positive }}{\text { True Positive+False Positive }} * 100(\%)$ (8)
3.4 Specificity
Specificity for Pre-ictal segment defined as Eq. (9).
Specificity $(\%)=\frac{\text { True Negetive }}{\text { True Negetive+False Positive }} * 100(\%)$ (9)
3.5 Average detection rate
Average of Selectivity and Sensitivity defined as Eq. (10).
$\operatorname{ADR}(\%)=\frac{\text { Sensitivity }+\text { Specificity }}{2} * 100(\%)$ (10)
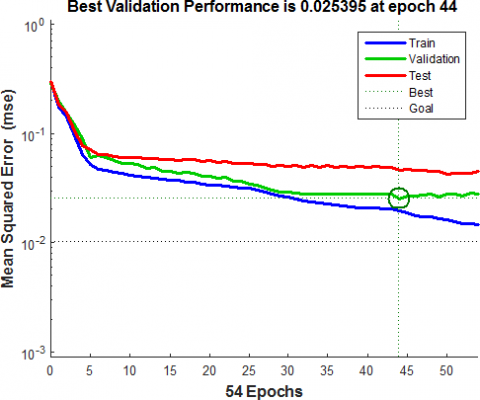
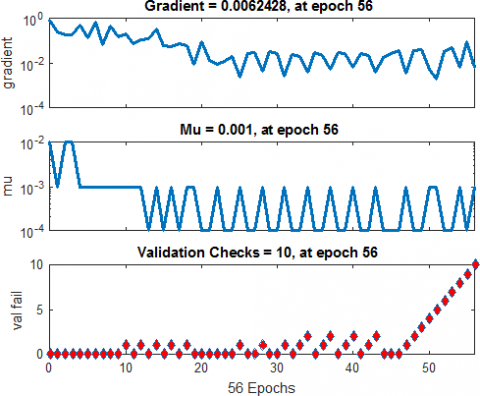
Figure 3. Performance plot for 80% trained data with MSE and epoch
Figure 4. Training and validation plot for 80% trained data
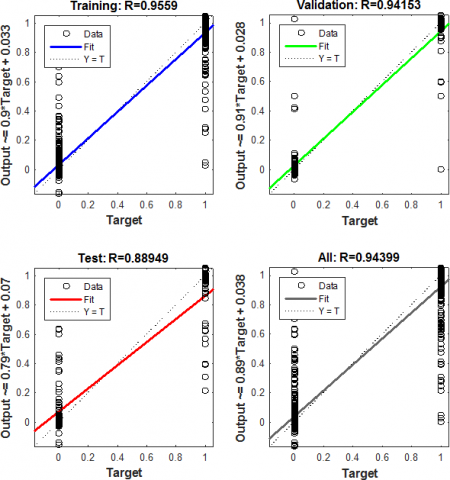
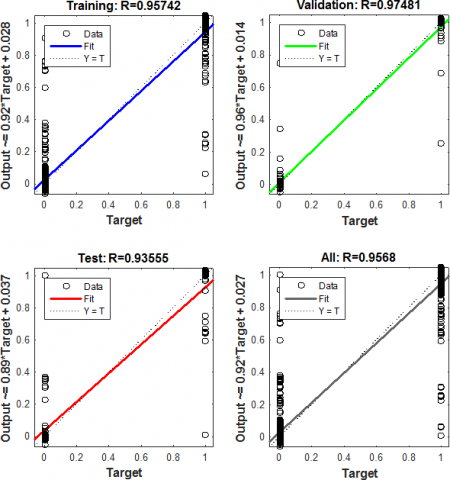
Figure 5. Regression plot for 80% trained data
Table 2. Feature details
|
S.No. |
Features |
Name of Sub features |
|
1 |
HFD |
Fractal Dimension (Df) |
|
SDf |
||
|
Sb |
||
|
2 |
MCFET |
Maximum Value (Mx) of the EEG data set |
|
Minimum Value (Mn) of the EEG data set. |
||
|
Mean of Upper Envelope (MU). |
||
|
Mean of Lower Envelope (ML). |
||
|
The variance of Upper Envelope (VARIANCE1). |
||
|
Signal to Noise Ratio of Upper Envelope (SNR1) |
||
|
Standard Deviation of Upper Envelope (STDTN1). |
||
|
The variance of Upper Envelope (VARIANCE2). |
||
|
Standard Deviation of Upper Envelope (STDTN2). |
||
|
DWT Approximate and Detail Coefficients of 4096 samples (Selecting only 10 DWT Features) |
Table 3. Classification based on HFD+MCFET parameters for ANN classifier
|
ANN Based Classification |
|||
|
Training (%) = 80%, Time = 4 Sec |
|||
|
Confusion Matrix |
|||
|
|
Ictal |
Pre-ictal (Interictal) |
Normal (Healthy) |
|
Ictal |
95 |
4 |
1 |
|
Pre-ictal (Interictal) |
1 |
96 |
3 |
|
Normal (Healthy) |
0 |
3 |
97 |
|
Accuracy (%) = 97.333% |
|||
|
Selectivity (%) = 96.06% |
|||
|
Sensitivity (%) = 96% |
|||
|
Specificity (%) = 67.12% |
|||
|
Average Detection Rate (%) = 81.56% |
|||
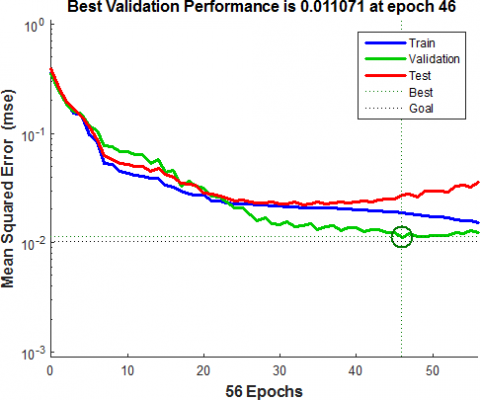
Table 3, 4 and 5 shows ANN based classification which uses 23 input hidden layer and 3 output layer with trainlm activation function. Table 2 for 80% trained data having Accuracy of about 97.11% with a computational time of one second. Network performance plot in terms of mean square error and epoch as shown in Figure 3, Figure 6 and Figure 9 for 80%, 70% and 60% respectively. The best validation performance is 0.011071 at epoch 46 for 60% trained data. Figure 4, Figure 7 and Figure 10 represent the training and validation plot for 80%, 70% and 60% trained data, respectively. Lastly, Figure 5, Figure 8 and Figure 11 represent regression plots for different training and testing percentage ratios.
Table 4. Classification based on HFD+MCFET parameters for ANN classifier
|
ANN Based Classification |
|||
|
Training (%) = 70%, Time = 7 Sec |
|||
|
Confusion Matrix |
|||
|
|
Ictal |
Pre-ictal (Interictal) |
Normal (Healthy) |
|
Ictal |
94 |
3 |
3 |
|
Pre-ictal (Interictal) |
1 |
97 |
2 |
|
Normal (Healthy) |
0 |
4 |
96 |
|
Accuracy (%) = 97.111% |
|||
|
Selectivity (%) = 95.75% |
|||
|
Sensitivity (%) = 95.66% |
|||
|
Specificity (%) = 67.16% |
|||
|
Average Detection Rate (%) = 81.4134% |
|||
Figure 6. Performance plot for 70% trained data
Figure 7. Training and validation plot for 70% trained data
Figure 8. Regression plot for 70% trained data
Table 5. Classification based on HFD+MCFET parameters for ANN classifier
|
ANN Based Classification |
|||
|
Training (%) = 60%, Time = 7 Sec |
|||
|
Confusion Matrix |
|||
|
|
Ictal |
Pre-ictal (Interictal) |
Normal (Healthy) |
|
Ictal |
96 |
2 |
2 |
|
Pre-ictal (Interictal) |
2 |
97 |
1 |
|
Normal (Healthy) |
0 |
2 |
98 |
|
Accuracy (%) = 98.00% |
|||
|
Selectivity (%) = 97.00% |
|||
|
Sensitivity (%) = 97.00% |
|||
|
Specificity (%) = 67.00% |
|||
|
Average Detection Rate (%) = 82.00% |
|||
Figure 9. Performance plot for 60% trained data with MSE and Epoch
Figure 10. Training and validation plot for 70% trained data
Figure 11. Regression plot for 60% trained data
3.6 Comparison with other existing techniques using different set of classes
The Table 6 shows three test cases in which classes of healthy EEG signal with Epileptic signal are considered in terms of Accuracy, Sensitivity and Specificity and compared Proposed Method with EEG classification technique using RBFN with GD, PSO and IPSO optimization technique. Accuracy, Sensitivity and Specificity is around 98% for all 3 test cases. The Proposed method for the three test cases is superior in terms of Accuracy without optimization and little computation time using simple HFD and MCFET features directly from the EEG signal.
Table 6. Comparison of the proposed technique with the benchmark
|
Test Cases |
Group |
Measures |
RBFN with GD [11] |
RBFN with PSO [11] |
RBFN with IPSO [11] |
Proposed Method (MCFET+HFD) |
|
Test Case-1 |
Set D & E |
Accuracy |
93 |
94 |
92 |
97 |
|
Sensitivity |
93.4 |
96 |
96 |
97 |
||
|
Specificity |
94 |
95 |
93.66 |
97 |
||
|
Test Case-2 |
Set AD & E |
Accuracy |
95 |
92 |
93 |
98 |
|
Sensitivity |
96.1 |
93 |
93.33 |
97 |
||
|
Specificity |
97 |
94 |
95.21 |
98 |
||
|
Test Case-3 |
Set A & E |
Accuracy |
92 |
93.6 |
95 |
99 |
|
Sensitivity |
94 |
95 |
98 |
98.6 |
||
|
Specificity |
97 |
98.3 |
98.6 |
100 |
The primary work of this paper is to reduced accuracy and computation time. Accuracy for detecting Epileptic seizures becomes around 98% with both HFD and MCFET features with a reduction of training percentage ratio. It is the simplest assessment technique for the detection of Epileptic Seizure without Optimization and reduction of feature. The average computational time for detecting Epileptic seizures varies from 4 to 7 seconds, with an average detection ratio of about 82%. It can be further improved by using an optimized algorithm at the preprocessing stage before the EEG signal classification. Accuracy can be improved further by using various optimization algorithms after extraction of various statistical features.
We want to acknowledge Madhav Institute of Technology and Science, Gwalior, for providing institutional support for this work. We also extend our sincere thanks to the editor and all the anonymous reviewers for providing helpful comments and suggestions to shape our manuscript in the current form finally.
[1] Choubey, H., Pandey, A. (2019). A new feature extraction and classification mechanisms for EEG signal processing. Multidimensional Systems and Signal Processing, 30(4): 1793-1809. https://doi.org/10.1007/s11045-018-0628-7
[2] Choubey, H., Pandey, A. (2021). A combination of statistical parameters for the detection of epilepsy and EEG classification using ANN and KNN classifier. Signal, Image and Video Processing, 15(3): 475-483. https://doi.org/10.1007/s11760-020-01767-4
[3] Bilal, M., Rizwan, M., Saleem, S., Khan, M.M., Alkatheir, M.S., Alqarni, M. (2019). Automatic seizure detection using multi-resolution dynamic mode decomposition. IEEE Access, 7: 61180-61194. https://doi.org/10.1109/ACCESS.2019.2915609
[4] Imtiaz, S.A., Iranmanesh, S., Rodriguez-Villegas, E. (2019). A low power system with EEG data reduction for long-term epileptic seizures monitoring. IEEE Access, 7: 71195-71208. https://doi.org/10.1109/ACCESS.2019.2920006
[5] Zeng, M., Zhao, C.Y., Meng, Q.H. (2019). Detecting seizures from EEG signals using the entropy of visibility heights of hierarchical neighbors. IEEE Access, 7: 7889-7896. https://doi.org/10.1109/ACCESS.2019.2890895
[6] Zhao, X., Zhang, R., Mei, Z., Chen, C., Chen, W. (2019). Identification of epileptic seizures by characterizing instantaneous energy behavior of EEG. IEEE Access, 7: 70059-70076. https://doi.org/10.1109/ACCESS.2019.2919158
[7] Chen, S., Zhang, X., Chen, L., Yang, Z. (2019). Automatic diagnosis of epileptic seizure in electroencephalography signals using nonlinear dynamics features. IEEE Access, 7: 61046-61056. https://doi.org/10.1109/ACCESS.2019.2915610
[8] Yuan, Y., Xun, G., Jia, K., Zhang, A. (2018). A multi-view deep learning framework for EEG seizure detection. IEEE Journal of Biomedical and Health Informatics, 23(1): 83-94. https://doi.org/10.1109/JBHI.2018.2871678
[9] Hussein, A.F., Arunkumar, N., Gomes, C., et al. (2018). Focal and non-focal epilepsy localization: A review. IEEE Access, 6: 49306-49324. https://doi.org/10.1109/ACCESS.2018.2867078
[10] Satapathy, S.K., Dehuri, S., Jagadev, A.K. (2017). EEG signal classification using PSO trained RBF neural network for epilepsy identification. Informatics in Medicine Unlocked, 6: 1-11. https://doi.org/10.1016/j.imu.2016.12.001
[11] Saminu, S., Xu, G., Shuai, Z., et al. (2021). A recent investigation on detection and classification of epileptic seizure techniques using EEG signal. Brain Sciences, 11(5): 668. https://doi.org/10.3390/brainsci11050668
[12] Higuchi, T. (1988). Approach to an irregular time series on the basis of the fractal theory. Physica D: Nonlinear Phenomena, 31(2): 277-283. https://doi.org/10.1016/0167-2789(88)90081-4
[13] Nandy, A., Alahe, M.A., Uddin, S.N., Alam, S., Nahid, A.A., Awal, M.A. (2019). Feature extraction and classification of EEG signals for seizure detection. In 2019 International Conference on Robotics, Electrical and Signal Processing Techniques (ICREST), Dhaka, Bangladesh, pp. 480-485. https://doi.org/10.1109/ICREST.2019.8644337