Kadir Can Burçak* | Harun Uğuz
© 2022 IIETA. This article is published by IIETA and is licensed under the CC BY 4.0 license (http://creativecommons.org/licenses/by/4.0/).
OPEN ACCESS
Breast cancer is a dangerous type of cancer usually found in women and is a significant research topic in medical science. In patients who are diagnosed and not treated early, cancer spreads to other organs, making treatment difficult. In breast cancer diagnosis, the accuracy of the pathological diagnosis is of great importance to shorten the decision-making process, minimize unnoticed cancer cells and obtain a faster diagnosis. However, the similarity of images in histopathological breast cancer image analysis is a sensitive and difficult process that requires high competence for field experts. In recent years, researchers have been seeking solutions to this process using machine learning and deep learning methods, which have contributed to significant developments in medical diagnosis and image analysis. In this study, a hybrid DCNN + ReliefF is proposed for the classification of breast cancer histopathological images, utilizing the activation properties of pre-trained deep convolutional neural network (DCNN) models, and the dimension-reduction-based ReliefF feature selective algorithm. The model is based on a fine-tuned transfer-learning technique for fully connected layers. In addition, the models were compared to the k-nearest neighbor (kNN), naive Bayes (NB), and support vector machine (SVM) machine learning approaches. The performance of each feature extractor and classifier combination was analyzed using the sensitivity, precision, F1-Score, and ROC curves. The proposed hybrid model was trained separately at different magnifications using the BreakHis dataset. The results show that the model is an efficient classification model with up to 97.8% (AUC) accuracy.
breast cancer, convolutional neural network, deep learning, feature selection, ReliefF, transfer learning
Breast cancer, which is the second most diagnosed cancer in the world after lung cancer, is the most common type of cancer in women. As of 2012, breast cancer, which is responsible for 15% of deaths, is the leading cancer-related death among women. Insufficient numbers of pathologists play an important role in this situation. While there were 5.7 pathologists per 100.000 people in America in 2013, this number was 1.56 in Turkey in 2011 [1]. The best preventive method against breast cancer is early and accurate diagnosis. However, the examination and diagnosis of breast cancer histopathological images by field experts is a time-consuming and sensitive process that requires high proficiency. The diagnostic process can be supported using existing technological tools and software. Thus, the cost and diagnostic effort can be reduced significantly [2]. Therefore, medical scientists often resort to different radiological and microscopic imaging methods to identify and classify different breast tissues [3]. Some of the main problems in studies on classification of breast cancer histopathological images with machine learning methods are the similarities between classes, in other words, the amplitudes of transition between images and the difficulty of training large data groups draw attention. Deep learning architectures that overcome such challenges have grown in popularity from day to day [4]. Hence, understanding more accurate during the analysis of biopsy images and automatic revealing of stronger features in detecting possible unhealthy tissues, have made deep learning methods more significant in computer-aided diagnosis systems. Deep learning architectures include a combination of different types of layers, such as fully connected, convolutional, and recurrent networks. Training deep neural networks with millions of parameters requires large amounts of data and high computational resources. Researchers have tried to overcome these problems by fine-tuning the pre-trained networks according to the desired task area [5, 6].
Transfer learning is a machine learning technique that uses knowledge or patterns learned from a particular field or task for different but related fields and problems [7]. Transfer learning allows us to obtain new models that perform better and learn faster with less training data. On the other hand, the high similarity between classes between breast cancer histopathological images, uneven distribution in the dataset and some features not related to classification do not give the desired performance.
In this study, a hybrid deep learning approach is proposed for the classification of breast cancer histopathological images using the feature-selective RelieF algorithm based on dimension reduction.
The proposed model is based on a fine-tuned transfer learning technique in fully connected layers. As a result of our literature research, there is no study conducted with the hybrid model we recommend for the classification of breast cancer histopathological images.
When the results are examined, it has been reported that the hybrid method recommended in classifying breast cancer histopathological images is more successful than other machine learning methods. The rest of this article is organized as follows. A literature review that places the research in the field is given in Section 2. The material and method are described in Section 3. Experimental results and discussion are presented in Section 4. Lastly, the main results and future research directions are discussed in Section 5.
Xu et al. [8] proposed the Stacked Sparse Autoencoder model, which is an example of a deep learning strategy for effective kernel detection on histopathological images of breast cancer. This model is based solely on pixel densities to describe the distinctive features of kernels. The features obtained through the autoencoder were divided into two classes and achieved 84.49% success. Spanhol et al. [9] They classified cancer cells using deep learning techniques on breast histopathological images with different magnification factors. The proposed model achieved up to 90% performance on the BreakHis dataset [10]. George and Sankaran [11]. They proposed a CNN methodology using core feature extraction (NucDeep) for breast cancer detection over the BreakHis dataset. The main purpose of NucDeep is to reduce complexity in feature extraction. A feature collection approach with SVM is used to classify the extracted features. The proposed model achieved an average recognition rate of 96.66% ± 0.77% and a sensitivity of 96.21% on the BreaKHis dataset. Bejnordi et al. [12] contrast the findings of deep learning-based systems to the results of metastases found in the clinic. They stated that pathologists misdiagnosed 27.6% of the metastases, while the CNNs had a better diagnostic result. Chang et al. [13] classified the histopathological images of breast cancer using Google's Inception v3 model with the transfer learning technique. They obtained an accuracy of 0.83 for the benign class and 0.89 for the malign class by retraining the BreakHis dataset with Google Inception v3 model. Nahid et al. [14] proposed a combination of the Convolutional Neural Network (CNN) network and the Long-Short-Term-Memory (LSTM) to classify breast cancer images. They used the softmax and support vector machine (SVM) layers separately in the decision-making phase. In this model that they proposed, they reached an accuracy value of 91%. Saha et al. [15] They proposed a model using handcrafted deep learning architecture to detect mytosis from histopathological WSI images. Deep learning architecture basically consists of five convolutions. The model uses its morphological, tissual, and density features in images. The success of the proposed model is 90%. Using a DCNN and Haar wavelet decomposed images. Kumar et al. [16] using the BreakHis dataset, proposed a model based on Vgg16. They reported the performance of the model with different classifiers. They also investigated the effect of data augmentation on the performance of the proposed framework. For binary classification with support vector machines, it achieved 97% success for 200x magnification factor. Vo et al. [17] he proposed a method for breast cancer classification using deep learning methodologies. This deep learning model uses a new enhancement technique over other handcrafted feature extraction methods to extract more features. Yang et al. [18] They fine-tuned the pre-trained DenseNet-161, ResNet-152 and ResNet-101 and combined these three models. They trained test patches augmented at each scale in the combined model. The proposed EMS-Net model achieved 91.75% accuracy over four hundred training image sets. Gupta and Chawla [19] performed automatic classification of breast cancer images using a pre-trained ResNet50 network. They separately compared SVM and Logistic Regression (LR) layers in the network's decision-making phase. In this experiment, where 80% of the dataset is reserved for training and 20% for the test phase, it shows that the ResNet50 network has reached the maximum accuracy for LR compared to SVM. Wahab and Khan [20]. proposed a hybrid descriptive system. The main components of this system (CABCDS) are: A ROI-Selection, Hybrid-Descriptor, MF-CNN, and WSI-Scorer. They achieved high performance (95% CI) [0.478, 0.686], Kappa (0.582) in this system based on mitotic counting. Li et al. [21], proposed a new framework for histopathological image classification that includes discriminant learning and mutual knowledge-based multi-channel learning. The model uses a spatial pyramid matching (SPM) model and a linear support vector machine (SVM). It achieved success rate of 0.903 ± 0.0201 - 0.840 ± 0.0053 on ADL and BreakHis datasets, respectively.
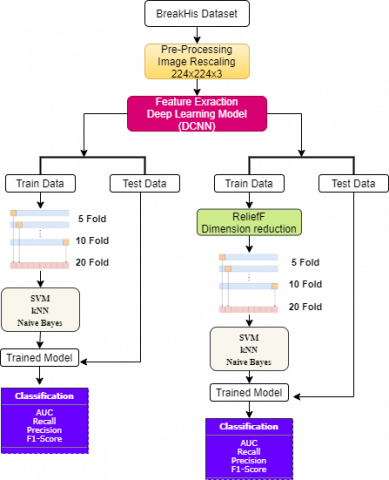
The proposed breast cancer diagnosis model is DCNN-based and consists of SVM layer to classify the final stage input images of the model, based on feature selection and dimension reduction ReliefF algorithm. The entire flow of the DCNN-ReliefF hybrid model includes four steps: image preprocessing, feature extraction, dimension reduction, and diagnosis based on the hybrid model. Figure 2 shows the flow diagram of the hybrid model. The models share the same input structure of the BreakHis [10] dataset in RGB format with the dimension of 700x460x3, which is placed on the network by applying an average filter of 224x224x3. Figure 1 shows an example of malignant breast tumor seen at different magnification factors of the same image from the BreakHis dataset. He highlighted rectangle has been manually added for clarification purposes only. K-fold cross validation was used to evaluate the methods used in the experiments. Training and test datasets groups with 40x, 100x, 200x, 400x magnification were trained in 5, 10 and 20-fold cross validation sections.
The performance of each feature extractor and classifier combination was compared using the Sensitivity, Precision, F1-Score, and ROC curves.
Figure 1. The appearance of a malignant breast tumor sample in different magnification factors. (a) 40X, (b) 100X, (c) 200X and (d) 400X
Figure 2. The flow diagram of hybrid model
3.1 Dataset
Table 1. Image distribution of BreakHis dataset by magnification factor of 40x, 100x, 200x, 400x
|
Magnification |
Benign |
Malignant |
Total |
|
40X |
625 |
1370 |
1995 |
|
100X |
644 |
1437 |
2081 |
|
200X |
623 |
1.390 |
2013 |
|
400X |
588 |
1232 |
1820 |
|
#Total |
2480 |
5429 |
7909 |
Figure 3. BreakHis dataset cluster images– the first line for “benign” samples, the second line for “malignant” samples [10, 22]
In this section, the BreakHis dataset used in the experimental study is explained [10]. BreaKHis is a public dataset of microscopic biopsy images of benign and malignant breast tumors. Histopathologically benign tumors are lesions that do not overlap with any malignancy criteria [9]. Benign tumors are relatively innocent and slow-growing ones. Both tumor samples are shown in Figure 3. This dataset has been collected in collaboration with P & D Laboratory - Pathologic Anatomy and Sitopatology Parana Brasilia [10, 22]. The diagnosis of each case was established by experienced pathologists and confirmed by examinations. BreakHis histopathological dataset, 2480 benign and 5429 malignant histopathological images were obtained using different magnification factors of 40x, 100x, 200x, and 400x, collected from 82 patients. Images are displayed 700x460 pixels,RGB color space. 8 bytes deep png format. The image distribution is summarized in Table 1.
3.2 ReliefF
The Relief algorithm is an algorithm developed by Kira and Rendell [23, 24] that adopts the filter method approach to feature selection. The algorithm was originally designed for application to binary classification problems.
Relief algorithms are general and successful feature estimators. It provides a unified view for feature prediction by detecting conditional dependencies between features [25]. The main idea behind relief algorithms is to predict the quality of the features based on how well the features can distinguish between close samples [25]. Relief algorithms are one of the most successful preprocessing algorithms with a feature subset selection method, which is mostly applied in a preprocessing step before the model is learned. Indeed, these are general feature estimators and have been used successfully in a variety of platforms [25]. The basic working principle of the relief algorithm is to set the weights to zero at the beginning. When determining the weight of a particular feature, in close samples in the same class, if that feature is more different from the features of the other class, the weight decreases, or if it is less different, the weight increases [26]. Distance calculation is formulated for binary values in Eq. (1). Here I1 and I2 are two different samples for the A feature in the sample space. ReliefF calculation equation is given in Eq. (2) [27].
$\operatorname{diff}\left(A, I_{1}, I_{2}\right)= \begin{cases}0, & I_{1}=I_{2} \\ 1, & I_{1} \neq I_{2}\end{cases}$ (1)
$S_{i}=\frac{\sum_{j=1}^{m}-\operatorname{diff}\left(X_{i j}, H_{i j}\right)+\operatorname{diff}\left(X_{i j}, M_{i j}\right)}{m}$ (2)
In Eq. (2), $m$ indicates the number of samples in the dataset, diff $(X i j, H i j)$ indicates the distance of the feature $i$ in sample $j$ from the closest sample with the same class, $\operatorname{diff}(X i j, M i j)$ indicates the distance of the feature $i$ in sample $j$ from the closest sample with different classes, $S_{i}$ on the other hand, indicates the ReliefF value of the feature $i$.
3.3 Support vector machine
Support vector machine (SVM) proposed by Vapnik for binary classification on linearly separable data [28, 29]. The SVM classifier adopts the strategy of finding an optimal hyperplane with maximum margin between classes. The optimal hyperplane not only separates the two classes, but also determines the margin between the two classes. The larger the margin, the lower the generalization error. Maximum margin formula is shown in Eq. (3).
$f\left(x_{i}\right)=\operatorname{sign}\left(w^{T} x_{i}+b\right)$ (3)
In Eq. (3), w the weight vector of the multi-plane, b bias, yi, i class of data point (+1 or -1), Xi, i data point. The functional margin of Xi is calculated as: yi(wTxi + b). In calculating the geometric margin, the distance to the separator plane (r) is calculated in Eq. (4). Here, the expression ||w|| is the Euclidean form of w.
$r=y \frac{w^{T} x+b}{\|w\|}$ (4)
However, sometimes the data cannot be separated linearly; in this case, soft thresholding has been introduced and the restriction Eq. (5) has been redefined. In Eq. (5), W represents the weights of the class, δ represents the slack variable. C is the regularization parameter for SVM [19].
$\frac{1}{2}\|w\|^{2}+C\left(\sum_{i} \delta^{(i)}\right)$ (5)
We use the SVM classifier and the kernel functions in Table 2 in order to classify breast cancer histopathological images, as it uses kernel number to transform nonlinearly separable data into linearly separable data.
Table 2. Kernel functions for the SVM classifier
|
Kernel |
Functions |
|
Linear |
$k(x, y)=x^{T} y+c$ |
|
Polynomial |
$k(x, y)=\left(a x^{T} y+c\right)^{d}$ |
|
RBF |
$k(x, y)=\exp \left(-\sigma\|x-y\|^{2}\right)$ |
Kernel is a function that converts the feature space to a new feature space in the margin hyperplane and allows it to model. The hyperplane kernel functions used in our study for classification include Linear, Polynomial, and RBF kernel as indicated in Table 2. Among the parameters used, σ controls kernel dimension, d polynomial degree, and C invariant controls the correct classification of the hyperplane and data.
3.4 The proposed hybrid model of DCNN-ReliefF
The aim of this article is to present a new hybrid model using DCNN and dimension reduction-based ReliefF algorithm for breast cancer diagnosis based on histopathological images. The distinctive features obtained from the proposed DCNN model were used. The most efficient features suitable for the plant area of the model were determined using ReliefF to increase the diagnostic accuracy. ReliefF is to predict the quality of features based on how well the features can distinguish between closely related samples [25]. In this regard, ReliefF can serve to select a subset of features and its use can make the classifier system more effective. Recently, some studies in the literature have used data mining feature selection algorithms as a feature selection technique for classifying medical images. Ghosh et al. [30] classified the microarray dataset using the multilayer perceptron (MLP), SVM, and kNN algorithm. They compared the strengths of various feature selection algorithms and the weaknesses of their methods, evaluating the accuracy of binary and multiple classes. In the similarity-based methods category, ReliefF performed best. Zhang et al. [31] made breast cancer classification using AdaBoost algorithm and principal component analysis (PCA) algorithm with gene expression data. Mohammedhasan and Uğuz [32] proposed a new strategy for the diagnosis of diabetic retinopathy (DR) using convolutional neural networks (CNNs). They reported that the proposed RUnet-PCA model, together with the PCA algorithm, which performs dimension reduction to improve diagnostic accuracy, reached a diagnostic accuracy of 98.44%. Kilicarslan et al. [33] proposed hybrid methods using the Relief algorithm to improve the classification accuracy of microarray data. Among the methods applied to three different microarray data, they reached 83.95% classification accuracy. In this section, we present the structure of the deep convolutional neural network model used in our method.
Table 3. Detailed parameters of each layer
|
Input |
224x224x3 images with zero center normalization |
||
|
conv1_1 |
64 3x3x3 |
stride =1 |
padding =1 |
|
relu1_1 |
ReLU |
ReLU |
|
|
conv1_2 |
64 3x3x64 |
stride =1 |
padding =1 |
|
relu1_2 |
ReLU |
ReLU |
|
|
pool1 |
2x2 |
stride =2 |
padding =0 |
|
conv2_1 |
128 3x3x64 |
stride =1 |
padding =1 |
|
relu2_1 |
ReLU |
ReLU |
|
|
conv2_2 |
128 3x3x128 |
stride =1 |
padding =1 |
|
relu2_2 |
ReLU |
ReLU |
|
|
pool2 |
2x2 |
stride =2 |
padding =0 |
|
conv3_1 |
256 3x3x128 |
stride =1 |
padding =1 |
|
relu3_1 |
ReLU |
ReLU |
|
|
conv3_2 |
256 3x3x256 |
stride =1 |
padding =1 |
|
relu3_2 |
ReLU |
ReLU |
|
|
conv3_3 |
256 3x3x256 |
stride =1 |
padding =1 |
|
relu3_3 |
ReLU |
ReLU |
|
|
pool3 |
2x2 |
stride =2 |
padding =0 |
|
conv4_1 |
512 3x3x256 |
stride =1 |
padding =1 |
|
relu4_1 |
ReLU |
ReLU |
|
|
conv4_2 |
512 3x3x512 |
stride =1 |
padding =1 |
|
relu4_2 |
ReLU |
ReLU |
|
|
conv4_3 |
512 3x3x512 |
stride =1 |
padding =1 |
|
relu4_3 |
ReLU |
ReLU |
|
|
pool4 |
2x2 |
stride =2 |
padding =0 |
|
conv5_1 |
512 3x3x512 |
stride =1 |
padding =1 |
|
relu5_1 |
ReLU |
ReLU |
|
|
conv5_2 |
512 3x3x512 |
stride =1 |
padding =1 |
|
relu5_2 |
ReLU |
ReLU |
|
|
conv5_3 |
512 3x3x512 |
stride =1 |
padding =1 |
|
relu5_3 |
ReLU |
ReLU |
|
|
pool5 |
2x2 |
stride =2 |
padding =0 |
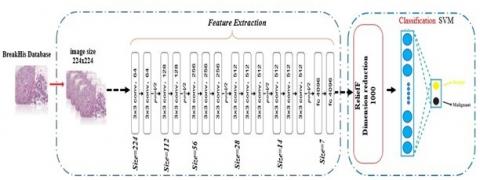
Recommended hybrid model uses fine-tuned Vgg16 network [34]. The Vgg16 network are DCNNs for image recognition proposed by the Visual Geometry Group of Oxford University [34]. They are 16 layers deep and trained on the ImageNet dataset. The input dimension of the model is 224x224x3 pixel images. As shown in Table 3, the images pass through conv1_1 and con1_2 convolution layers of filters with a small receiving area (3x3). The (3 × 3) filter here is the smallest dimension to capture the center concept. It uses (ReLU) activation between these two convolutional layers, which can be seen as a linear transformation of their channels, and the convolution steps are fixed at 1 pixel. Following these two layers is a pool layer that reduces the height and width of the image to 112x112x64. However, after all return layers, maximum pooling does not follow. Maximum pooling is performed on a (2 × 2) pixel window. The dimensions of the input state feature vectors in each layer used in the model are shown in detail in Table 3. Furthermore, the number of layers used in each stage, the number of filters used, filling, and step parameters are clearly shown as well. The DCNN network lastly continues with three fully connected layers fc6, fc7, fc8. The first two layers each have 4096 channels, the fc8 layer contains 1000 channels. The approach we propose is based on the fine-tuned transfer learning technique in the last layer of fully connected layers.
By using the activations of the fully connected fc7 layer of the network, attributes of 4096 channels are strengthened with the ReliefF algorithm, and an output layer with 1000 nodes integrated with the ReliefF algorithm is obtained. SVM is used as the activation function of the output layer. Figure 4 shows the link-based block diagram of the proposed hybrid (DCNN-ReliefF+SVM) model for automatic classification of breast cancer histopathological images.
Figure 4. Block diagram of the proposed hybrid model for automatic classification of breast cancer histopathological images
In this section, the parameters of the proposed hybrid method are shown according to the experimental results. In addition, the results of other experimental studies are presented. In the study, experiments were conducted with dimension reduction-based hybrid models for cancer diagnosis based on breast cancer histopathological images using the BreakHis dataset. Models consist of deep learning methodologies, ReliefF algorithm, and machine learning algorithms. ReliefF algorithm was used for dimension reduction. For classification, SVM, kNN, NB methods are separately trained according to 40x, 100x, 200x, 400x magnification factors. A summary of the parameters used in the models is shown in Table 4.
Table 4. Summary of all the parameters used in the models
|
DCNN Models |
VGG16 |
VGG19 |
|
Input layer |
(224, 224, 3) |
(224, 224, 3) |
|
Output shape |
(7,7,512) |
(7,7,512) |
|
Number of training epochs |
2000,5000 |
2000,5000 |
|
Param # |
14714688 |
20024384 |
|
Total params |
14,715,714 |
20,025,410 |
|
Non-trainable params |
14,714,688 |
20,024,384 |
4.1 Performans metric
In cases where there are unbalanced datasets, one of the metrics used to evaluate the performance of artificial intelligence algorithms is the receiver operating characteristic ROC (AUC) analysis. And it explains how well the model is at its prediction. The area under the ROC curve is the AUC value and each point on the curve corresponds to a threshold. A high AUC value indicates a high classification performance of the trained model [35].
The transverse axis of the ROC curve is True Positive Rate (TPR) and its longitudinal axis is False Positive Rate (FPR). Calculation formulas in Eq. (6) and Eq. (7) are as follows:
TPR= TP/(TP+FN) (6)
FPR = FP/(FP+TN) (7)
There are four cases in the classification problem.True positive (TP), false positive (FP), false negative (FN), true negative(TN). Sensitivity of a classifier is the rate between how much is correctly defined positively and how actually positive it is. Precision, on the other hand, shows how many of the values we predicted as positive are actually positive. F1-Score is a measurement metric that includes all error costs. Sensitivity, Precision, F1-Score calculation formulas Eq. (8), Eq. (9) and Eq. (10) are as follows.
Sensitivity = TP/(TP+FN) (8)
Precision = TP/(TP+FP) (9)
F1-Score $=2 x \frac{\text { precision } * \text { recall }}{\text { precision }+\text { recall }}$ (10)
In order to classify the BreakHis histopathological dataset, along with ReliefF, which is a dimensional reduction technique, and a deep learning model based on the fine-tuned transfer learning technique were used in the final fully connected layers. The main idea of using the dimension reduction technique (ReliefF) is to increase the accuracy of the classifier.
The proposed model has achieved the highest classification accuracy among kNN and NB classifiers according to 40x, 100x, 200x, and 400x magnification factors. Table 5 summarizes the performance (AUC) analysis of the proposed hybrid model on the BreakHis dataset.
From these results, it has been shown that our proposed approach (DCNN+ ReliefF+SVM) is a fair and secure system corresponding to the medical diagnosis decision making process. In the study, a series of experiments were carried out with 5-fold, 10-fold, and 20-fold training sets. In these experiments, training sets were changed according to different magnification factors (40x, 100x, 200x, 400x) fed into the network. The results show that the best performance reaches 97.8% classification accuracy with 20-fold cross validation.
Table 5. Performance of the proposed hybrid model in different classifiers according to 40x, 100x, 200x, 400x magnifications
|
|
40X |
100X |
200X |
400X |
|
|
Hybrid Models |
Fold |
AUC |
AUC |
AUC |
AUC |
|
DCNN ReliefF SVM |
5 |
0,972 |
0,970 |
0,971 |
0,958 |
|
10 |
0,976 |
0,972 |
0,972 |
0,960 |
|
|
20 |
0,978 |
0,973 |
0,973 |
0,960 |
|
|
Mean |
0,975 |
0,971 |
0,972 |
0,959 |
|
|
DCNN ReliefF kNN |
5 |
0,939 |
0,946 |
0,943 |
0,909 |
|
10 |
0,944 |
0,944 |
0,947 |
0,917 |
|
|
20 |
0,945 |
0,950 |
0,950 |
0,918 |
|
|
Mean |
0,942 |
0,946 |
0,946 |
0,914 |
|
|
DCNN ReliefF NB |
5 |
0,859 |
0,856 |
0,871 |
0,857 |
|
10 |
0,860 |
0,857 |
0,873 |
0,857 |
|
|
20 |
0,860 |
0,856 |
0,871 |
0,857 |
|
|
Mean |
0,859 |
0,856 |
0,871 |
0,857 |
* Bold values signify the highest values of hybrid model
Table 6 shows that the proposed model achieved 93.4% Sensitivity, 93.3% F1-score, and 93.5% Precision with 20-fold cross validation. In this study, there were two classes, benign and malignant, indicating the status of breast cancer disease. The classification results of the proposed hybrid model are visualized using a confusion matrix.
In the confusion matrix, it contains the number of values of the test set classified for the corresponding combination of desired and actual network outputs. Since the relationship between classification results and actual results can be observed, the effectiveness of classification problems can be measured with a confusion matrix.
Table 6. F1-Score, Precision, Sensitivity values in different classifiers according to 40x, 100x, 200x, 400x magnification of the proposed hybrid model
|
|
|
F1-score |
Precision |
Sensitivity |
|
|
SVM |
0,92 |
0,93 |
0,92 |
|
40x |
kNN |
0,90 |
0,90 |
0,90 |
|
|
NB |
0,79 |
0,81 |
0,78 |
|
|
SVM |
0,92 |
0,93 |
0,93 |
|
100x |
kNN |
0,90 |
0,90 |
0,90 |
|
|
NB |
0,80 |
0,82 |
0,80 |
|
|
SVM |
0,93 |
0,93 |
0,93 |
|
200x |
kNN |
0,91 |
0,91 |
0,91 |
|
|
NB |
0,81 |
0,83 |
0,81 |
|
|
SVM |
0,90 |
0,91 |
0,90 |
|
400x |
kNN |
0,86 |
0,86 |
0,86 |
|
|
NB |
0,80 |
0,81 |
0,80 |
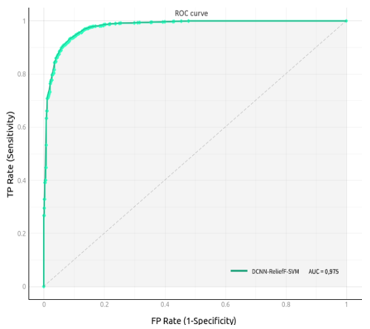
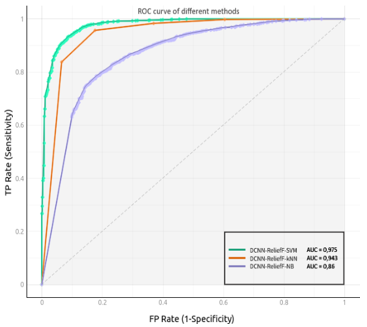
Table 7 shows the confusion matrix of a two-class classification problem according to the 40x magnification factor of the proposed hybrid model. ReliefF's proposed deep learning-based model has shown very promising results in breast cancer diagnosis. Figure 5 shows ROC curve of the proposed hybrid model. In Figure 6, the comparative ROC curve of the hybrid models created with SVM, kNN, and NB classifiers is shown.
Table 7. Confusion matrix for test data according to the 40x magnification factor of the proposed hybrid model
|
Confusion matrix |
Benign |
Malign |
|
Benign |
528 |
97 |
|
Malign |
33 |
1337 |
We trained and tested the model proposed in Table 8 in order to prove its effectiveness with the ReliefF algorithm. ReliefF algorithm has strengthened the performance in all models trained with SVM, kNN, NB classifiers according to 40x, 100x, 200x, 400x magnification factors. For a fair evaluation, we trained and compared the performance of other deep learning architectures and combinations with the same datasets. The other architecture we use with the transfer learning technique in the study is the Vgg19 deep learning network.
Figure 5. ROC curve of the proposed hybrid model
Figure 6. ROC curves of different methods
This model differs with the Vgg16 network only in the last three convolution blocks. The Vgg16 network consists of thirteen convolution layers while the Vgg19 network consists of sixteen convolution layers. Both deep learning models contain three fully connected layers. These differences enabled us to compare the models we trained on a block basis.
Hence, Vgg19 network trained with fine-tuned transfer learning strategy was tested. In Table 8, the classification accuracy (AUC) of the Vgg19 model on the BreakHis dataset is 97.1% according to the 40x magnification factor, 96% according to the 100x magnification factor, 97.5% according to the 200x magnification factor, and 95.6% according to the 400x magnification factor.
Table 8. Performance impact of dimension reduction algorithm on hybrid models
|
|
|
|
40X |
100X |
200X |
400X |
|
Models |
Method |
ReliefF |
AUC |
AUC |
AUC |
AUC |
|
DCNN |
SVM |
√ |
0,975 |
0,972 |
0,972 |
0,959 |
|
kNN |
0,943 |
0,947 |
0,947 |
0,915 |
||
|
NB |
0,860 |
0,856 |
0,872 |
0,857 |
||
|
VGG19 |
SVM |
√ |
0,971 |
0,966 |
0,975 |
0,956 |
|
kNN |
0,943 |
0,922 |
0,935 |
0,917 |
||
|
NB |
0,866 |
0,848 |
0,851 |
0,859 |
||
|
VGG16 |
SVM |
0,961 |
0,955 |
0,958 |
0,946 |
|
|
kNN |
- |
0,931 |
0,938 |
0,943 |
0,904 |
|
|
NB |
0,828 |
0,833 |
0,836 |
0,831 |
||
|
VGG19 |
SVM |
0,957 |
0,950 |
0,956 |
0,935 |
|
|
kNN |
- |
0,944 |
0,915 |
0,924 |
0,908 |
|
|
NB |
0,833 |
0,825 |
0,823 |
0,821 |
The classification results show that the last three convolution blocks of the Vgg19 network have no effect on the redundancy classification performance, and the ReliefF algorithm improves the performance in all trained models. Our proposed hybrid model (DCNN+ReliefF+SVM) achieved better diagnostic results than other models. The per-class accuracy performances for the proposed DCNN hybrid model and the performances of the other models according to four magnification factors are reported in Figure 7.
Figure 7. Comparison of model performances
We compare our study with some literature studies. Spanhol et al. [36] evaluated the combination of DeCAF features from the layers with a pre-trained CNN. With the BreakHis dataset, they achieved an accuracy of up to 84.8 ± 4.2% and an F-measure of 88% in binary classification. Wei et al. [37] achieved classification accuracy up to 97% with the model they developed by taking into account the Deep CNN model based on the transfer learning technique, the BreakHis dataset, and the class and sub-class tags. Nahid et al. [14] proposed a new model for breast cancer image classification using CNN and LSTM. They reached the best accuracy value of 91% and a precision value of 96% according to the 200x magnification factor by using softmax and SVM layers in the decision-making phase of their proposed DNN models. Shallu and Mehra [38] analyzed the Vgg16, Vgg19, and ResNet50 networks with the transfer learning method, using the BreakHis dataset for breast cancer classification, independent of magnification. With the Vgg16 network, for 90%-10% training-test data, the Vgg16 network provided 92.6% accuracy, 95.65% area under the ROC curve (AUC) the best performance. Zhang et al. [39] achieved a classification accuracy of 95.7% using a fine-tuned Inception-v3 model with the BreakHis dataset. Bardou et al. [40] have proposed two different approaches the first approach relies on extracting a set of handcrafted features trained by SVM, while the second approach relies on CNNs. In order to improve the accuracy of the convolution neural network, they tested dataset augmentation techniques They use dataset augmentation techniques to increase the accuracy of CNN. They also compared various classifier configurations. They reported that convolutional neural networks performed better than a handcrafted feature-based classifier as a result. They achieved accuracy between 96.15% for binary classification and between 88.23% for multi-class classification.
In our approach, our classification results generally outperform other studies in terms of Sensitivity, Precision, F1-Score, and AUC values. Moreover, the model we propose assists to make a diagnosis faster, as well as shorten the decision-making process. Our target data are also more domain specific, increasing the accuracy of the pathological diagnosis and greatly helping to avoid over-fitting the model.
Breast cancer is the most common type of cancer in the world, especially seen in women, and results in death in patients who cannot be treated early. Therefore, the accuracy of the pathological diagnosis is of great importance in order to minimize the undetected cancer cells and shorten the early diagnosis process. However, the similarity of the images in histopathological breast cancer image analysis is a sensitive and difficult process that requires high competence for the field experts. This process can be supported by using computer-aided technological tools and software. In this research article, we proposed a hybrid method (DCNN+ReliefF+SVM) with the ReliefF feature selector algorithm based on dimension reduction, utilizing the activation features of pre-trained DCNN models for the classification of breast cancer histopathological images. The model is based on a fine-tuned transfer learning technique in fully connected layers. It uses the RelifF algorithm to improve performance.
The proposed hybrid model has been separately trained for different magnifications using the BreakHis dataset. We prepared training and test sets in three different sections 5, 10, and 20-fold using the k-fold cross validation method in order to evaluate the results fairly. The proposed approach was compared with the kNN, NB, and SVM machine learning algorithms, and the performance of each of the feature extractor and classifier combinations was analyzed using Sensitivity, Precision, F1-Score, and ROC curves. The results show that the proposed hybrid model achieves an effective classification performance of 97.8% - 97.3% - 97.3% - 96% according to the four magnification factors (40x, 100x, 200x and 400x), respectively. In our next studies, we will examine image resolution enhancement techniques, contrast normalization, data enhancement methods, and the effects of different feature selection algorithms.
[1] Robboy, S.J., Weintraub, S., Horvath, A.E., et al. (2013). Pathologist workforce in the United States: I. Development of a predictive model to examine factors influencing supply. Archives of Pathology and Laboratory Medicine, 137(12): 1723-1732. https://doi.org/10.18280/ijht.350401
[2] Toğaçar, M., Özkurt, K.B., Ergen, B., Cömert, Z. (2020). BreastNet: A novel convolutional neural network model through histopathological images for the diagnosis of breast cancer. Physica A: Statistical Mechanics and its Applications, 545: 123592. https://doi.org/10.1016/j.physa.2019.123592
[3] Tariq, M., Iqbal, S., Ayesha, H., Abbas, I., Ahmad, K.T., Niazi, M.F.K. (2021). Medical image based breast cancer diagnosis: State of the art and future directions. Expert Systems with Applications, 167: 114095. https://doi.org/10.1016/j.eswa.2020.114095
[4] LeCun, Y., Bengio, Y., Hinton, G. (2015). Deep learning. Nature, 521(7553): 436-444. https://doi.org/10.1038/nature14539
[5] Zhou, B., Lapedriza, A., Xiao, J., Torralba, A., Oliva, A. (2014). Learning deep features for scene recognition using places database. Advances in Neural Information Processing Systems, pp. 487-495.
[6] Wang, L., Xiong, Y., Wang, Z., Qiao, Y. (2015). Towards good practices for very deep two-stream convnets. arXiv preprint arXiv:1507.02159.
[7] Pan, S.J., Yang, Q. (2009). A survey on transfer learning. IEEE Transactions on Knowledge and Data Engineering. 22(10): 1345. https://doi.org/10.1109/TKDE.2009.191
[8] Xu, J., Xiang, L., Liu, Q., Gilmore, H., Wu, J., Tang, J., Madabhushi, A. (2015). Stacked sparse autoencoder (SSAE) for nuclei detection on breast cancer histopathology images. IEEE Transactions on Medical Imaging, 35(1): 119-130. https://doi.org/10.1109/TMI.2015.2458702
[9] Spanhol, F.A., Oliveira, L.S., Petitjean, C., Heutte, L. (2016). Breast cancer histopathological image classification using convolutional neural networks. In 2016 International Joint Conference on Neural Networks (IJCNN), pp. 2560-2567. https://doi.org/10.1109/IJCNN.2016.7727519
[10] Spanhol, F.A., Oliveira, L.S., Petitjean, C., Heutte, L. (2015). A dataset for breast cancer histopathological image classification. IEEE Transactions on Biomedical Engineering, 63(7): 1455-1462. https://doi.org/10.1109/TBME.2015.2496264
[11] George, K., Sankaran, P. (2020). Computer assisted recognition of breast cancer in biopsy images via fusion of nucleus-guided deep convolutional features. Computer Methods and Programs in Biomedicine, 194: 105531. tps://doi.org/10.1016/j.cmpb.2020.105531
[12] Bejnordi, B.E., Veta, M., Van Diest, P.J., et al. (2017). Diagnostic assessment of deep learning algorithms for detection of lymph node metastases in women with breast cancer. Jama, 318(22): 2199-2210. https://doi.org/10.1001/jama.2017.14585
[13] Chang, J., Yu, J., Han, T., Chang, H.J., Park, E. (2017). A method for classifying medical images using transfer learning: A pilot study on histopathology of breast cancer. In 2017 IEEE 19th International Conference on e-Health Networking, Applications and Services (Healthcom), pp. 1-4. https://doi.org/10.1109/HealthCom.2017.8210843
[14] Nahid, A.A., Mehrabi, M.A., Kong, Y. (2018). Histopathological breast cancer image classification by deep neural network techniques guided by local clustering. BioMed Research International, 2018: 2362108. https://doi.org/10.1155/2018/2362108
[15] Saha, M., Chakraborty, C., Racoceanu, D. (2018). Efficient deep learning model for mitosis detection using breast histopathology images. Computerized Medical Imaging and Graphics, 64: 29-40. https://doi.org/10.1016/j.compmedimag.2017.12.001
[16] Kumar, A., Singh, S.K., Saxena, S., et al. (2020). Deep feature learning for histopathological image classification of canine mammary tumors and human breast cancer. Information Sciences, 508: 405-421. https://doi.org/10.1016/j.ins.2019.08.072
[17] Vo, D.M., Nguyen, N.Q., Lee, S.W. (2019). Classification of breast cancer histology images using incremental boosting convolution networks. Information Sciences, 482: 123-138. https://doi.org/10.1016/j.ins.2018.12.089
[18] Yang, Z., Ran, L., Zhang, S., Xia, Y., Zhang, Y. (2019). EMS-Net: Ensemble of multiscale convolutional neural networks for classification of breast cancer histology images. Neurocomputing, 366: 46-53. https://doi.org/10.1016/j.neucom.2019.07.080
[19] Gupta, K., Chawla, N. (2020). Analysis of histopathological images for prediction of breast cancer using traditional classifiers with pre-trained CNN. Procedia Computer Science, 167: 878-889 https://doi.org/10.1016/j.procs.2020.03.427
[20] Wahab, N., Khan, A. (2020). Multifaceted fused-CNN based scoring of breast cancer whole-slide histopathology images. Applied Soft Computing, 97: 106808. https://doi.org/10.1016/j.asoc.2020.106808
[21] Li, X., Tang, H., Zhang, D., Liu, T., Mao, L., Chen, T. (2020). Histopathological image classification through discriminative feature learning and mutual information-based multi-channel joint sparse representation. Journal of Visual Communication and Image Representation, 70: 102799. https://doi.org/10.1016/j.jvcir.2020.102799
[22] Burçak, K.C., Baykan, Ö.K., Uğuz, H. (2021). A new deep convolutional neural network model for classifying breast cancer histopathological images and the hyperparameter optimisation of the proposed model. The Journal of Supercomputing, 77(1): 973-989. https://doi.org/10.1007/s11227-020-03321-y
[23] Kira, K., Rendell, L.A. (1992). The feature selection problem: Traditional methods and a new algorithm. In Aaai, 2(1992): 29-134.
[24] Kira, K., Rendell, L.A. (1992). A practical approach to feature selection. In Machine Learning Proceedings 1992, pp. 249-256. https://doi.org/10.1016/B978-1-55860-247-2.50037-1
[25] Robnik-Šikonja, M., Kononenko, I. (2003). Theoretical and empirical analysis of ReliefF and RReliefF. Machine Learning, 53(1): 23-69. https://doi.org/10.1023/A:1025667309714
[26] Urbanowicz, R.J., Meeker, M., La Cava, W., Olson, R. S., Moore, J.H. (2018). Relief-based feature selection: Introduction and review. Journal of Biomedical Informatics, 85: 189-203. https://doi.org/10.1016/j.jbi.2018.07.014
[27] Gümüşçü, A., Aydilek, İ.B., Taşaltin, R. (2016). Mikro-dizilim veri siniflandirmasinda öznitelik seçme algoritmalarinin karşilaştirilması. Harran Üniversitesi Mühendislik Dergisi, 1(1): 1-7. https://dergipark.org.tr/en/pub/humder/issue/28975/309938.
[28] Vapnik, V. (1999). The Nature of Statistical Learning Theory. Springer Science & Business Media.
[29] Boser, B.E., Guyon, I.M., Vapnik, V.N. (1992). A training algorithm for optimal margin classifiers. In Proceedings of the Fifth Annual Workshop on Computational Learning Theory, pp. 144-152. https://doi.org/10.1145/130385.130401
[30] Ghosh, K.K., Begum, S., Sardar, A., Adhikary, S., Ghosh, M., Kumar, M., Sarkar, R. (2021). Theoretical and empirical analysis of filter ranking methods: Experimental study on benchmark DNA microarray data. Expert Systems with Applications, 169: 114485. https://doi.org/10.1016/j.eswa.2020.114485
[31] Zhang, D., Zou, L., Zhou, X., He, F. (2018). Integrating feature selection and feature extraction methods with deep learning to predict clinical outcome of breast cancer. IEEE Access, 6: 28936-28944. https://doi.org/10.1109/ACCESS.2018.2837654
[32] Mohammedhasan, M., Uğuz, H. (2020). A new early stage diabetic retinopathy diagnosis model using deep convolutional neural networks and principal component analysis. Traitement du Signal, 37(5): 711-722. https://doi.org/10.18280/ts.370503
[33] Kilicarslan, S., Adem, K., Celik, M. (2020). Diagnosis and classification of cancer using hybrid model based on ReliefF and convolutional neural network. Medical Hypotheses, 137: 109577. https://doi.org/10.1016/j.mehy.2020.109577
[34] Simonyan, K., Zisserman, A. (2014). Very deep convolutional networks for large-scale image recognition. arXiv preprint arXiv:1409.1556.
[35] Liu, T., Huang, J., Liao, T., Pu, R., Liu, S., Peng, Y. (2022). A hybrid deep learning model for predicting molecular subtypes of human breast cancer using multimodal data. Irbm, 43(1): 62-74. https://doi.org/10.1016/j.irbm.2020.12.002
[36] Spanhol, F.A., Oliveira, L.S., Cavalin, P.R., Petitjean, C., Heutte, L. (2017). Deep features for breast cancer histopathological image classification. In 2017 IEEE International Conference on Systems, Man, and Cybernetics (SMC), pp. 1868-1873. https://doi.org/10.1109/SMC.2017.8122889
[37] Wei, B., Han, Z., He, X., Yin, Y. (2017). Deep learning model based breast cancer histopathological image classification. In 2017 IEEE 2nd International Conference on Cloud Computing and Big Data Analysis (ICCCBDA), pp. 348-353. https://doi.org/10.1109/ICCCBDA.2017.7951937
[38] Shallu, Mehra, R. (2018). Breast cancer histology images classification: Training from scratch or transfer learning? ICT Express, 4(4): 247-254. https://doi.org/10.1016/j.icte.2018.10.007
[39] Zhang, X., Zhang, T., Feng, W., Lin, C. (2019). Breast cancer diagnosis from histopathological image based on deep learning. In 2019 Chinese Control and Decision Conference (CCDC), pp. 4616-4619. https://doi.org/10.1109/CCDC.2019.8833431
[40] Bardou, D., Zhang, K., Ahmad, S.M. (2018). Classification of breast cancer based on histology images using convolutional neural networks. IEEE Access, 6: 24680-24693. https://doi.org/10.1109/ACCESSS.2018.2831280