Makineni Siddardha Kumar* | Kasukurthi Venkata Rao | Gona Anil Kumar
© 2021 IIETA. This article is published by IIETA and is licensed under the CC BY 4.0 license (http://creativecommons.org/licenses/by/4.0/).
OPEN ACCESS
Lung tumor is a dangerous disease with the most noteworthy effects and causing more deaths around the world. Medical diagnosis of lung tumor growth can essentially lessen the death rate, on the grounds that powerful treatment alternatives firmly rely upon the particular phase of disease. Medical diagnosis considers to the use of innovation in science with the end goal of analyzing the interior structure of the organs of the human body. It is an approach to improve the nature of the patient's life through a progressively exact and fast detection, and with restricted symptoms, prompting a powerful generally treatment methodology. The main goal of the proposed work is to design a Lung Tumor Detection Model using Convolution Neural Networks (LTD-CNN) with machine learning technique that spread both miniaturized scale and full scale image surfaces experienced in Magnetic Resonance Imaging (MRI) and advanced microscopy modalities separately. Image pixels can give critical data on the abnormality of tissue and performs classification for accurate tumor detection. The advancement of Computer-Aided Diagnosing (CAD) helps the doctors and radiologists to analyze the lung disease precisely from CT images in its beginning phase. Different methods are accessible for the lung disease recognition, however numerous methodologies give not so much exactness but rather more fake positives. The proposed method is compared with the traditional models and the results exhibit that the proposed model detects the tumor effectively and more accurately.
lung tumor, pre-processing, feature selection, classification, tumor detection, machine learning
Lung Cancer is the situation of growing of unusual cells which for the most part start in one or the two lungs for the most part in the line of lung regions. Those strange cells never develop to ordinary or lung tissue; their fast creation cause tumors. Lung disease has the second most death rate among different classifications of tumor growth [1]. Much after conclusion it has littlest survival rate, along these lines constantly expanding the death rate yearly. If the tumor growth cells been analysed in its beginning phases ones survival rate increments, so strong models are required to detect lung tumors [2].
Because the normal flow of lymph from the lungs is toward the centre of the chest, the lung tumour spread mostly inside the centre of the chest. Non-Small Cell Lung Cancer and Small Cell Lung Cancer are the most common types [3]. The lung tumour growth kinds are assigned based on the cell characteristics. In general, there are four stages of lung tumour growth: I, II, III, and IV. The stages are determined by the size and location of the tumour, as well as the location of the lymph nodes. MRI pictures are now more helpful in detecting lung malignancies than plain chest x-rays in identifying and diagnosing lung tumours.
A tumour cell is defined by the big six disease symptoms that allow the cell to reproduce, be anti-cell transient, stimulate angiogenesis, escape development suppressors, scatter, attack, and metastasis. The understanding of the hidden genomic, epigenomic [4], and proteomic diverse diversity of a tumour cell behind these changes has expanded dramatically in the last couple of years, thanks to cutting-edge sequencing innovation [5]. Figure 1 depicts the detection of a lung tumour from an MRI scan.
Figure 1. Lung tumor detection from MRI image
This sort of lung disease is unequivocally connected with smoking with a helpless visualization [6]. Because of quick spread of these tumors, patients with SCLC are rarely survived [7]. NSCLC represents around 80% of all lung tumor growths and incorporates three histological subtypes [8]; Adenocarcinoma (AdC), Squamous Cell Carcinoma (SCC), and Large cell carcinoma (LCC). As of late, AdC of the lung has displace SCC as the most regular histologic subtype for the two people. AdC emerges from cells with glandular or secretary properties in the border of the lung.
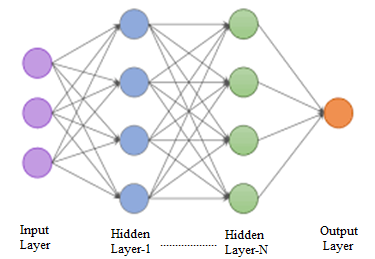
The movements in histological kinds are identified with expanded paces of smoking in ladies and to present day cigarettes that contain higher groupings of specific cancer-causing agents [9]. The most widely recognized signs of lung disease are shortness of breath, insistent weakness, contains blood in sputum, loss of hunger, weight reduction, persistent chest distress and pain in bone/shoulder/neck/arm. Less normal side effects are: roughness of voice, out of breath, trouble in swallowing [10], fever, intensifying in the face/neck/feet and regular cerebral pain/unsteadiness/seizures. The CNN model framework is depicted in Figure 2 that depicts the hidden layers considered from the image pixels for accurate tumor detection.
Figure 2. CNN layer representation
Figure 3. Lung tumor region recognition
Lung tumor growth analysis process relies upon a few issues, for example, clinical history and physical assessment [11]. Distinctive part removed in the end stage. Consistency, availability and position features are regular in the majority of the strategies [12]. The features, for example, size circularity and magnificence of Region of Interests (ROI's) are different features removed and utilized. The subjectivity of the authority is a significant impediment in diagnosing a patient. Subsequently, to upgrade the exactness of analysis, the huge measure of the experimental information resultant information must be computerized and utilized adequately. The lung tumor region detection is depicted in Figure 3.
The image feature is a fundamental headway which addresses the features considered and by using images and techniques relevant features are extracted from an image. The methods take out various features present in an image in the middle of image dealing with. The division is finished first on lung region sought after by feature extraction to get its features [13]. Finally it is appropriate with some assurance rule where the tumor development. Tumors can without a very remarkable stretch be distinguished in the lungs. To have better end, these assurance standards can be used to get rid of tumors happened through clustering methods. Machine learning techniques helps more in accurate identification of lung tumor by training the machine with the types of lung tumors by considering numerous datasets. These systems are intellectual frameworks and phenomenal at perceiving designs however not at clearing up how they show up at the features. The lung tumor detection rate is high during the usage of machine learning techniques.
Tumor growth is the most recognizable disease that influences the humans throughout the world. Early prediction of lung tumor growth has assumed a critical job in the determination procedure and for a powerful preventive methodology. Yan et al. [1] established a system for categorising pneumonic knobs identified on High Resolution Computed Tomography (HRCT) into distinct shapes. The separated knobs from a series of 234 CT images were grouped into several form classes based on quantitative proportions of angle proportion, circularity, and risk prediction. The results are compared to the results of radiologists, revealing that the suggested computerised framework precisely sets the knobs. Their implemented system may assist radiologists in classifying knobs as hazardous or generous based on the relationship between various form classes.
Al-Shabi et al. [7] developed a CAD framework for lung tumour progression based on CT imaging in the early stages. This computation is divided into two parts: an examination component and an analytical part. In the investigation stage, lung regions and pneumonic vein areas were sectioned, and image treatment processes were used to extract a collection of features from these regions. In the analysis section, a set of rules for the standard-based classifier for lump order based on the eliminated characteristics was defined.
A definite report on lung tumor growth determination dependent on fuzzy guidelines was directed by Lakshmanaprabu et al. [11]. The proficiency of their framework was low, on account of their straightforward calculation. Afterward they built up a demonstrative model for the stage wise lung tumor growth identification utilizing improved fuzzy principles. Moreover, it likewise recommends the kind of treatment for the patients. The key attribute of their framework was simpler alteration and refreshing of the database. The CAD model accomplished an affectability of 85% and explicitness of 74%.
Teramoto et al. [13] demonstrated an automated CAD framework for detecting lung anomalies in CT images using deformable layouts. The proposed innovative calculation is based on four distinct types of deformable formats related to lung knob geometry and dim level circulation. They are: 1. a large circular model with classified and unclassified knobs that appear in sequential cuts; and 2. a strong circular model with classified and unclassified knobs that appear in sequential cuts. 2. a large circular replica of empty lung knobs 3. a half circle model of lung divider knobs showing up in a single cut, and 4. a roundabout model of small knobs showing up in a single cut. Each format has a unique dark level example that is rationally examined to fit the available observational data. Variation from the norm location depends on the standardized cross-relationship layout coordinating by genetic improvement and Bayesian post-grouping.
Lung cancer is the major cause of cancerous deaths in the United States and worldwide. In India, it is the foremost cause of deaths in men; and ranked ninth in all cancer related deaths reported in women. Two main types of lung cancer are Small Cell Lung Cancer (SCLC) and Non-Small Cell Lung Cancer (NSCLC). About 15 out of 100 (20%) lung cancers are diagnosed with SCLC. It is aggressive, that is, it often grows rapidly and spreads to other regions, including lymph nodes, bone, brain, adrenal glands, and liver [14].
In the case of clustering, the elements belong to exactly one class and in the case of soft clustering or fuzzy clustering, the elements can belong to more than one class and associated with each element is a set of membership levels [15]. Fuzzy clustering incorporates spatial information into the membership function for clustering and most widely used for image segmentation [16]. The advantages of fuzzy clustering for over conventional clustering methods are: 1. provides more homogeneous regions 2. reduces the false spots 3. removes noisy spots and 4. less sensitive to noise.
Lung Tumor Detection Model using Convolution Neural Networks (LTD-CNN) is an algorithm that utilizes CNN features for the prediction of lung tumor. An objective function for the image is designed for extracting pixels in the image as
$\operatorname{IF} E_{F x, F y}(X, Y)=\sum_{i=1}^{m} \sum_{j=1}^{n}\left(a_{i j}^{x}+b_{i j}^{n}\right) d^{2}\left(m_{j}, t_{i}\right)$ (1)
d is the feature matrix, t is possibility matrix, a,b are the resultant cluster sets, m, n are cluster number and data point number respectively. Based on the extracted features, balancing will be done as
$D_{i j}=\frac{1}{\sum_{k=1}^{c} \cdot\left(\frac{a^{2}\left(m_{j}, d_{i}\right)}{b^{2}\left(n_{j}, d_{k}\right)}\right)^{\frac{2}{(m+n-1)}}}, 1 \leq i \leq m, 1 \leq j \leq n$ (2)
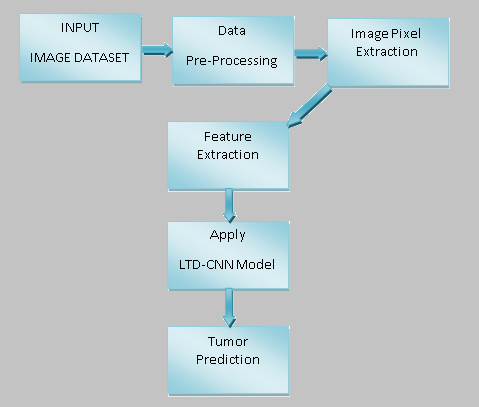
The proposed Lung Tumor Detection model framework is depicted in Figure 4. The proposed model undergoes pre-processing for cleaning the data, then from the image relevant pixels are extracted eliminated the unwanted data and then features are extracted from them for accurate tumor identification.
Figure 4. Proposed framework for tumor prediction
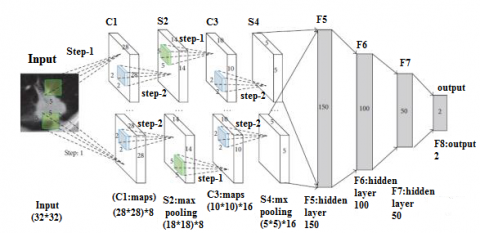
Figure 5. Hidden layer representation for tumor predictions
As CNN model is used, hidden layers are also considered for better tumor prediction. The input to each hidden layer is given by,
$\mathrm{Ih}=I_{o j}+\sum X_{i} * Y_{i j}$ (3)
where, X is the bias value on the hidden layer and Y is the weights between input and hidden layer. Therefore output from each hidden layer is calculated by,
$O h_{i}=\frac{\sum_{j=1}^{n}\left(a_{i j}^{m}+b_{i j}^{n}\right) x_{j}}{\sum_{i=1}^{m}\left(a_{i j}^{m}+b_{i j}^{n}\right)}, 1 \leq i \leq I h$ (4)
The hidden layer represented in CNN is depicted in Figure 5. Each image is deeply analyzed and the tumor cells are accurately predicted. Each hidden layer considers some relevant features and these features place a key task in tumor identification.
For each hidden unit (h), compute the error term e and weight change W between input and hidden layer, which are given by,
$e_{j}=\delta_{i n j} * f^{\prime}\left(W_{i n j}\right)$ (5)
where, $\delta_{i n j}=\sum \delta_{k} * w_{j k}-\mathrm{e}$ (6)
$f^{\prime}\left(z_{\text {in } j}\right)$ is the derivative of $z_{\text {in } j}$ and $\Delta v_{i j}=\alpha * \delta_{j} * x_{i}$ (7)
Update the weights between hidden layer and output layer and the input layer and hidden layer as,
$\mathrm{W}(\mathrm{F}(\mathrm{i}))=w_{i}+w_{j}$ for all $\mathrm{I}$ and $\mathrm{j}$ (8)
The auto correlation among the features is generated using
Auto-correlation $=\sum_{i=1}^{m} \sum_{j=1}^{n} \frac{(i * j)(i, j)-\left(\mu_{x} * \mu_{y}\right)}{\left(\sigma_{x} * \sigma_{y}\right)}$ (9)
After extraction of relevant features, the tumor detection will be done as follows
Input: IDS (IDS1,IDS2,…IDSm), // IDS represents the image dataset
Output: Tumor prediction set (TPS)
Begin:
$\operatorname{ImPx}(\mathrm{x}, \mathrm{y})=\sum_{j=1}^{n}\left(a_{i j}^{x}+b_{i j}^{n}\right) d^{2}\left(m_{j}, t_{i}\right)$ (10)
For i=1 to m do // m is the last pixel extracted from the image
{
$\operatorname{IF} E_{F x, F y}(X, Y)=\sum_{i=1}^{m} \sum_{j=1}^{n}\left(a_{i j}^{x}+b_{i j}^{n}\right) d^{2}\left(m_{j}, t_{i}\right)$ (11)
RelF= ML(ImPx(i),m ,IDS(i))
{
$\mathrm{FeS}=\mathrm{fset}\left(\lambda \mathrm{Fs}, \operatorname{RelF}(\mathrm{i}), \operatorname{IF} E_{F x, F y}(i)\right)$ (12)
If $\operatorname{RelF}(\mathrm{i})>\theta \& \& \operatorname{RelF}(\mathrm{i}) \varepsilon \operatorname{IF} E_{F x, F y}(X, Y)$
Append fi to FS
end if
G =Arrange ML (I, T, maxcount) in ascending order.
$\operatorname{TPS}(\mathrm{i}) \leftarrow \mathrm{W}(\operatorname{RelF}(\mathrm{i}), \operatorname{RelF}(\mathrm{i}+1))$ (13)
where, W (RelF(i), RelF(i+1)) is the weight of the features assigned as,
$W(X, Y)=\sum_{(i, j) \varepsilon F s: i \varepsilon w, j \varepsilon T} \mathrm{n} * w j+w i+\frac{(i * j)(i, j)}{\left(\operatorname{IFE}_{F x, F y}(i)\right)}$ (14)
}
The tumor prediction set TPS is updated for every iteration as:
$\left.\operatorname{TPS}(\mathrm{i}) \leftarrow \log _{x}(\operatorname{RelF}(\mathrm{i})) \approx \log \lambda(\operatorname{RelF}(\mathrm{i}+1))+\sum_{i=1}^{m} \mathrm{Wi}-\operatorname{RelF}(\mathrm{i})\right)$ (15)
Here the tumor cells has different set of values and during evaluation, the difference in the pixel values are identified and then the tumor prediction is performed. The Relf holds the set of values. The set of values that have change will be maintained in the TPS set.
}
The proposed model True Positive Rate (TPR) is high when compared to the traditional model. The proposed model False Positive Rate is low that represents that the accuracy in detecting tumor is high. The parameters considered are represented.
Sensitivity $=\frac{T P}{T P+F N} \times 100$ (16)
Specificity $=\frac{T P}{T P+F P} \times 100$ (17)
Accuracy $=\frac{T P+T N}{T P+T N+F P+F N} \times 100$ (18)
$\operatorname{Precision}(\mathrm{P})=\frac{T P}{T P+F P} \times 100$ (19)
Re call $(\mathrm{R})=\frac{T P}{T P+F N} \times 100$ (20)
F- measure $=\frac{2 \times P \times R}{(P+R)} \times 100$ (21)
The performance of the proposed model is compared with the traditional methods and the parameters, Sensitivity, Specificity, Accuracy are represented in Table 1.
Table 1. Performance levels
|
Method Used |
Accuracy Performance in (%) |
|
SVM Classifier |
84 |
|
Hybrid SVM & KNN |
83.5 |
|
Basic CNN model |
91 |
|
Auto Encoder Classifier |
91 |
|
LTD-CNN Classifier |
96 |
The confusion matrix of the proposed Lung Tumor Detection Model using Convolution Neural Networks (LTD-CNN) with machine learning technique is illustrated in Table 2.
Table 2. CNN classifier confusion matrix
|
LTD - CNN Classifier |
Predicted Rate |
|
|
Positive |
Negative |
|
|
Positive |
TP:78 |
FN: 2 |
|
Negative |
FP: 3 |
TN: 22 |
The overall performance of the proposed Lung Tumor Detection Model using Convolution Neural Networks (LTD-CNN) with machine learning technique is compared with the existing models and the comparison levels are illustrated in Table 3.
The suggested LTD-CNN model collects relevant features from the considered dataset that are used for reliable tumour identification. The suggested model takes into account a dataset with 68450 records, and the extracted feature levels are shown in Table 4.
Table 3. Overall performance comparison
|
Classifiers |
Sensitivity (%) |
Specificity (%) |
Precision (%) |
False Positive Rate (FPR) |
Error Rate (ERR) |
|
Hybrid SVM & KNN |
58 |
53 |
61 |
0.87 |
0.69 |
|
Basic CNN model |
68 |
62 |
68 |
0.69 |
0.52 |
|
SVM |
86 |
84 |
75 |
0.95 |
1.21 |
|
RBFNN |
88 |
87 |
89 |
0.70 |
0.95 |
|
LTD - CNN |
96 |
93 |
94 |
0.10 |
0.06 |
Table 4. Lung image features extracted levels
|
Dataset Range (in Images) |
Diameter |
Perimeter |
Entropy |
Intensity |
Eccentricity |
|
10000 |
1.9 |
685 |
3.0625 |
255 |
0 |
|
20000 |
2.6 |
56 |
4.1687 |
255 |
0 |
|
30000 |
2.9 |
71 |
3.6899 |
255 |
0 |
|
40000 |
4.8 |
58 |
5.2680 |
255 |
0 |
|
>50000 |
2.3 |
325 |
5.6874 |
255 |
0 |
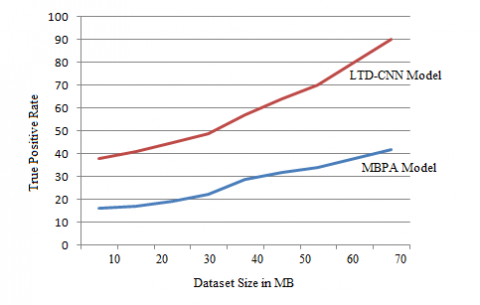
Figure 6. True positive rate
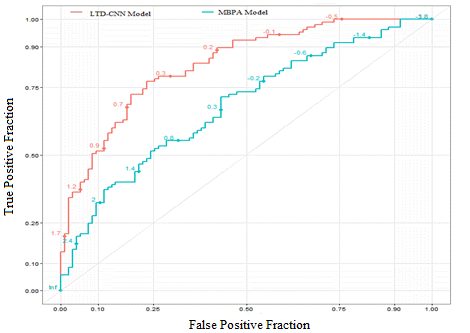
Figure 7. ROC curve
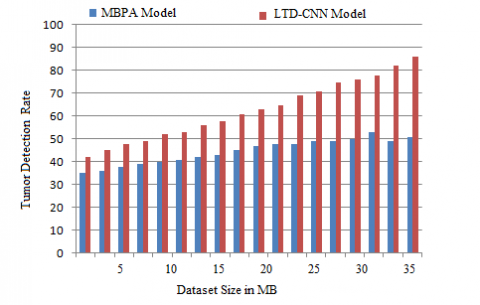
Figure 8. Tumor detection rate
The True Positive rate of a system represents the accuracy rate in tumour identification for improved treatment. The suggested LTD-CNN model's True Positive Rate is compared to the traditional MBPA approach, and the findings show that the proposed model outperforms the traditional method. The True Positive Rate is high, and the results are shown in Figure. 6.
The Receiver Operating Characteristic (ROC) curve of a system represents the balancing between True Positive Rate and False Positive Rate. The ROC curve is represented in Figure 7. The false positive rate of the model will be reduced as the prediction rate is accurate.
A system's Tumor Detection Rate shows its accuracy in detecting tumour region and size. The suggested LTD-CNN model's Tumor Detection Rate is compared to the classic MBPA approach, and the results show that the proposed model's Tumor Detection Rate is high, as shown in Figure 8.
Cancer is a main source of death around the world, it starts when a few cells in a body and begin to develop at extreme level. The proposed Lung Tumor Detection Model using Convolutional Neural Networks (LTD-CNN) with machine learning technique is implemented using ANACONDA SPYDER and the proposed model is compared with the traditional Multilevel Brightness-Preserving Approach (MBPA) model and results depict that the proposed model exhibits better performance.
Early recognition of lung tumor growth is the best way to control the death rates. The proposed lung tumor detection model using convolution neural networks with machine learning technique targets in giving straightforward and effective framework to detect the lung tumor growth in the patients, in view of the observed side effects, analyzing MRI images and by 3-D representation. The proposed classifier reduces expenses of lung disease screening, considering progressively broad early identification and improved survival rate. Early discovery of lung tumor growth can help in a sharp reduction in the lung disease death rate, which represents over 21% percent of the all-out tumor growth related deaths. The proposed model exhibits better performance in the accurate detection of tumor. The proposed model initially performs feature extraction from the input image and then extracts the relevant features from the data. The number of features considered for tumor identification are reduced to reduce the time complexity and also to improve accuracy. The proposed LTD-CNN classifier predicts the tumor region accurately. In future, the features considered in the proposed model can be reduced and the prediction rate can be improved.
[1] Yan, C., Yao, J., Li, R., Xu, Z., Huang, J. (2018). Weakly supervised deep learning for thoracic disease classification and localization on chest x-rays. In Proceedings of the 2018 ACM International Conference on Bioinformatics, Computational Biology, and Health Informatics, pp. 103-110. https://doi.org/10.1145/3233547.3233573
[2] Huang, G., Liu, Z., Van Der Maaten, L., Weinberger, K.Q. (2017). Densely connected convolutional networks. 2017 IEEE Conference on Computer Vision and Pattern Recognition (CVPR), pp. 2261-2269. https://doi.org/10.1109/CVPR.2017.243
[3] Hu, J., Shen, L., Albanie, S., Sun, G., Wu, E. (2018). Squeeze-and-excitation networks. IEEE Transactions on Pattern Analysis and Machine Intelligence, 42(8): 2011-2023. https://doi.org/10.1109/TPAMI.2019.2913372
[4] Arevalo, J., Solorio, T., Montes-y-Gómez, M., González, F.A. (2017). Gated multimodal units for information fusion. arXiv preprint arXiv:1702.01992.
[5] De Fauw, J., Ledsam, J.R., Romera-Paredes, B., Nikolov, S., Tomasev, N., Blackwell, S., Ronneberger, O. (2018). Clinically applicable deep learning for diagnosis and referral in retinal disease. Nature Medicine, 24(9): 1342-1350. https://doi.org/10.1038/s41591-018-0107-6
[6] Gong, L., Jiang, S., Yang, Z., Zhang, G., Wang, L. (2019). Automated pulmonary nodule detection in CT images using 3D deep squeeze-and-excitation networks. International Journal of Computer Assisted Radiology and Surgery, 14(11): 1969-1979. https://doi.org/10.1007/s11548-019-01979-1
[7] Al-Shabi, M., Lan, B.L., Chan, W.Y., Ng, K.H., Tan, M. (2019). Lung nodule classification using deep local–global networks. International Journal of Computer Assisted Radiology and Surgery, 14(10): 1815-1819. https://doi.org/10.1007/s11548-019-01981-7
[8] Dey, R., Lu, Z., Hong, Y. (2018). Diagnostic classification of lung nodules using 3D neural networks. In 2018 IEEE 15th International Symposium on Biomedical Imaging (ISBI 2018), pp. 774-778. https://doi.org/10.1109/ISBI.2018.8363687
[9] Siegel, R.L., Miller, K.D., Jemal, A. (2018). Cancer statistics, 2018. CA: A Cancer Journal for Clinicians, 68(1): 7-30. https://doi.org/10.3322/caac.21442
[10] Selvaraju, R.R., Cogswell, M., Das, A., Vedantam, R., Parikh, D., Batra, D. (2020). Grad-CAM: Visual explanations from deep networks via gradient-based localization. International Journal of Computer Vision, 128: 336-359. https://doi.org/10.1007/s11263-019-01228-7
[11] Lakshmanaprabu, S.K., Mohanty, S.N., Shankar, K., Arunkumar, N., Ramirez, G. (2019). Optimal deep learning model for classification of lung cancer on CT images. Future Generation Computer Systems, 92: 374-382. https://doi.org/10.1016/j.future.2018.10.009
[12] Liang, S., Zhang, R., Liang, D., Song, T., Ai, T., Xia, C., Wang, Y. (2018). Multimodal 3D DenseNet for IDH genotype prediction in gliomas. Genes, 9(8): 382. https://doi.org/10.3390/genes9080382
[13] Teramoto, A., Tsujimoto, M., Inoue, T., Tsukamoto, T., Imaizumi, K., Toyama, H., Fujita, H. (2019). Automated classification of pulmonary nodules through a retrospective analysis of conventional CT and two-phase PET images in patients undergoing biopsy. Asia Oceania Journal of Nuclear Medicine and Biology, 7(1): 29. https://doi.org/10.22038/AOJNMB.2018.12014
[14] Antonio, V.A.A., Ono, N., Saito, A., Sato, T., Altaf-Ul-Amin, M., Kanaya, S. (2018). Classification of lung adenocarcinoma transcriptome subtypes from pathological images using deep convolutional networks. International Journal of Computer Assisted Radiology and Surgery, 13(12): 1905-1913. https://doi.org/10.1007/s11548-018-1835-2
[15] Guo, W., Xu, Z., Zhang, H. (2019). Interstitial lung disease classification using improved DenseNet. Multimedia Tools and Applications, 78(21): 30615-30626. https://doi.org/10.1007/s11042-018-6535-y
[16] Zhang, X., Zou, Y., Shi, W. (2017). Dilated convolution neural network with LeakyReLU for environmental sound classification. In 2017 22nd International Conference on Digital Signal Processing (DSP), pp. 1-5. https://doi.org/10.1109/ICDSP.2017.8096153