Amine Ben Slama* | Hanene Sahli | Ramzi Maalmi | Hedi Trabelsi
© 2021 IIETA. This article is published by IIETA and is licensed under the CC BY 4.0 license (http://creativecommons.org/licenses/by/4.0/).
OPEN ACCESS
In healthcare, diagnostic tools of cardiac diseases are commonly known by the electrocardiogram (ECG) analysis. Atypical electrical activity can produce a cardiac arrhythmia. Various difficulties can be imposed to clinicians e.g., myocardial infarction arrhythmia via the non-stationarity and irregularity heart beat signals. Through the assistance of computer-aided diagnosis methods, timely specification of arrhythmia diseases reduces the mortality rate of affected patients. In this study, a 1 Lead QRS complex -layer deep convolutional neural network is proposed for the recognition of arrhythmia datasets. By the use of this CNN model, we planned a complete structure of the classification architecture after a pre-processing stage counting the denoising and QRS complex signals detection procedure. The chief benefit of the new proposed methodology is that the automatically training the QRS complexes without requiring all original extracted ECG signals. The proposed model was trained on the increased ECG database and separated into five classes. Experimental results display that the established CNN method has improved performance when compared to the state-of-the-art studies.
cardiac arrhythmia disease, ECG data, QRS complex signals, classification, conventional neural network
Cardiac arrhythmia (Ca) presents the major causes of human death. In 2020, Ca still accounts for 20-31% of all deaths of the worldwide. Due to its increased frequency and incidence, sudden cardiac (SC) death is the greatest shared cause of death [1] accounting for approximately 25million deaths every year with SC. Via ventricular fibrillation being the final underlying mechanism, the majority of deaths are unwitnessed.
The routine tool-focused analysis paradigm presents inefficient method due to dealing with large amount of heterogeneous information, and lacks serious examination and medical judgment to attain appropriate precision in diagnosis. This analysis would be better consistent, instinctive, and mostly low-cost scheme for screening and control. Thus, suitable medical appraisal can be related to the use of computer aided diagnosis systems.
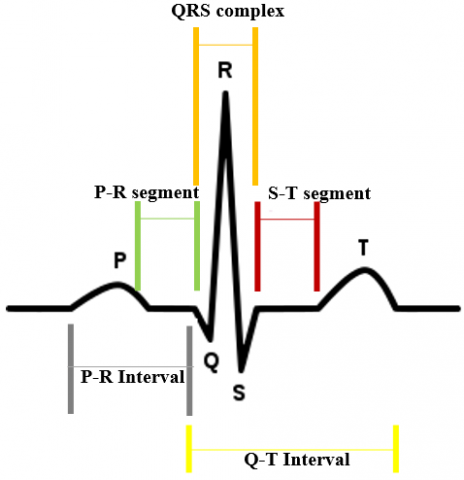
Being a non-stationary electrophysiological signal, electrocardiogram (ECG) remains the electrical activity of heart. This technique is employed for the heart-beats’ regularity measure for pathological patterns, and even other conditions such mental stress to control the heart. Generally, ECG cycle consists of the P-QRS-T waves as shown in Figure 1.
Depending the ECG signal, the main characteristics is involved in the frequency, latency and amplitude ranges of 0.5-45Hz, 0.06-0.08s and 0.1-0.2 mV respectively [2, 3]. The QRS complex presents a ventricular depolarization of amplitude (1 mV) and duration time (0.06-0.12 s). Evaluation of the ECG signal act is focused on a subjective judgment of different aspects: noise, heart beat irregularities... Advanced approaches can be used to classify ECG data according to different pathological levels. The aim of such procedures is to distinguish different Ca quality through significant measures for expert support in the diagnosis method [4]. Global categorization accuracy depends on filtering and characterization strategies in ECG analysis process. Feature extraction from ECG signals is a complex task due to the representation variability: peak amplitudes distribution, P-QRS-T complex, peak intervals. Supra ventricular Tachycardia (SVT) and Atrial Fibrillation (AF) cardiac-diseases are confused with atrial flutter in final decision for atrial arrhythmias identifying. Deep learning methods (DL) has been widely applied for classification and prediction purposes in diverse domains which, feature extraction step can automatically made. Recently, DL algorithms are being established sharply with an important effect on the classification accuracy for a wide variety of medical tasks. Modern computer aided systems such DLs to recognize arrhythmia of measured ECG signal for continuous heart cost reduction to improve the identification quality.
Many studies have been presented in literature using ECG data processing [5]. Analysis, filtering process [6], and classification scheme [7, 8] of ECG samples exhibit some limits of the algorithms that cannot permit clinician to recognize different cardiac diseases. Due to diversity of amplitudes in the ECG signals, different techniques do not present efficient detection of these anomalies using both time and frequency domains [7]. The CNN is considered a state-of-the-art tool for the classification of arrhythmia, and it has been studied with several variations such as 1-dimensional, 2-dimensional, or the combination of both [8, 9]. According to Xiao et al. [8], a novel arrhythmia classification method comprises three phases: A preprocessing, 1-dimensional CNN architecture based on different blocks with bidirectional connections between layers and transition blocks with attention mechanism, and majority voting to predict classification. Ca identification method [10] is developed by measuring irregular heart rhythms in order to aid the cardiologist’s judgment. Still, all the mentioned above techniques have many limitations. The primary objective of this study is to critically review the existing methods based on arrhythmia classification on the publishing forums [10].
Figure 1. ECG signal
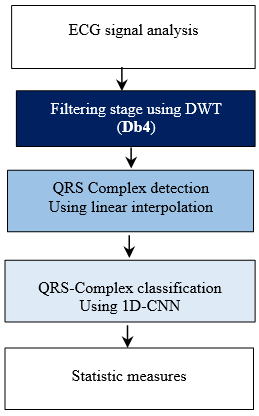
Figure 2. Illustration of the automated arrhythmia recognition system
Modern classification methods, such as DL and computationally complex require a big dataset. Hence, additively and homogeneity principles are not pursued by these algorithms and do not incorporate the regularity properties [11].
As shown in Figure 2, the contribution of this work is divided into three folds. First, to enhance the ECG signal quality, an automatic denoising process is implicated by defining a wavelet filtering model. Secondly, an important segmentation strategy of QRS complex is developed based on a linear interpolation algorithm. Finally, we introduce a classification approach using the 1D-CNN algorithm to recognize the studied ECG database divided into five categories. The Convnet classifier is applied after QRS complex detection to recognize arrhythmia and sinus behavior (See Figure 2). Thanks to the proposed procedure, the ECG classification process can be improved about a few percent when compared with other proposed methods even at presence of intense additive noise. The use of automatic analysis system with deep learning methods aims at a consistent diagnosis tool.
The remaining part the paper is organized as follows: Section 2 describes in details the proposed data collection, description of filtering and classification algorithm. Section 3 will be devoted purposely to present experimental results on two large data sets of normal and abnormal ECG signals. Besides, a comparative study is performed with the proposed method and other classification techniques from the recent literature. Finally, conclusions and future works are provided in Section 4.
2.1 Samples description
The ECG dataset applied in this work was collected from the MIT-BIH archives of ECG arrhythmia data [12]. Five classes are employed: The Ventricular Tachycardia (VT), Supra-ventricular Ectopic beats (SE), Atrial Fibrillation (AF), Idioventricular Rhythm (IVR), and Sinus Rhythm (Sinus) [13]. The ECG dataset signals are classified into five different categories. Compared to sinus rhythm class, four types of arrhythmia are presented. The database includes 161 files of various time records. In this work, a scheme of the ECG signals investigation includes pre-processing stage and furthers its classification stage. In this paper, the proposed two-stage multi-channel deep CNN based approaches for the detection of arrhythmia compared to sinus class are presented. The multi-lead signals used for the two-stage deep CNN architectures are described in the subsection 2.2. We have described the theory of the proposed multi-channel deep CNN architecture. In this work, we have collected multi-lead ECG signals from two MIT-BIH databases. 1-lead ECG (QRS complex) for arrhythmia and sinus cases were provided and sampled at 1000 Hz. The beat-to-beat variations and other morphological features of each lead ECG signal are different for arrhythmia classes [14-16]. In this study, we have proposed a two-stage CNN framework for the detection of arrhythmia classes using 1-lead ECG QRS complex.
2.2 Pre-processing methods
2.2.1 Denoising process
The ECG signals are pre-processed to eliminate noise at high frequency range. The features are extracted using DWT to locate different parameters of the ECG signal like detecting peaks (P, Q, R, S and T) and QRS interval [17, 18] which are helpful for diagnosing of arrhythmia conditions.
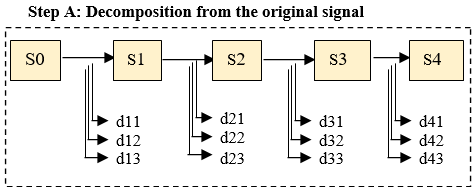
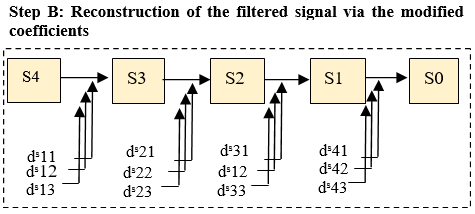
The DWT method allows multi resolution analysis by decomposing a discrete signal x(n) into low and high frequency components by low-band and high-band filters determined by a mother wavelet function and a corresponding scaling function. The signal x(n) is decomposed into low (approximations) aj,k and high dj,k (details) frequency components (See Figure 3) with three level banks:
$\left\{\begin{array}{l}
a_{j, k}=\sum_{n} h(n-2 k) a_{j-1, m} \\
d_{j, k}=\sum_{n} g(n-2 k) a_{j-1, m}
\end{array}\right.$ (1)
where, n is the number of level, j is a parameter (scaling level) that influence the scaling of the wavelet transform and k is related to the translation within each level of the wavelet function, $(j, k) \in Z$; m is used in the scaling function as a translation (shifting)corresponding to the scaling level j; h(n) and g(n) are low-pass and high-pass quadrature mirror filters respectively; $n \in Z$ is the integer scale.
Wavelet transform contains different families of wavelet functions, such as Haar, Daubechies, etc. The Daubechies, Haar, and Morlet wavelets have been selected for denoising ECG signals and exhibiting some resemblance with the QRS intervals (having the most intense part of the power spectrum at similar low frequencies range).where, n is the number of level, j is a parameter (scaling level) that influence the scaling of the wavelet transform and k is related to the translation within each level of the wavelet function, $(j, k) \in Z$ ; m is used in the scaling function as a translation (shifting)corresponding to the scaling level j; h(n) and g(n) are low-pass and high-pass quadrature mirror filters respectively; $n \in Z$ is the integer scale.
In this work, the wavelet transform is particularly used for denoising the ECG signals, where the input dataset is undergoes by gaussian noise. As shown in Figure 3, the principle of this algorithm is thus composed of three different stages:
The decomposition of the original ultrasound image and the reconstruction of the filtered image are detailed in Figure 3. The results of this filtering process depend closely on the choice of the wavelet base, the level of decomposition and the threshold values.
Notes:
S0: original signal
S1, S2, S3, S4: Approximation.
dij: horizontal, vertical, diagonal details
dsij: coefficients modified after thresholding of details of i decomposition levels
Figure 3. Principle of the decomposition of the original image and the reconstruction of the filtered signal with the modified coefficients via DWT method
2.2.2 QRS-complex detection algorithm
In the training stage, statistical parameters representing five classes (SE, VT, IVR, AF, and Sinus) are chosen and are applied to feed the 1D-CNN. The synaptic weights vector is adapted to minimize the cost function using the back-propagated error between the actual and the desired output [14]. Therefore, to the input layer which is constituted of input features, we used one single hidden layer and one output layer. The size of the hidden layer is optimized using k-fold cross-validation technique [15].
The principle of 1D-CNN algorithm is presented as follow:
(1) All parameters are initialized to 0.
(2) The convolution layer disclosures the trained information.
The 1D-CNN architecture teaches one feature in the first layer due to the distinct filter. The convolution layer length is declared to the input height ‘M’. The first layer is performed by ‘M’ features. The first layer is computed as following equation: R= (M–10) +1; which slide in the window via the employed information, after that, for each filter, one is added in the bias term.
(3) Batch normalization presents the output normalization of the previous activation layer. The rising the network steadiness is introduced for deducing the batch mean and splitting through the batch standard deviation.
(4) A pooling layer is used in order to avoid information overfitting by defining the characteristic maximum value (Max pool). This layer consists to reduce the output complexity.
(5) Flatten layer leads to two-dimensional matrix change with a features vector to obtain a wholly connected neural network.
(6) Dropout layer rise the accuracy rate. The network will be less sensitive to respond the dataset differences.
(7) The Softmax activation function is used to entirely connected layer. The height vector is reduced in the final layer.
Figure 4. Linear splines interpolation
The proposed separation approach is based on the extraction of the QRS segment by detecting the first point of first Q component which is considered as the instant t0 slow phase and the second point ti that represents the first instant of the following R segment phase (see Figure 4). Next, we used a linear spline interpolation result of f(ti) and f(ti+1) to calculate features from selected QRS segments. This approach is simply based on straight lines connecting the successive points. The linear splines are given by $y_{i}=f\left(t_{i}\right)$.
$f(\mathrm{t})=f\left(\mathrm{t}_{0}\right)+\frac{f\left(\mathrm{t}_{1}\right)-f\left(\mathrm{t}_{0}\right)}{t_{1}-t_{0}}\left(\mathrm{t}-\mathrm{t}_{0}\right) t_{0} \leq t \leq t_{1}$ (2)
$=f\left(\mathrm{t}_{1}\right)+\frac{f\left(\mathrm{t}_{2}\right)-f\left(\mathrm{t}_{1}\right)}{t_{2}-t_{1}}\left(\mathrm{t}-\mathrm{t}_{1}\right) t_{1} \leq t \leq t_{2}$ (3)
$=f\left(\mathrm{t}_{i-1}\right)+\frac{f\left(\mathrm{t}_{i}\right)-f\left(\mathrm{t}_{i-1}\right)}{\mathrm{t}_{i}-\mathrm{t}_{i-1}}\left(\mathrm{t}-\mathrm{t}_{i-1}\right) t_{i-1} \leq t \leq t_{i}$ (4)
Note that $\frac{f\left(t_{i}\right)-f\left(t_{i-1}\right)}{t_{i}-t_{i-1}}$ represents the slopes between $t_{i-1}$ and $t_{i}$ as shown in Figure 4. After that, we have used related QRS vector from ECG signal to train the CNN algorithm.
2.3 ConvNet classification
Some learning methods in the literature are Recurrent Neural Networks (RNNs), Deep Neural Networks (DNNs) [16, 17] and Convolutional Neural Networks (CNNs) [18]. CNN model has two dimensional hidden layer/ weight connected to the upper layer/ weight. In the network architecture, the hidden layers of the CNN model are convolutional layers, pooling layers, fully connected layers and normalization layers.
Based on the training backpropagation method (conjugate gradient training method), CNN classifier gives significant results. For classifying ECG samples, the application of CNN approach [18] is presented. This classification method is carried out for various medical applications [19]. Relevant QRS complex has been selected to help experts in the diagnosis of Arrhythmia abnormality cases. QRS segment identification is supplied for the training network input.
Figure 5. The proposed ConvNet architecture
In CNN classification framework, the training and the test phases are performed. The training and test sets hold 100 and 61 Arrhythmia cases. The 1D-CNN system is achieved to distinguish data into five classes: (1×(5 output classes)) (see Figure 5). The tangent sigmoid transfer function is involved for all neurons. The cross-validation method is performed for deciding on the optimal ConvNet structure. Five-folds are realized each experiment: four training and one validation. These folds are trained to choose the optimum hidden nodes number. CNN is approved to recognize different patterns. Various classifiers can be applied for arrhythmia identification. Previous studies [19] can confirm that CNN is a potent system for several classification domains. To classify the ECG samples, the QRS interval are selected for feature computation that is the major characteristics based on the separation between sinus rhythm and arrhythmia subjects [20]. ConvNet method takes into account natural fluctuations of the ECG samples that is further characteristic in arrhythmia disease. 94 ECG signals present four types of beat arrhythmia compared to 67 affected by sinus. The ECG training set presents 120 topics randomly chosen characterized by the QRS complex vectors. The validation and test set contains 41 remaining topics. The training, validation and test sets are considered 70%, 10%, and 20% from the three-lead ECG. Using hold-out, 5-folds, and leave-one-out cross-validation methods [21], the performance of the multi-lead deep CNN is assessed. Regarding to the training of the first step deep CNN model, we have balanced the examples number for both five classes: IVR, VT, SVT, AF, AFL. 5 batch size and 20 epochs number are done for both hold-out and 5-fold CV systems in the deep ConNet. The number of iterations in each convolution layer, input, and output shapes of each layer for stage 1 is shown in Table 1. In this study, we have used accuracy, sensitivity, specificity measures to evaluate the performance of one channel deep CNN classifier.
In the denoising process context, we carried out several experiments using different threshold values and decomposition levels are applied. Diverse wavelet types are tested such as: Haar, Daubechies and Morlet. In addition, numerous decomposition levels from 2 to 5 are used in order to choose the best decomposition level which presents the high PSNR value. The choice of threshold is important to preserve the image information (see Table 2). A low threshold gives an image with high frequencies but also with a significant amount of noise. A high threshold produces an image without fine details and reduced noise. As shown in Table 1, we report the filtering results of different wavelets in terms of PSNR value for different experiments. Each threshold (0.1, 0.2, 0.3, 0.5, 0.6...1) held out to fix the pertinent filtering method. The proposed Db4 algorithm provides the best filtering performance when the threshold is set to 0.7. The experiments demonstrate that our Daubechies algorithm is very susceptible for improving the image quality.
To decompose ECG signal, wavelet transform is employed. Regarding to the baseline drift removal and noise component attenuation, the proposed method was explored for accomplishing the finest precision. The root mean square error (RMSE) and the signal-to-noise ratio (SNR) were estimated to the DWT technique Performance. These measures were computed via the difference flanked by the original and filtered ECG signal based on wavelet transform decomposition and the thresholding process [22, 23].
The RMSE is applied for the deviation estimation between the original and the filtered ECG signal given by the following equation:
$R M S E=\sqrt{\frac{1}{N-1} \sum_{i=1}^{N}(x(i)-\bar{x}(i))^{2}}$ (5)
The SNR measure is defined as follow:
$\mathrm{SNR}=10 \cdot \log \left[\frac{\sum_{\mathrm{i}=1}^{\mathrm{N}} \mathrm{x}(\mathrm{i})^{2}}{\sum_{\mathrm{i}=1}^{\mathrm{N}}(\mathrm{x}(\mathrm{i})-\overline{\mathrm{x}}(\mathrm{i}))^{2}}\right]$ (6)
where, N is the length of the ECG signal, x(i) is the recorded ECG signal and $\bar{x}(i)$ is the filtered signal.
Table 3 reveals the attained results signal-to-noise ratio noted (SNRres) estimated by (10) after using the selected denoising methods.
Table 1. Used parameters for all layers of the proposed ConvNet model
|
Layer |
Layer Name |
Layer parameters |
Output shape |
Other Layer Parameter |
|
Layer 0 |
Input |
No parameters |
1*1287 |
0 |
|
Layer 1 |
Cov2D |
Number of _lters = 20; Filter size = (3,5); Strides= (1,1); Input shape =(1,1287,1);Activation=ReLu |
1*1284 *20 |
256 |
|
Layer 2 |
MaxPooling1D |
Pool size (1,5); strides=(1,5) |
1*257*16 |
0 |
|
Layer 3 |
Cov1D |
Number of = (1,1); Activation = ReLu |
1 *253 *32 |
1,476 |
|
Layer 4 |
Maxpoling1D |
Pool size = (1,5); Strides = (1,5) |
1 *60* 32 |
0 |
|
Layer 5 |
Flatten |
No parameters |
1920 |
0 |
|
Layer 6 |
Dense |
Number of hidden neurons = 100; Activation =Sigmoid |
150 |
288150 |
|
Layer 7 |
Output |
Number of neurons = 1; Activation = Sigmoid |
5 |
155 |
Table 2. Demonstration of the choice of wavelets, level decomposition and threshold in term of PSNR
|
Wavelet model |
Decomposition level |
Threshold value |
|||||||||
|
0.1 |
0.2 |
0.3 |
0.4 |
0.5 |
0.6 |
0.7 |
0.8 |
0.9 |
1 |
||
|
Haar |
2 |
10.12 |
10.98 |
12.49 |
12.11 |
13.85 |
14.17 |
15.52 |
14.25 |
13.33 |
13.12 |
|
3 |
10.31 |
12.69 |
15.27 |
17.73 |
19.55 |
20.15 |
18.15 |
16.87 |
14.76 |
13.25 |
|
|
4 |
11.20 |
14.87 |
16.85 |
18.12 |
20.55 |
21.35 |
22.01 |
24.19 |
21.12 |
18.35 |
|
|
5 |
10.32 |
12.01 |
13.81 |
16.18 |
18.71 |
20.75 |
21.05 |
20.23 |
20.20 |
19.14 |
|
|
Daubechies |
2 |
10.26 |
12.66 |
13.18 |
13.16 |
14.15 |
14.92 |
16.20 |
16.84 |
14.02 |
14.11 |
|
3 |
10.11 |
13.91 |
14.23 |
15.33 |
17.01 |
19.63 |
21.84 |
15.17 |
13.56 |
12.55 |
|
|
4 |
10.42 |
15.89 |
17.25 |
19.59 |
21.67 |
24.70 |
25.75 |
22.71 |
20.52 |
19.12 |
|
|
5 |
12.30 |
14.31 |
16.78 |
18.96 |
19.41 |
20.53 |
23.54 |
19.17 |
19.25 |
19.04 |
|
|
Morlet |
2 |
10.03 |
10.58 |
11.57 |
12.13 |
12.58 |
13.68 |
13.17 |
14.25 |
12.82 |
10.05 |
|
3 |
10.02 |
12.84 |
13.16 |
14.87 |
16.12 |
18.12 |
19.14 |
20.02 |
15.42 |
15.25 |
|
|
4 |
10.20 |
14.15 |
16.14 |
17.09 |
19.31 |
19.25 |
17.69 |
16.56 |
14.15 |
14.36 |
|
|
5 |
10.11 |
12.84 |
13.47 |
13.91 |
15.01 |
17.36 |
19.14 |
17.18 |
15.42 |
15.25 |
|
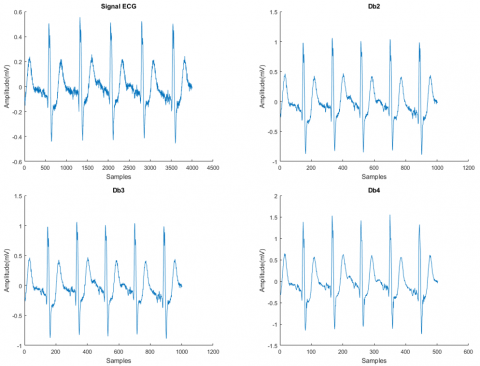
The preprocessing of the ECG signal (such as removing baseline offset, additive noise, and power-line interference) should be done at the acquisition of ECG signal using Matlab. The ECG signal had additive white noise component in the intensities assumed by signal-to-noise ratio SNRad. In spite of the additive noise component intensity, the denoising results established that the DWT method guaranteed the highest SNRres. As exposed in Figure 6, diverse values of filter order are applied to assess the best filtering results. Compared to other DWT level (db2, db3, db4), the filter order “db4” highlights the optimum performance in terms of noise decrease.
To properly estimate the considered filtering approaches quality, the QRS complex amplitude and duration have been extracted. We appraised the ability of the tested denoising procedures for conserving the peak QRS amplitude. Focused on the db4 wavelet function, we can notice that after denoising step the peaks “R” amplitudes are extremely near to their original mean amplitude. The ECG data sets can be treated more to QRS complex detection. Numerous parameters can be extracted from the ECG signals for instance random data series analysis, including Gaussian noise [24, 25], random transient pulses [26] or train of random pulse spikes [27]. The QRS complex advantages are presented in the implementation simplicity and reducing computational time. Therefore, we have used the QRS complex that describes random time series and contains non-Gaussian random signals. Figure 7 demonstrates the resulting QRS complex detection of the denoised ECG signals using linear interpolation systems.
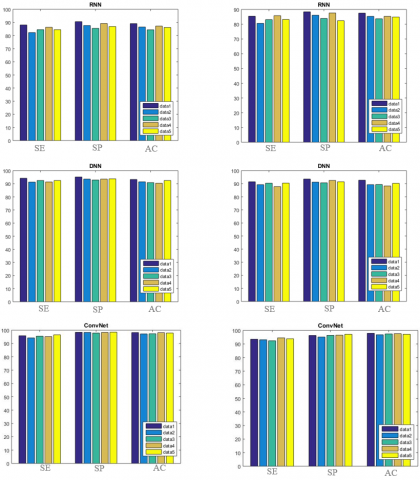
To validate the success of the classification approach, the proposed method is compared with some state-of-the-art techniques [13, 28-30]. The ConvNet procedure enables to classify the ECG signals into five separated classes. Our classification results are compared with recurrent neural networks (RNNs), deep neural networks (DNNs) [31, 32]. These methods can extract measures that associate different signal features together. Valuable analysis in terms of accuracy “AC”, sensitivity “SE”, and specificity “SP” was realized for supplying classifiers evaluation [17, 19]. These statistical measures are obtained from TP (True Positive), TN (True Negative), FN (False Negative) and FP (False Positive). SE, SP and AC are shown by the following equations:
$S E=\frac{T P}{T P+F N}$ (7)
$S P=\frac{T N}{F P+T N}$ (8)
$A C=\frac{T P+T N}{T P+F N+T N+F P}$ (9)
To secure a reasonable judgment amid the three tested neural network methods, the same network structure was trained for each one in different experiments based on suitable features. The projected ConvNet depends on advanced algorithms for specifying the best network structure [33]. In this context, the cross-validation procedure was employed to choose the relevant ConvNet structure in the training and test phases of ECG signal datasets [24]. To have an optimum hidden layer’s and nodes numbers in each layer, different folds cross-validation tests were completed. By selecting the hidden layer size, the best ConvNet structure straight enables to minimize the validation error [34, 35]. The training patterns were randomly chosen from QRS complex vector with ECG signals. As shown in Figure 8, the ConvNet classification precision is greater when compared to the RNN and DNN methods. 98.05% of accuracy is attained with a standard deviation less than 0.82% using ECG dataset. The CNN method proves improved classification accuracy in the validation phase which could be more robust against any additive noise components.
In this study, we notice that the ConvNet method can effectively extract the significant characteristic from the non-stationary ECG signal. This method supplied real arrhythmia discrimination of the sinus topics. Table 4 discloses comparison of classification precision via some methods in literature. The obtained results present the highest classification accuracy when compared with other tested approaches. The proposed ConvNet strategy reached 98.05% of accuracy which is talented to successfully classify the datasets.
The obtained results present the highest detection accuracy when compared with other tested approaches.
In this work, different machine learning and deep learning architectures were successfully implemented to perform ECG signals analysis. Two limitations of this study are; the ECG database are not specific to their clinical context and description of the patient population in which these ECGs were obtained is lacking. These affect, artificially, the statistically significant differences between the outputs and the ground truth.
A last limitation of this study is that only one cardiologist was working to provide the ground truth labels. It could be interesting to provide the ground truth by many radiologists.
Table 3. Values of SNRres [dB] estimated for the applied filtering algorithms when the recorded five ECG time records (subjects 1÷5) comprise of an additive white noise component of selected intensities SNRad = 5 dB, 10 dB or 15 dB
|
SNRad [dB] |
DWT (wavelet db2) |
DWT (wavelet db3) |
DWT (wavelet db4) |
||||||||
|
5 |
10 |
15 |
5 |
10 |
15 |
5 |
10 |
15 |
|||
|
SNRres [dB] ECG signal1 |
15.34 |
18.23 |
25.28 |
11.13 |
11.87 |
22.16 |
10.29 |
11.87 |
18.12 |
||
|
ECG signal2 |
12.55 |
20.48 |
25.54 |
10.36 |
13.32 |
21.41 |
8.34 |
11.42 |
19.67 |
||
|
ECG signal3 |
16.45 |
21.54 |
27.56 |
12.23 |
14.98 |
22.34 |
7.55 |
10.65 |
19.12 |
||
|
ECG signal4 |
14.09 |
19.76 |
24.45 |
11.21 |
14.63 |
20.45 |
9.14 |
11.85 |
18.54 |
||
|
ECG signal5 |
16.56 |
20.44 |
25.98 |
12.86 |
15.58 |
23.98 |
9.54 |
12.64 |
17.43 |
||
Table 4. Comparison of classification efficiency by selected methods, presented in literature
|
State-of-the-art studies |
Kallas et al. 2012 [28] |
Martis et al. 2013 [29] |
Martis et al. 2013 [30] |
Slama et al. 2018 [13] |
Proposed method |
|
Feature optimization |
PCA |
Bispectrum+PCA |
DWT+PCA |
DWT+FLD |
DWT |
|
Classifier |
SVM |
SVM |
SVM |
MNN |
CNN |
|
AC (%) |
97.39% |
93.48% |
96.92% |
97.38% |
98.05 |
Figure 6. The filtering noisy ECG signals using db2, db3 and db4
Figure 7. QRS complex identification results from the filtered ECG signals based linear interpolation systems: (i) ECG signal detection, (ii) QRS complex detection zoom
Figure 8. Reached AC, SE, and SP results of data using RNN, DNN and ConvNet classifiers in the training stage (s1) and the validation stage (s2)
In this work, a ConvNet approach is highlighted for ECG datasets classification. To reduce additive noise and non-stationary drifts in the employed signals, the DWT technique is applied. A pre-processing detection procedure was completed based on the linear interpolation for allocating the date to one of only five categories. In order to efficiency determine the arrhythmia classes, the ConvNet method was used focused on the ECG datasets. Encouraging results are obtained improving the arrhythmia diagnosis. Compared to previous studies, the proposed scheme proves high-accuracy more 98.05%. We notice that the proposed method is supplementary effectual than other considered methods even deep learning classifiers. The proposed linear interpolation framework can guarantee improved classification results.
[1] Ebrahimzadeh, E., Manuchehri, M.S., Amoozegar, S., Araabi, B.N., Soltanian-Zadeh, H. (2018). A time local subset feature selection for prediction of sudden cardiac death from ECG signal. Medical & Biological Engineering & Computing, 56(7): 1253-1270. https://doi.org/10.1007/s11517-017-1764-1
[2] Sangaiah, A.K., Arumugam, M., Bian, G.B. (2020). An intelligent learning approach for improving ECG signal classification and arrhythmia analysis. Artificial Intelligence in Medicine, 103: 101788. https://doi.org/10.1016/j.artmed.2019.101788
[3] Pławiak, P., Acharya, U.R. (2020). Novel deep genetic ensemble of classifiers for arrhythmia detection using ECG signals. Neural Computing and Applications, 32(15): 11137-11161. https://doi.org/10.1007/s00521-018-03980-2
[4] Sundararaj, V. (2019). Optimised denoising scheme via opposition-based self-adaptive learning PSO algorithm for wavelet-based ECG signal noise reduction. International Journal of Biomedical Engineering and Technology, 31(4): 325-345. https://doi.org/10.1504/IJBET.2019.103242
[5] Oh, S.L., Ng, E.Y., San Tan, R., Acharya, U.R. (2018). Automated diagnosis of arrhythmia using combination of CNN and LSTM techniques with variable length heart beats. Computers in Biology and Medicine, 102: 278-287. https://doi.org/10.1016/j.compbiomed.2018.06.002
[6] Ouali, M.A., Ghanai, M., Chafaa, K. (2020). TLBO optimization algorithm based-type2 fuzzy adaptive filter for ECG signals denoising. Traitement du Signal, 37(4): 541-553. https://doi.org/10.18280/ts.370401
[7] Acharya, U.R., Fujita, H., Oh, S.L., Hagiwara, Y., Tan, J.H., Adam, M. (2017). Application of deep convolutional neural network for automated detection of myocardial infarction using ECG signals. Information Sciences, 415: 190-198. https://doi.org/10.1016/j.ins.2017.06.027
[8] Xiao, B., Xu, Y., Bi, X., Zhang, J., Ma, X. (2020). Heart sounds classification using a novel 1-D convolutional neural network with extremely low parameter consumption. Neurocomputing, 392: 153-159. https://doi.org/10.1016/j.neucom.2018.09.101
[9] Noman, F., Ting, C.M., Salleh, S.H., Ombao, H. (2019). Short-segment heart sound classification using an ensemble of deep convolutional neural networks. In ICASSP 2019-2019 IEEE International Conference on Acoustics, Speech and Signal Processing (ICASSP), pp. 1318-1322. https://doi.org/10.1109/ICASSP.2019.8682668
[10] Atal, D.K., Singh, M. (2020). Arrhythmia classification with ECG signals based on the optimization-enabled deep convolutional neural network. Computer Methods and Programs in Biomedicine, 196: 105607. https://doi.org/10.1016/j.cmpb.2020.105607
[11] Huang, J., Chen, B., Yao, B., He, W. (2019). ECG arrhythmia classification using STFT-based spectrogram and convolutional neural network. IEEE Access, 7: 92871-92880. https://doi.org/10.1109/ACCESS.2019.2928017
[12] Murat, F., Yildirim, O., Talo, M., Baloglu, U.B., Demir, Y., Acharya, U.R. (2020). Application of deep learning techniques for heartbeats detection using ECG signals-analysis and review. Computers in Biology and Medicine, 120: 103726. https://doi.org/10.1016/j.compbiomed.2020.103726
[13] Slama, A.B., Lentka, Ł., Mouelhi, A., Diouani, M.F., Sayadi, M., Smulko, J. (2018). Application of statistical features and multilayer neural network to automatic diagnosis of arrhythmia by ECG signals. Metrology and Measurement Systems, 25(1). https://doi.org/10.24425/118163
[14] Mar, T., Zaunseder, S., Martínez, J.P., Llamedo, M., Poll, R. (2011). Optimization of ECG classification by means of feature selection. IEEE transactions on Biomedical Engineering, 58(8): 2168-2177. https://doi.org/10.1109/TBME.2011.2113395
[15] Parvaneh, S., Rubin, J., Babaeizadeh, S., Xu-Wilson, M. (2019). Cardiac arrhythmia detection using deep learning: A review. Journal of Electrocardiology, 57: S70-S74. https://doi.org/10.1016/j.jelectrocard.2019.08.004
[16] Kłosowski, G., Rymarczyk, T., Wójcik, D., Skowron, S., Cieplak, T., Adamkiewicz, P. (2020). The use of time-frequency moments as inputs of LSTM network for ECG signal classification. Electronics, 9(9): 1452. https://doi.org/10.3390/electronics9091452
[17] Hannun, A.Y., Rajpurkar, P., Haghpanahi, M., Tison, G.H., Bourn, C., Turakhia, M.P., Ng, A.Y. (2019). Cardiologist-level arrhythmia detection and classification in ambulatory electrocardiograms using a deep neural network. Nature Medicine, 25(1): 65-69. https://doi.org/10.1038/s41591-018-0268-3
[18] Lampreave, P., Jimenez-Perez, G., Sanz, I., Gomez, A., Camara, O. (2020). Towards assisted electrocardiogram interpretation using an AI-enabled augmented reality headset. Computer Methods in Biomechanics and Biomedical Engineering: Imaging & Visualization, 9(4): 1-8. https://doi.org/10.1080/21681163.2020.1835544
[19] Swapna, G., Kp, S., Vinayakumar, R. (2018). Automated detection of diabetes using CNN and CNN-LSTM network and heart rate signals. Procedia Computer Science, 132: 1253-1262. https://doi.org/10.1016/j.procs.2018.05.041
[20] Vogt, N. (2019). CNNs, LSTMs, and attention networks for pathology detection in medical data. arXiv preprint arXiv:1912.00852.
[21] Salem, M., Taheri, S., Yuan, J.S. (2018). ECG arrhythmia classification using transfer learning from 2-dimensional deep CNN features. In 2018 IEEE Biomedical Circuits and Systems Conference (BioCAS), pp. 1-4. https://doi.org/10.1109/BIOCAS.2018.8584808
[22] Bodile, R.M., Talari, V.K. (2021). Removal of power-line interference from ECG using decomposition methodologies and Kalman filter framework: A comparative study. Traitement du Signal, 38(3). https://doi.org/10.18280/ts.380334
[23] Jothiramalingam, R., Jude, A., Patan, R., Ramachandran, M., Duraisamy, J.H., Gandomi, A.H. (2020). Machine learning-based left ventricular hypertrophy detection using multi-lead ECG signal. Neural Computing and Applications, 33: 4445-4455. https://doi.org/10.1007/s00521-020-05238-2
[24] Mirza, S., Bhole, K., Singh, P. (2020). Fetal ECG extraction and QRS detection using independent component analysis. In 2020 16th IEEE International Colloquium on Signal Processing & Its Applications (CSPA), pp. 157-161. https://doi.org/10.1109/CSPA48992.2020.9068696
[25] Manju, B.R., Sneha, M.R. (2020). ECG denoising using Wiener filter and Kalman filter. Procedia Computer Science, 171: 273-281. https://doi.org/10.1016/j.procs.2020.04.029
[26] Fiori, G., Scorza, A., Conforto, S., Fuiano, F., Schmid, M., Sciuto, S.A. (2020). ECG waveforms reconstruction based on equivalent time sampling. In 2020 IEEE International Symposium on Medical Measurements and Applications (MeMeA), pp. 1-6. https://doi.org/10.1109/MeMeA49120.2020.9137260
[27] Erdenebayar, U., Kim, Y.J., Park, J.U., Joo, E.Y., Lee, K.J. (2019). Deep learning approaches for automatic detection of sleep apnea events from an electrocardiogram. Computer Methods and Programs in Biomedicine, 180: 105001. https://doi.org/10.1016/j.cmpb.2019.105001
[28] Martis, R.J., Acharya, U.R., Min, L.C. (2013). ECG beat classification using PCA, LDA, ICA and discrete wavelet transform. Biomedical Signal Processing and Control, 8(5): 437-448. https://doi.org/10.1016/j.bspc.2013.01.005
[29] Martis, R.J., Acharya, U.R., Min, L.C. (2013). ECG beat classification using PCA, LDA, ICA and discrete wavelet transform. Biomedical Signal Processing and Control, 8(5): 437-448. https://doi.org/10.1016/j.bspc.2013.01.005
[30] Martis, R.J., Acharya, U.R., Lim, C.M., Mandana, K.M., Ray, A.K., Chakraborty, C. (2013). Application of higher order cumulant features for cardiac health diagnosis using ECG signals. International Journal of Neural Systems, 23(4): 1350014. https://doi.org/10.1142/S0129065713500147
[31] Singh, S., Pandey, S.K., Pawar, U., Janghel, R.R. (2018). Classification of ECG arrhythmia using recurrent neural networks. Procedia Computer Science, 132: 1290-1297. https://doi.org/10.1016/j.procs.2018.05.045
[32] Luo, K., Li, J., Wang, Z., Cuschieri, A. (2017). Patient-specific deep architectural model for ECG classification. Journal of Healthcare Engineering, 2017: 1-13. https://doi.org/10.1155/2017/4108720
[33] Sahli, H., Ben Slama, A., Mouelhi, A., Soayeh, N., Rachdi, R., Sayadi, M. (2020). A computer-aided method based on geometrical texture features for a precocious detection of fetal Hydrocephalus in ultrasound images. Technology and Health Care, 28(6): 643-664. https://doi.org/10.3233/THC-191752
[34] Slama, A.B., Sahli, H., Mouelhi, A., Marrakchi, J., Boukriba, S., Trabelsi, H., Sayadi, M. (2020). Hybrid clustering system using Nystagmus parameters discrimination for vestibular disorder diagnosis. Journal of X-Ray Science and Technology, 28(5): 923-938. https://doi.org/10.3233/XST-200661
[35] Ihsanto, E., Ramli, K., Sudiana, D., Gunawan, T.S. (2020). Fast and accurate algorithm for ECG authentication using residual depthwise separable convolutional neural networks. Applied Sciences, 10(9): 3304. https://doi.org/10.3390/app10093304