Devanshu Tiwari* | Manish Dixit | Kamlesh Gupta
© 2021 IIETA. This article is published by IIETA and is licensed under the CC BY 4.0 license (http://creativecommons.org/licenses/by/4.0/).
OPEN ACCESS
This paper simply presents a fully automated breast cancer detection system as “Deep Multi-view Breast cancer Detection” based on deep transfer learning. The deep transfer learning model i.e., Visual Geometry Group 16 (VGG 16) is used in this approach for the correct classification of Breast thermal images into either normal or abnormal. This VGG 16 model is trained with the help of Static as well as Dynamic breast thermal images dataset consisting of multi-view, single view breast thermal images. These Multi-view breast thermal images are generated in this approach by concatenating the conventional left, frontal and right view breast thermal images taken from the Database for Mastology Research with Infrared image for the first time in order to generate a more informative and complete thermal temperature map of breast for enhancing the accuracy of the overall system. For the sake of genuine comparison, three other popular deep transfer learning models like Residual Network 50 (ResNet50V2), InceptionV3 network and Visual Geometry Group 19 (VGG 19) are also trained with the same augmented dataset consisting of multi-view as well as single view breast thermal images. The VGG 16 based Deep Multi-view Breast cancer Detect system delivers the best training, validation as well as testing accuracies as compared to their other deep transfer learning models. The VGG 16 achieves an encouraging testing accuracy of 99% on the Dynamic breast thermal images testing dataset utilizing the multi-view breast thermal images as input. Whereas the testing accuracies of 95%, 94% and 89% are achieved by the VGG 19, ResNet50V2, InceptionV3 models respectively over the Dynamic breast thermal images testing dataset utilizing the same multi-view breast thermal images as input.
thermal infrared images, multi-view, breast cancer, VGG16, VGG19, ResNet50, Inception Net, augmentation
The cancer of Breast is the most commonly diagnosed non-cutaneous malignancy in women’s all over the world. Its timely and early detection in the initial stages proved to be very helpful and thus eventually enhances the chances of patient’s survival [1]. Breast cancer ranks fifth when it comes to the number deaths caused by any cancer worldwide as per GLOBOCAN data 2020. The cancer of breast is the major reason of women’s mortality and morbidity surpassing lung cancer in 2020 [2]. Breast cancer basically originates from the tissues of breast and especially from the interior lining of the lobules or the milk ducts in the breast. Breast cancer cells are the result of the RNA or DNA modification and mutation which eventually transformed a normal cell into a cancer cells. Basically bacteria, chemicals in the air, electromagnetic radiation, viruses, fungi, mechanical cell-level injury, parasites, heat, water, food, free radicals, aging of DNA or RNA and evolution are all can be the reason behind this type of harmful mutation of DNA which leads to cancer of breast [3]. Apart from this, the major risk factors associated with breast cancer are the obesity, family background or history, race, genetics, alcohol consumption, avoid doing physical labor for long time etc. [4]. Detection of breast cancer at an early stage accompanied by the advance medical treatment will play a major role to avoid mortality from this type of cancer. The mostly employed ways to diagnose breast cancer is by performing regular screening tests and these test may include manual screening by physicians as well as utilizing the medical imaging techniques like Thermography, Mammography, and Ultrasound etc. [5]. Even there are some developed countries which makes it mandatory for women’s over 30 years of age and associated with high risk factors to go through these screening test on a yearly basis to decrease the high mortality rate caused by breast cancer in their countries [6].
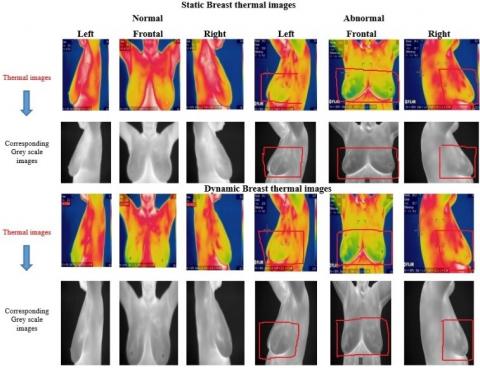
The Mammography and Thermography are the widely used medical imaging techniques employed for the detection of breast cancer. Since the Mammography imaging technique suffers from the drawbacks of high cost as well as patient exposure to high radiation which could result in other health problems [7]. Due all these major drawbacks, it’s the Thermography imaging technique which is getting popular and prescribed as a complementary test by the doctors for the early screening of breast cancer especially in case of some major symptoms. Since this thermography technique is noninvasive and contactless, which makes its popular among female patients as compare to other imaging techniques. This thermal imaging technique is based on the concept of capturing the infrared radiation emitted from the skin of human body which determines bilateral symmetry patterns in normal cases and any variation in such symmetry patterns will highlights the anomalies. These anomalies could be the result of circulation and metabolic changes which occurred due to the excessive heat produced by the tissues of tumor present in the breast [8]. As the cancerous tissues metabolize faster than the normal tissues raising the temperature of the tumor location on the breast as compare to the surrounding regions. This change in temperature is precisely captured with the help of this thermal imaging technique employing thermal cameras. This technique captures breast thermal images utilizing two acquisition protocols i.e. Static and Dynamic [9, 10]. The Static thermal images are not related to time and they are taken one per patient at different angles. Whereas the Dynamic thermal images are captured during particular interval of time while passing through a cooling step [11]. This technique is having the capacity to detect breast cancer at a very early stage even when the patient is asymptomatic provided that patient is screened at regular intervals. The Static as well as Dynamic protocol based breast thermal images of normal and abnormal patient is presented with the help of Figure 1. The Figure 1 also showcases their corresponding grey scale images (free from image artefacts). The normal Frontal breast thermal images of Static and Dynamic protocol based in Figure 1 are having symmetric heat patterns i.e. uniform temperature throughout both the breasts region of a volunteer. Along with this, the left and right breast thermal images are also showcasing shape symmetry i.e. almost same shape of both the breast regions. Whereas the Static and Dynamic protocol based abnormal frontal breast thermal images are having asymmetric heat patterns, which are highlighted in the Figure 1 and also the left as well as right abnormal breast thermal images of a patient are lacking the shape symmetry quotient i.e. shape of both the breasts are somewhat different with each other.
Figure 1. The normal and abnormal static as well as dynamic breast thermal images
The deep learning and deep transfer learning are actually the two subdomains of machine learning. The machine learning based various Computer aided diagnosis systems (CAD) are developed in the last decade and so, which are accurately detecting as well as classifying various brain, lungs, liver, breast etc. disorders utilizing the clinical images of these organs [12]. These CAD systems research and development are even more important in the context of present scenario, where the whole world is facing severe crisis of medical facilities as well as doctors [13]. So there is a need to develop robust and accurate CAD systems, which could assist radiologist in the interpretation of breast thermal images into normal or abnormal images. At the same time the low diagnostic ability of thermography technique, which is majorly caused due to the limited as well as weak expertise of doctors in the interpretation of breast thermal images to detect breast anomalies can be easily enhanced with the usage of these CAD systems based on deep learning and deep transfer learning. As the deep learning and deep transfer learning based systems are offering advantages like fully automated in nature, less complex to develop (requires hyper parameter tuning), offering optimal training time with highest accuracy. Unlike the traditional machine learning based systems, which requires proper manual selection of segmentation, feature extraction methods along with an efficient classifier for performing classification. These systems also require more training time and offers less accuracy. It is because of all these disadvantages, now the machine learning based systems are getting replaced from the more advanced and accurate deep learning and deep transfer learning based systems. During the last two years, a significant amount of research is carried out for the development of such CAD systems especially based on deep learning and deep transfer learning for automating the entire process of diagnosing the breast cancer utilizing the various medical imaging modalities like Mammography [14-16], Ultrasound [17, 18] and Thermography [19, 20] etc. The present research trend in this field is the use of more accurate and advanced deep transfer learning models, which even delivers good results with limited size datasets for training purpose [12]. But little magnitude of research is conducted for the developments of CAD systems utilizing thermal images as compare to other medical imaging modalities like Mammography and Histopathological images. Considering the fact that there is a need to develop more accurate and robust computer assisted automated approach or CAD system for the automated classification of breast thermal images into either normal or abnormal cases, the following contributions of this research article are stated as follows:
(1) This research article presents an accurate fully automated breast cancer detection system based on the VGG16 deep transfer learning model utilizing both the Static and Dynamic thermal images.
(2) This research article presents a novel idea of training the deep transfer learning models with the help of a 3 sides i.e. Multi-view breast thermal images, which can be fabricated by concatenating the conventional Left, Right and Frontal breast thermal images for the first time. Then experimentation and simulation is done to showcase that these Multi-view concatenated thermal images tends to delivered better results as compare to the conventional single view thermal images.
(3) This research article also presents a brief experimentation utilizing both types of i.e. Static and Dynamic breast thermal images to showcase which type of thermal images delivered better results during training and testing phase.
This section simply presents some of the major state of the art approaches based on machine learning and deep learning proposed over the years for the accurate classification of breast cancer using the Thermal images or Thermography technique. Although the amount of research conducted in the domain of thermography based breast cancer detection is far less as compare to the amount of research conducted in the domain of breast cancer detection approaches based on the Mammography, Histopathological images, Ultrasound etc. technique [19]. This fact is very well proved with the help of Figure 2 below. Out of these, majority of approaches utilizing the Thermal images are based on the conventional machine learning and ensemble learning rather than deep learning and deep transfer learning. This fact is very well proved with the help of Figure 3 below, which illustrates the five year search results associated with the number of research and review articles published related to Breast cancer detection based on Thermography along with the application of machine learning and its subdomains for the detection as well as classification of Breast cancer as per PubMed from 2016 to 2021.
The automated breast cancer detection and classification approaches are basically divided into two broad categories i.e. one based on conventional machine learning as well as ensemble learning and other based on deep learning. The machine learning based approaches are majorly consisting of three stages i.e. segmentation, feature extraction and training of machine learning classifiers. These three stages are almost imperative in order to deliver high accuracy and good performance. A number of segmentation methods are used for the precise segregation of breast cancer i.e. region of interest (ROI) on the likes of Edge based segmentation, k-means and fuzzy c-means, Otsu’s thresholding, level-set methods, Extended Hidden Markov model etc. [20]. Now various feature extraction methods are used for the extraction of texture, statistical, histogram based features from the segmented ROI on the likes of Haralick, Gray Level Co-occurrence Matrices (GLCM) features, Gray Level run length (GLRL) etc. [20-23]. Finally the extracted features are used for the training of various conventional machine learning classifiers like Naïve Bayes (NB), Support vector machine (SVM), K nearest neighbor (KNN), Random Forest (RF), Decision tree, AdaBoost etc. [24-29] to classify the breast thermal images into either normal or abnormal cases. Mostly the accuracies of these machine learning based approaches varies in the range from 92% to 97%. Majorly the performance of these approaches mainly depends on the correct selection of segmentation methods in order to extract the ROI then followed with an accurate feature extraction method and finally the correct machine learning classifier.
Whereas the deep learning based approaches involves usage of training and tuning of deep convolutional neural networks with the aid either augmented datasets or with non-augmented datasets. These deep convolutional neural networks for breast cancer detection are either Deep Neural network, Convolutional neural networks, Recurrent Neural network or involves fine tuning of existing deep transfer learning models like ResNet18, ResNet34, ResNet50, ResNet101, ResNet152, Mobile Net, Inception Net, VGG 16, VGG 19 etc. [30-34] to classify breast cancer into normal or abnormal. These deep learning or deep transfer learning models are fully automated as they perform segmentation, feature extraction and classification directly from the training breast thermal images in order to make the predictions. Mostly the accuracies of these deep learning based approaches varies in the range from 90% to 99%. All these above mentioned state of the art machine learning and deep learning based approaches are briefly illustrated and compared with the help of Table 1.
From the literature review above, the following points can be concluded as follows:
(1) Majority of the Breast cancer detection approaches utilizing the thermography technique are based on machine learning. As deep learning and deep transfer are evolving fields and are already delivering better results in various classification task. So there is a need to develop a fully automated deep transfer learning systems for the Breast cancer detection and classification using the Thermography technique or Infrared thermal images. These fully automated systems can easily be transformed into a web application or even a mobile application so that this system can be used very easily and even by non-technical people.
(2) As it is evident from the above comparison table that almost all the approaches whether based on machine learning or deep learning have only considered the Frontal view. Although the remaining two views i.e. Left and Right if concatenated with the Frontal view can represent more information and hence generate more accurate results. So experimentation is still required to be done with these Multi view concatenated images, which might enhance the overall performance of the system.
Only a handful of approaches have considered using both the categories of thermal images for training and testing purpose. There is still scope to perform the simulation and experimentation to observe which thermal image acquisition protocols i.e. Static or Dynamic is delivering better results.
Figure 2. The search results of five years illustrating the comparison among the number of research articles published related to the Breast Mammography, Histopathological, Ultrasound and Thermography techniques as per PubMed from 2016 to 2021
Figure 3. The search results of five years illustrating the comparison among the number of research articles published related to the Breast cancer detection and classification based on Machine learning and Deep learning as per PubMed from 2016 to 2021
Table 1. Comparison among the major state of the art approaches based on conventional machine learning and Deep learning
|
Author and year |
Machine and deep learning classifier or models used |
Which view of thermal image is utilized |
Thermography Acquisition protocol used |
Results |
Datasets used |
|
Machine learning based approaches |
|||||
|
Silva et al. and 2016 [22] |
Radom Forest (RF), KNN and BayesNet models |
Frontal view only |
Dynamic |
Average Accuracy of 95.36% |
80 cases taken from the Database for Mastology Research with Infrared image (DMR-IR) [21] |
|
Lashkari et al. and 2016 [23] |
GLCM, Statistical, Histogram based, shape based features are used along with AdaBoost, SVM, KNN, NB etc. classifiers |
Frontal image of left and right breast |
- |
AdaBoost delivers best accuracy of 85.33 % on the left breast and 87.42% on the right breast |
A dataset consists of only 670 images taken with the help of Thermal camera as Thermoteknix VisIR 640 with 480 × 640 resolution |
|
Raghavendra et al. and 2016 [24] |
The HOG descriptors kernel locality preserving projection (KLPP) is used along with various classifiers like KNN, DT, NB, PNN, SVM etc. |
Frontal view only |
- |
DT delivers an accuracy of 98% |
Dataset consist of 50 women thermals from the General Hospital, Singapore obtained by using the Thermo TVS2000 MkIIST at a resolution of 1280 × 1024 |
|
Sathish et al. and 2017 [25] |
Genetic Algorithm (GA) and Random Subset Feature Selection (RSFS) methods along with Linear, Polynomial, Gaussian and quadratic SVM classifier |
Frontal view only |
Static |
Best accuracy of 91% delivered by Gaussian SVM |
100 cases are taken from DMR-IR dataset [21] |
|
Gogoi et al. and 2017 [26] |
Singular value decomposition (SVD) method along with various classifiers like DT, KNN, SVM, NB, ANN, RF, LDA and AdaBoost |
Frontal view only |
Static |
SVM delivers the best accuracy of 97.33% on DMR-IR dataset whereas ANN delivers the best accuracy of 92.5% on the Local dataset |
Two datasets are used in which one is local dataset consist of 120 thermals and other dataset is Global dataset i.e. DMR-IR consist of 287 cases thermals |
|
Santana et al. and 2018 [27] |
Multilayer Perceptron networks (MLP) and Extreme Learning Machines (ELM) |
Left, right and frontal view alone |
- |
Overall accuracy of 83% |
Local Dataset consist of 1052 thermal images collected from the University Hospital of the Federal University of Pernambuco |
|
AlFayez et al. and 2020 [28] |
Textural and geometrical features along with Extreme Learning Machine (ELM) Classifier and Multilayer Perceptron (MLP) Classifier |
Frontal view only |
Static |
ELM delivers an accuracy of 100% and MLP delivers an accuracy of 82.2% |
1345 thermal images are taken from DMR-IR dataset |
|
Karthiga et al. and 2021 [29] |
The Intensity, Statistical, geometrical and GLCM based 16 features are used along various classifiers like Logistic regression(LR), Linear SVM, Quadratic SVM, Cubic SVM, Fine Gaussian SVM, Medium Gaussian SVM, KNN etc. |
Frontal view only |
Static and Dynamic |
SVM delivers the best accuracy of 93.3%. |
DMR-IR dataset |
|
Deep learning based approaches |
|||||
|
Author and year |
Machine and deep learning classifier or models used |
Which view of thermal image is utilized |
Thermography Acquisition protocol used |
Results |
Datasets used |
|
Roslidar et al. and 2019 [30] |
ResNet101, ShuffleNetV2, DenseNet and MobileNetV2 |
Frontal view only |
Static and Dynamic |
DenseNet201 delivers an accuracy of 100% on Static and Dynamic thermal images |
DMR-IR dataset used |
|
Fernández-Ovies et al. and 2019 [31] |
ResNet18, ResNet34, ResNet50, ResNet152, VGG16 and VGG19 |
Frontal view only |
Static |
Resnet50 delivers an accuracy of 98.65% |
Dataset consist of 216 cases thermals from the DMR-IR |
|
Yadav et al. and 2020[32] |
Augmentation method along with Baseline CNN Model, VGG16, InceptionV3 |
Frontal view only |
- |
Inception V3 delivers an accuracy of 98.5% |
Dataset consist of 67 cases taken from the DMR-IR |
|
Ekici et al. and 2020 [33] |
Convolutional neural networks optimized by Bayes algorithm |
Left, Right and Frontal alone |
Static and Dynamic |
An accuracy of 98.95% |
DMR-IR dataset used |
|
Torres-Galván et al. and 2021 [34] |
ResNet-101 |
Frontal view only |
Static |
ResNet-101 delivers sensitivity 92.3% and a specificity of 53.8% |
DMR-IR dataset |
The proposed approach consists of three major stages as: Preprocessing, Augmentation and finally fine tuning as well as training of VGG16 model for performing accurate binary Breast cancer classification into normal or abnormal cases. The overall proposed approach is well illustrated with the help of the Figure 4 below:
Figure 4. The overall proposed approach based on the VGG16 for the breast cancer detection
3.1 Dataset used
The Database for Mastology Research with Infrared Image (DMR-IR) is a breast thermal images dataset used in this research study [21]. This database is a well-known and considered to be a global dataset for the researchers working in this domain as it consists of both the types of breast thermal images i.e. Static and Dynamic protocol based. This dataset consists of total 287 women thermal images along with their corresponding thermal matrices. From these 287 women around 1345 thermal images are acquired employing the FLIR SC-620 thermal camera at resolution of 640*480 with thermal sensitivity of 45mk. These women volunteers belong to the age group of 29 to 85 years. All these thermal images along with their annotations are well authenticated by the radiologist. Majorly Static thermal images are taken from five different angles, whereas Dynamic thermal images are taken in a patch of 20 each. In this research study, we have taken per patient three lateral views i.e. Left, frontal and right Static as well as Dynamic thermal images as these three views are able to cover the entire breast region. For the augmentation purpose 200 left, 200 frontal and 200 right static and same number of dynamic thermal images are taken. Whereas for the testing purpose 50 left, 50 frontal, 50 right and 50 Multi view static and dynamic breast thermal images are taken.
3.2 Preprocessing
In this stage, both the Static as well as Dynamic thermal images datasets are preprocessed employing cropping, contrast enhancement, normalization and lastly resizing. In this stage, various image artifacts are also removed to further enhance the breast thermal images. Finally with the aid of OpenCv and NumPy functions all the three breast views i.e. left, frontal and right are concatenated in order to generate a more informative Multi view thermal breast images. Post preprocessing all these thermal images are transformed into thermal images of dimensions 224*224 from the 640*480 original dimensions. This reduction in dimensions is imperative as this is the default input size of the VGG16 model and will eventually result in improved computational efficiency of proposed system. Whereas by training the proposed system with less resolution images i.e. less information images eventually helps the proposed system to optimize better in the training phase, so that it can generalize better during the testing phase and hence give accurate results. Now all these images are augmented in the next stage for creating a large size dataset for the training purpose to avoid over fitting.
3.3 Augmentation
Now both the Static and Dynamic thermal image datasets are augmented using the ImageDataGenerator function of Keras. The augmentation is considered to be an important aspect of all the deep learning based classification models as it enhances the accuracy (classification) quotient by reducing the bias factor as now the models has adequate samples to learn [35, 36]. Using the above Keras function, datasets augmentation is done utilizing data generation of 4 types like rotation range, shear range, rescaling and zoom range. After doing a number of experiments, the best values for rotation range=5, shear range=0.02, zoom range=0.02 and rescale=1./255.
3.4 The proposed fine-tuned VGG16 model
The VGG 16 is a very popular pre-trained deep transfer learning model. As the pre-trained models are more accurate and efficient as compare to the newly developed from scratch CNN architectures especially in classification tasks. The VGG16 deep transfer learning model is basically trained over the Image Net dataset consisting of more than 1.4 Crore images and hence achieves a precision of 92.7%. This VGG16 pre-trained model was initially proposed by the Karen Simonyan and Andrew Zisserman [37]. The VGG 16 pre-trained model is considered to be an improved version of its predecessor the Alex Net neural network. In VGG 16 model, there are sixteen layers segregated by five max pooling layers. This pre-trained model also consists of several 3*3 filters for better learning.
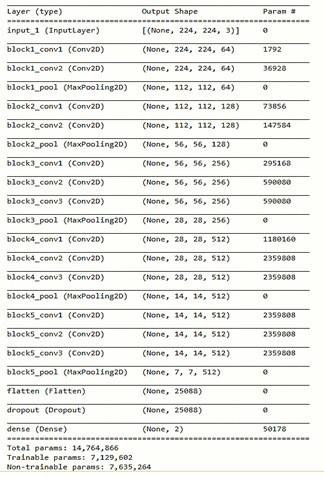
Figure 5. The proposed fine-tuned VGG16 model summary
This VGG16 pre-trained model is fine-tuned and hence delivers better results in this research study by utilizing the concept of transfer learning. The last three layers of the conventional VGG16 pre-trained model is removed and new three layers like Flatten, Dropout, and Dense are appended with the required number of neurons in the last fully connected layer. The number of neurons in the last fully connected layer totally depends on the type of classification i.e. binary or degree of multiclass and in our case its two neurons along with the softmax classifier. The rate of learning is set very high for these newly appended fully connected layers. As the remaining model except for these three layers remain unchanged and hence undergoes training with the aid of augmented Static and Dynamic thermal datasets. This model uses an Adam optimizer equipped with a rate of learning of 0.00001, 100 epochs along with batch size of 16. Both the augmented datasets are split into two sets like training (70%) and validation sets (30%). In order to check the model training performance, a validation check is undertaken each after few iterations. The model summary of the fine-tuned VGG 16 pre trained model with three added layers for the breast cancer detection is illustrated with the help of Figure 5.
The algorithm of the proposed fine-tuned VGG16 model with last three added layers as head model for the Breast cancer detection as:
Algorithm 1 (Proposed fine-tuned VGG16 model)
Input: D1←Augmented Static breast thermal dataset
D2←Augmented Dynamic breast thermal dataset
µ←Rate of learning
β←Batch size
ϵ←Number of epochs
Output: Fine-tuned VGG16 model with updated weights
Steps:
1. Both the augmented datasets are divided into the training as well as validation subsets.
2. The training sets class weights are calculated
3. Basemodel-VGG16 (weights, ImageNet)
4. Layers- VGG16 (weights, none)
5. New model- Output (basemodel)
6. Layers-Set (flatten, dropout, dense) three layers on top of VGG16 layers.
7. The hyper parameters values of µ, β, ϵ are initialized.
8. The output updated weights are stores as the result of training of VGG16 model.
9. Computation of binary cross entropy loss is done in forward propagation and
Cross Entropy = (1 − z) log (1 − p)) + (− (z log (p))
Where, z denotes correct class label and p denotes the model predicted probability.
10. As a result, the Adam optimizer is updated in back propagation.
3.5 Comparison approach
For the sake of comparison and evaluation on both the datasets i.e. Static and Dynamic breast Thermal datasets. The three popular and recent deep transfer learning (DTL) models like VGG19 [38], ResNet50 [39] and InceptionV3 [40] are used. These three DTL models are initially fine-tuned and trained using the Static and Dynamic breast thermal augmented datasets. The ultimate object of this comparison is to illustrate that how these commonly used DTL models performs on the above mentioned datasets. The common algorithm 2 for the comparison approach is given as:
Algorithm 2 (comparison approach)
Input: Augmented Static breast thermal dataset consist of normal and abnormal images
Augmented Dynamic breast thermal dataset consist of normal and abnormal images
Output: The Fine-tuned and trained VGG 19, ResNet50 and InceptionV3 models for breast cancer detection
Steps:
1. Preprocess the breast thermal images of both the datasets in order to remove the noise, symbols and artifacts.
2. Resize these thermal images to the size of 224-by-224-by 3 or 299-by-299-by 3 for the training of these VGG 19, ResNet50V2 and InceptionV3 DTL models.
3. Perform the augmentation of both these datasets using the Keras ImageDataGenerator function of four types rotation range=5, shear range=0.02, zoom range=0.02 and rescale=1./255.
4. The fine tuning and training of these four DTL models over the augmented datasets.
5. The VGG19 models tends to converge at 100 epochs.
6. The ResNet 50 and Inception tends to converge at 200 epochs.
7. Simulation and evaluation of these DTL models over the testing dataset.
The VGG19, ResNet50V2 and InceptionV3 DTL models hyper parameters values are presented with the help of Table 2. All the four deep transfer learning models are trained and evaluated with a learning rate equal to 0.00001, mini-batch size of 16 and Adam [41] is opted as an optimizer technique for the weights adjustment. Whereas the size of input image and number of epochs required to converge varies from model to model.
Table 2. The hyper parameters values of VGG19, InceptionV3 and ResNet50V2
|
DTL models parameters |
VGG19 |
InceptionV3 |
ResNet50 |
|
Input image size |
224*224 |
299*299 |
224*224 |
|
Number of layers |
19 |
48 |
50 |
|
Learning rate |
0.00001 |
0.00001 |
0.00001 |
|
Batch size |
16 |
16 |
16 |
|
Number of Epochs to converge |
100 |
200 |
200 |
|
Momentum |
0.9 |
0.9 |
0.9 |
|
Optimizer |
Adam |
Adam |
Adam |
The Google Colaboratory (colab) platform along with the Python 3.6 as an implementation programming language is used for the experimentation and simulation in this study. This result section is subdivided into two sections. In the first section, the performance of the proposed approach based on VGG16 model is presented using various statistical parameters or classification rates on the Multi view as well as on the single view breast thermal images. As the Static and Dynamic breast thermal images testing datasets are prior developed from the DMR-IR database and consist of 50 breast thermal images of Multi view, Left, right and frontal each. The statistical parameters or classification rates used are Accuracy, Sensitivity, Specificity, Precision, Negative Predictive Value, False Positive Rate, False Discovery Rate, False Negative Rate, Accuracy and F1 Score. These classification rates are well formulated in the Table 3 and 4 below, which also illustrates the performance of the proposed approach over both the Static and Dynamic breast thermal images testing datasets. The training and validation graph along with training loss curve and ROC curve of proposed approach are presented with help of Figure 6 below.
Table 3. The performance of the proposed approach based on VGG16 on the Static breast thermal images testing dataset
|
Training Accuracy over 70% augmented Static dataset |
100% |
|||||
|
Validation Accuracy over 30% augmented Static dataset |
98% |
|||||
|
Static breast thermal images testing dataset |
||||||
|
Classification rates |
Their formulas |
Static Multi-view Breast thermal view image |
Static Left Breast thermal view image |
Static Right Breast thermal view image |
Static Frontal Breast thermal view image |
|
|
Accuracy |
(TP + TN) / (TP +TN+FP+FN) |
98 |
83 |
87 |
93 |
|
|
Sensitivity |
TP / (TP + FN) |
98 |
82.35 |
87.76 |
95.74 |
|
|
Specificity |
TN / (FP + TN) |
98 |
83.67 |
86.27 |
90.57 |
|
|
Precision |
TP / (TP + FP) |
98 |
84 |
86 |
90 |
|
|
Negative Predictive Value |
TN / (TN + FN) |
98 |
82 |
88 |
96 |
|
|
False Positive Rate |
FP / (FP + TN) |
2 |
16.33 |
13.73 |
9.43 |
|
|
False Discovery Rate |
FP / (FP + TP) |
2 |
16 |
14 |
10 |
|
|
False Negative Rate |
FN / (FN + TP) |
2 |
17.65 |
12.24 |
4.26 |
|
|
F1 Score |
2TP / (2TP + FP + FN) |
98 |
83.17 |
86.87 |
92.78 |
|
|
Where TP = True positive, TN = True Negative, FP = False Positive, FN = False Negative |
||||||
Table 4. The performance of the proposed approach based on VGG16 on the dynamic breast thermal images testing dataset
|
Training Accuracy over 70% augmented Dynamic dataset |
100% |
|||
|
Validation Accuracy over 30% augmented Dynamic dataset |
98.7% |
|||
|
Dynamic breast thermal testing dataset |
||||
|
Classification rates |
Dynamic Multi-view Breast thermal view image |
Dynamic Left Breast thermal view image |
Dynamic Right Breast thermal view image |
Dynamic Frontal Breast thermal view image |
|
Accuracy |
99 |
85 |
87 |
94 |
|
Sensitivity |
98.04 |
84.31 |
86.27 |
95.83 |
|
Specificity |
100 |
85.71 |
87.76 |
92.31 |
|
Precision |
100 |
86 |
88 |
92 |
|
Negative Predictive Value |
98 |
84 |
86 |
96 |
|
False Positive Rate |
0 |
14.29 |
12.24 |
7.69 |
|
False Discovery Rate |
0 |
14 |
12 |
8 |
|
False Negative Rate |
1.96 |
15.69 |
13.73 |
4.17 |
|
F1 Score |
99.01 |
85.15 |
87.13 |
93.88 |
Figure 6. The ROC curve, training loss curve and training & validation accuracy graph of the proposed approach based on VGG16 model on the Static breast thermal testing dataset is represented by a, b, c and on the Dynamic breast thermal images testing dataset is represented by d, e, f
Table 5. The performance of the VGG19 DTL models over static and dynamic breast thermal images testing dataset
|
Classification rates |
Multi-view Breast thermal view image |
Left Breast thermal view image |
Right Breast thermal view image |
Frontal Breast thermal view image |
||||
|
Static |
Dynamic |
Static |
Dynamic |
Static |
Dynamic |
Static |
Dynamic |
|
|
Accuracy |
95 |
96 |
82 |
83 |
86 |
88 |
89 |
90 |
|
Sensitivity |
94.12 |
96 |
83.3 |
83.67 |
89.13 |
91.3 |
91.4 |
91.67 |
|
Specificity |
95.92 |
96 |
80.7 |
82.35 |
83.3 |
85.19 |
86.7 |
88.46 |
|
Precision |
96 |
96 |
80 |
82 |
82 |
84 |
86 |
88 |
|
Negative Predictive Value |
94 |
96 |
84 |
84 |
90 |
92 |
92 |
92 |
|
False Positive Rate |
4.08 |
4 |
19.2 |
17.6 |
16.6 |
14.8 |
13.2 |
11.5 |
|
False Discovery Rate |
4 |
4 |
20 |
18 |
18 |
16 |
14 |
12 |
|
False Negative Rate |
5.8 |
4 |
16.6 |
16.3 |
10.8 |
8.7 |
8.5 |
8.3 |
|
F1 Score |
95.05 |
96 |
81.6 |
82.8 |
85.4 |
87.5 |
88.6 |
89.8 |
Table 6. The performance of the ResNet 50V2 DTL models over static and dynamic breast thermal images testing dataset
|
Classification rates |
Multi-view Breast thermal view image |
Left Breast thermal view image |
Right Breast thermal view image |
Frontal Breast thermal view image |
||||
|
Static |
Dynamic |
Static |
Dynamic |
Static |
Dynamic |
Static |
Dynamic |
|
|
Accuracy |
94 |
95 |
81 |
82 |
82 |
83 |
90 |
91 |
|
Sensitivity |
94 |
94.12 |
80.39 |
82 |
83.3 |
83.67 |
95.4 |
93.6 |
|
Specificity |
94 |
95.9 |
81.6 |
82 |
80.7 |
82.35 |
85.7 |
88.68 |
|
Precision |
94 |
96 |
82 |
82 |
80 |
82 |
84 |
88 |
|
Negative Predictive Value |
94 |
94 |
80 |
82 |
84 |
84 |
96 |
94 |
|
False Positive Rate |
6 |
4.08 |
18.3 |
18 |
19.23 |
17.6 |
14.29 |
11.3 |
|
False Discovery Rate |
6 |
4 |
18 |
18 |
20 |
18 |
16 |
12 |
|
False Negative Rate |
6 |
5.8 |
19.6 |
18 |
16.67 |
16.3 |
4.5 |
6.38 |
|
F1 Score |
94 |
95.05 |
81.19 |
82 |
81.6 |
82.8 |
89.39 |
90.7 |
Table 7. The performance of the InceptionV3 DTL models over static and dynamic breast thermal images testing dataset
|
Classification rates |
Multi-view Breast thermal view image |
Left Breast thermal view image |
Right Breast thermal view image |
Frontal Breast thermal view image |
||||
|
Static |
Dynamic |
Static |
Dynamic |
Static |
Dynamic |
Static |
Dynamic |
|
|
Accuracy |
89 |
91 |
80 |
82 |
81 |
83 |
84 |
85 |
|
Sensitivity |
89.8 |
91.8 |
82.6 |
84.78 |
82.98 |
86.67 |
88.6 |
88.8 |
|
Specificity |
88.24 |
90.2 |
77.7 |
79.63 |
79.2 |
80 |
80.36 |
81.8 |
|
Precision |
88 |
90 |
76 |
78 |
78 |
78 |
78 |
80 |
|
Negative Predictive Value |
90 |
92 |
84 |
86 |
84 |
88 |
90 |
90 |
|
False Positive Rate |
11.76 |
9.8 |
22.2 |
20.37 |
20.75 |
20 |
19.6 |
18.18 |
|
False Discovery Rate |
12 |
10 |
24 |
22 |
22 |
22 |
22 |
20 |
|
False Negative Rate |
10.2 |
8.16 |
17.39 |
15.2 |
17.02 |
13.3 |
11.36 |
11.1 |
|
F1 Score |
88.9 |
90.9 |
79.17 |
81.25 |
80.41 |
82.1 |
82.9 |
84.21 |
Figure 7. The ROC curve, training loss and training & validation accuracy graph of the comparison approach based on VGG19 model on the Static breast thermal dataset is represented by a, b, c and on the Dynamic breast thermal images dataset is represented by d, e, f
Figure 8. The ROC curve, training loss and training & validation accuracy graph of the comparison approach based on ResNet50V2 model on the Static breast thermal dataset is represented by a, b, c and on the Dynamic breast thermal images dataset is represented by d, e, f
The performance of three majorly used deep transfer learning models i.e. VGG 19, ResNet 50V2 and InceptionV3 on the Multi-view as well as on the single view breast thermal images of both the Static and Dynamic testing datasets are presented with the help of Table 5, 6, and 7. Whereas the ROC curve, training loss curve and training & validation accuracy graph of these DTL models are illustrated with the help of Figure 7, 8 and 9. The performance of these three DTL models is inferior as compare to the proposed approach based on the VGG 16 model. The GUI screenshot of the working Deep Multi-view Breast cancer Detect system is illustrated with the help of Figure 10 below.
Figure 9. The ROC curve, training loss and training & validation accuracy graph of the comparison approach based on InceptionV3 model on the Static breast thermal dataset is represented by a, b, c and on the Dynamic breast thermal images dataset is represented by d, e, f
Figure 10. GUI screenshot of the working deep multi-view breast cancer detection system
This approach will help in performing the early breast cancer screening. Even there are certain researches carried out in the past that claims that the thermography technique is quite capable of detecting the breast abnormalities prior development of breast cancer [42]. As the proposed system based on VGG16 is trained with both the normal as well as abnormal breast thermal images. It is quite evident from the Figure 1 above that the abnormal breast thermal images are possessing characteristics or features like asymmetric heat patterns in both the breast regions. Another major characteristic or feature persisting in almost all the breast cancer or abnormal breast thermal images is the presence of shape asymmetry quotient in between the left and right Breasts of a patient. Whereas in case of normal breast thermal images, the features like presence of symmetric heat patterns and shape symmetry in between both the left and right breast regions. So the VGG 16 model layers are majorly learning features like asymmetric heat patterns along with shape asymmetry from abnormal breast thermal training images as well as learning features like symmetric heat patterns and shape symmetry from the normal training images in order to perform correct classification.
The Multi-view thermal infrared images are proved to be much more accurate in terms of classifying the breast abnormality as they offer more information to the deep transfer learning models. The proposed approach tends to deliver better results over the Dynamic breast thermal infrared images as compare to the static images. Although the difference is very minute but these dynamic images are more accurate in terms of detecting the breast abnormality as it is clearly showcased by the result section. The VGG16 deep transfer learning model tends to converges at 100 epochs and after that the training accuracy is not improving. The proposed approach based on VGG 16 model offers another advantage as it trained faster as compare to the counterpart ResNet50 and Inception V3. As these two deep transfer learning models tends to converges at 200 epochs and hence consumes more time for training and validation.
Whereas the VGG16 model also tends to converges at 100 epochs just like VGG19 but offers high validation as well as testing accuracy.
The proposed Deep Multi-view Breast cancer Detection system based on VGG16 DTL model in comparison to the conventional machine learning based Breast cancer detection systems are technically much superior because of the following reasons:
(1) The state of the art machine learning based breast cancer detection systems proposed in the fast are computationally very expensive and also needs more training samples in order to deliver better performance. Whereas the proposed VGG16 based system is computationally efficient as it’s converges at just 100 epochs and also delivers high accuracy on the smaller training datasets of both the Static and Dynamic protocol based breast thermal images.
(2) The proposed system based on VGG16 as a pre trained deep transfer learning model over the Image Net dataset [37] and hence uses this knowledge (features, weights, etc.) in order to perform the better classification of breast cancer abnormality in this research study. Whereas the conventional machine learning based approaches are training the classifiers in an isolated manner and are lacking any sort of knowledge.
(3) The proposed Breast cancer detection system based on VGG16 is fully automated and hence less complex to develop and operate. Whereas the conventional machine learning based approaches are complex to develop as these required selection of proper segmentation methods, feature extraction method and finally the type of classifiers to be used for classification. The conventional machine learning approach only tends to delivered good results if these selected methods and classifiers are working well with each other and hence quite complex to develop.
(4) The proposed VGG16 deep transfer learning system is also offering optimal training performance because it leverages knowledge (weights, features) from the previously trained models. Whereas the traditional machine learning based breast cancer detection could have taken more training time.
To the best of our knowledge, this Deep Multi-view Breast cancer Detection system is the first system to have introduced as well as utilized the concept of Multi view breast thermal images for the classification of breast cancer abnormality. Apart from this, the major contributions of this research study are stated below as:
(1) This research study simply proves that the concatenated multi view breast thermal images tends to deliver high accuracy as they offer more information to the Deep Multi view Breast cancer Detect system for performing the classification.
(2) This Deep Multi-view Breast cancer Detect system tends to delivers better results with the help of Dynamic breast multi view as well as single view thermal images as compare to the Static breast thermal images. So Dynamic breast thermal images are proved to be more effective as compare to Static thermal images for the detection of breast cancer abnormality in general.
(3) Apart from the concatenated multi view breast thermal images, it’s the single view frontal breast thermal images which also delivers satisfactory results. Whereas the single view left and right breast thermal images are not that much effective for the detection of breast cancer abnormality as they both offers least testing accuracies values.
(4) The Deep Multi-view Breast cancer Detect system based on tuned VGG16 tends to outperform the other majorly used DTL models i.e. VGG19, ResNet50V2 and InceptionV3 even though these DTL models are more complex and delivers better results in other medical imaging classification task.
(5) The proposed Deep Multi-view Breast cancer Detect system achieves testing accuracies of 99% and 98% with concatenated Dynamic as well as Static multi view breast thermal.
The future work involves the development of large size Breast thermal dataset along with the clinical information of each women volunteer, so this clinical information can also be taken into account for the classification. Apart from this, the quotient of utilizing this Multi view breast thermal images could be used in future along with other advanced 3D CNN networks as well DTL models for further enhancing the accuracy and robustness.
[1] Duffy, S.W., Tabár, L., Yen, A.M., Dean, P.B., Smith, R.A., Jonsson, H., Törnberg, S., Chiu, S.Y., Chen, S.L., Jen, G.H., Ku, M.M. (2021). Benecial effect of consecutive screening mammography examinations on mortality from breast cancer: A prospective study. Radiology, 299(3): 541-547. https://doi.org/10.1148/radiol.2021203935
[2] Sung, H., Ferlay, J., Siegel, R.L., Laversanne, M., Soerjomataram, I., Jemal, A., Bray, F. (2021). Global cancer statistics 2020: GLOBOCAN estimates of incidence and mortality worldwide for 36 cancers in 185 countries. CA: A Cancer Journal for Clinicians, 71(3): 209-249. https://doi.org/10.3322/caac.21660
[3] Xu, X., Yuan, X., Ni, J., Guo, J., Gao, Y., Yin, W., Li, F., Wei, L., Zhang, J. (2021). MAGI2-AS3 inhibits breast cancer by downregulating DNA methylation of MAGI2. Journal of Cellular Physiology, 236(2): 1116-1130. https://doi.org/10.1002/jcp.29922
[4] Jahan, N., Jones, C., Rahman, R.L. (2021). Endocrine prevention of breast cancer. Molecular and Cellular Endocrinology, 530: 111284. https://doi.org/10.1016/j.mce.2021.111284
[5] Allweis, T.M., Hermann, N., Berenstein-Molho, R., Guindy, M. (2021). Personalized screening for breast cancer: rationale, present practices, and future directions. Annals of Surgical Oncology, 1-12. https://doi.org/10.1245/s10434-020-09426-1
[6] Ter-Minassian, M., Schaeffer, M.L., Jefferson, C.R., Shapiro, S.C., Suwannarat, P., Visvanathan, K. (2021). Screening and preventative strategies for patients at high risk for breast cancer. JCO Oncology Practice, 17(4): e575-e581. https://doi.org/10.1200/OP.20.00262
[7] Aruleba, K., Obaido, G., Ogbuokiri, B., Fadaka, A.O., Klein, A., Adekiya, T.A., Aruleba, R.T. (2020). Applications of computational methods in biomedical breast cancer imaging diagnostics: A review. Journal of Imaging, 6(10): 105. https://doi.org/10.3390/jimaging6100105
[8] Hakim, A., Awale, R.N. (2020). Thermal imaging-an emerging modality for breast cancer detection: A comprehensive review. Journal of Medical systems, 44(8): 1-18. https://doi.org/10.1007/s10916-020-01581-y
[9] Mambou, S.J., Maresova, P., Krejcar, O., Selamat, A., Kuca, K. (2018). Breast cancer detection using infrared thermal imaging and a deep learning model. Sensors, 18(9): 2799. https://doi.org/10.3390/s18092799.
[10] Zuluaga-Gomez, J., Al Masry, Z., Benaggoune, K., Meraghni, S., Zerhouni, N. (2021). A CNN-based methodology for breast cancer diagnosis using thermal images. Computer Methods in Biomechanics and Biomedical Engineering: Imaging & Visualization, 9(2): 131-145. https://doi.org/10.1080/21681163.2020.1824685
[11] González, F.J., González, R., López, J.C. (2019). Thermal contrast of active dynamic thermography versus static thermography. Biomedical Spectroscopy and Imaging, 8(1-2): 41-45. https://doi.org/10.3233/BSI-190188
[12] Roslidar, R., Rahman, A., Muharar, R., Syahputra, M.R., Arnia, F., Syukri, M., Pradhan, B., Munadi, K. (2020). A review on recent progress in thermal imaging and deep learning approaches for breast cancer detection. IEEE Access, 8: 116176-116194. https://doi.org/10.1109/ACCESS.2020.3004056
[13] Bhattacharya, S., Maddikunta, P.K.R., Pham, Q.V., Gadekallu, T.R., Krishnan S.S.R., Chowdhary, C.L., Alazab, M., Piran, M.J. (2021). Deep learning and medical image processing for coronavirus (COVID-19) pandemic: A survey. Sustainable Cities and Society, 65, 102589. https://doi.org/10.1016/j.scs.2020.102589
[14] Chougrad, H., Zouaki, H., Alheyane, O. (2018). Deep convolutional neural networks for breast cancer screening. Computer Methods and Programs in Biomedicine, 157: 19-30. https://doi.org/10.1016/j.cmpb.2018.01.011
[15] Patil, R.S., Biradar, N. (2020). Automated mammogram breast cancer detection using the optimized combination of convolutional and recurrent neural network. Evolutionary Intelligence, 1-16. https://doi.org/10.1007/s12065-020-00403-x
[16] Melekoodappattu, J.G., Subbian, P.S. (2020). Automated breast cancer detection using hybrid extreme learning machine classifier. Journal of Ambient Intelligence and Humanized Computing, 1-10. https://doi.org/10.1007/s12652-020-02359-3
[17] Chen, C., Wang, Y., Niu, J., Liu, X., Li, Q., Gong, X. (2021). Domain knowledge powered deep learning for breast cancer diagnosis based on contrast-enhanced ultrasound videos. IEEE Transactions on Medical Imaging. https://doi.org/10.1109/TMI.2021.3078370
[18] Pang, T., Wong, J.H.D., Ng, W.L., Chan, C.S. (2020). Deep learning radiomics in breast cancer with different modalities: Overview and future. Expert Systems with Applications, 158: 113501. https://doi.org/10.1016/j.eswa.2020.113501
[19] Husaini, M.A.S.A., Habaebi, M.H., Hameed, S.A., Islam, M.R., Gunawan, T.S. (2020). A systematic review of breast cancer detection using thermography and neural networks. IEEE Access, 8: 208922-208937. https://doi.org/10.1109/ACCESS.2020.3038817
[20] Singh, D., Singh, A.K. (2020). Role of image thermography in early breast cancer detection- Past, present and future. Computer Methods and Programs in Biomedicine, 183: 105074. https://doi.org/10.1016/j.cmpb.2019.105074
[21] Silva, L.F., Saade, D.C.M., Sequeiros, G.O., Silva, A.C., Paiva, A.C., Bravo, R.S., Conci, A. (2014). A new database for breast research with infrared image. Journal of Medical Imaging and Health Informatics, 4(1): 92-100. https://doi.org/10.1166/jmihi.2014.1226
[22] Silva, L.F., Santos, A.A.S., Bravo, R.S., Silva, A.C., Muchaluat-Saade, D.C., Conci, A. (2016). Hybrid analysis for indicating patients with breast cancer using temperature time series. Computer Methods Programs Biomed, 130: 142-153. https://doi.org/10.1016/j.cmpb.2016.03.002
[23] Lashkari, A., Pak, F., Firouzmand, M. (2016). Full intelligent cancer classification of thermal breast images to assist physician in clinical diagnostic applications. Journal of Medical Signals and Sensors, 6(1): 12.
[24] Raghavendra, U., Rajendra Acharya, U., Ng, E.Y.K., Tan, J.H., Gudigar, A. (2016). An integrated index for breast cancer identification using histogram of oriented gradient and kernel locality preserving projection features extracted from thermograms. Quantitative InfraRed Thermography Journal, 13(2): 195-209. https://doi.org/10.1080/17686733.2016.1176734
[25] Sathish, D., Kamath, S., Prasad, K., Kadavigere, R. (2019). Role of normalization of breast thermogram images and automatic classification of breast cancer. The Visual Computer, 35(1): 57-70. https://doi.org/10.1007/s00371-017-1447-9
[26] Gogoi, U.R., Bhowmik, M.K., Bhattacharjee, D., Ghosh, A.K. (2018). Singular value based characterization and analysis of thermal patches for early breast abnormality detection. Australasian Physical & Engineering Sciences in Medicine, 41(4): 861-879. https://doi.org/10.1007/s13246-018-0681-4
[27] Santana, M.A., Pereira, J.M.S., Silva, F.L., Lima, N.M., Sousa, F.N., Arruda, G.M.S., Santos, W.P. (2018). Breast cancer diagnosis based on mammary thermography and extreme learning machines. Research on Biomedical Engineering, 34(1): 45-53. https://doi.org/10.1590/2446-4740.05217
[28] AlFayez, F., El-Soud, M.W.A., Gaber, T. (2020). Thermogram breast cancer detection: A comparative study of two machine learning techniques. Applied Sciences, 10(2): 551. https://doi.org/10.3390/app10020551
[29] Karthiga, R., Narasimhan, K. (2021). Medical imaging technique using curvelet transform and machine learning for the automated diagnosis of breast cancer from thermal image. Pattern Analysis and Applications, 24: 981-991. https://doi.org/10.1007/s10044-021-00963-3
[30] Roslidar, R., Saddami, K., Arnia, F., Syukri, M., Munadi, K. (2019). A study of fine-tuning CNN models based on thermal imaging for breast cancer classification. In 2019 IEEE International Conference on Cybernetics and Computational Intelligence (CyberneticsCom), Banda Aceh, Indonesia, pp. 77-81. https://doi.org/10.1109/CYBERNETICSCOM.2019.8875661
[31] Fernández-Ovies, F.J., Alférez-Baquero, E.S., de Andrés-Galiana, E.J., Cernea, A., Fernández-Muñiz, Z., Fernández-Martínez, J.L. (2019). Detection of breast cancer using infrared thermography and deep neural networks. In International Work-Conference on Bioinformatics and Biomedical Engineering, pp. 514-523. https://doi.org/10.1007/978-3-030-17935-9_46
[32] Yadav, S.S., Jadhav, S.M. (2020). Thermal infrared imaging based breast cancer diagnosis using machine learning techniques. Multimedia Tools and Applications, 1-19. https://doi.org/10.1007/s11042-020-09600-3
[33] Ekici, S., Jawzal, H. (2020). Breast cancer diagnosis using thermography and convolutional neural networks. Medical Hypotheses, 137: 109542. https://doi.org/10.1016/j.mehy.2019.109542
[34] Torres-Galván, J.C., Guevara, E., Kolosovas-Machuca, E.S., Oceguera-Villanueva, A., Flores, J.L., González, F.J. (2021). Deep convolutional neural networks for classifying breast cancer using infrared thermography. Quantitative InfraRed Thermography Journal, 1-12. https://doi.org/10.1080/17686733.2021.1918514
[35] Perez, L., Wang, J. (2017). The effectiveness of data augmentation in image classification using deep learning. arXiv preprint arXiv:1712.04621. https://arxiv.org/abs/1712.04621
[36] Roth, H.R., Lee, C.T., Shin, H.C., Seff, A., Kim, L., Yao, J., Lu, L., Summers, R.M. (2015). Anatomy-specific classification of medical images using deep convolutional nets. In: IEEE 12th International Symposium on Biomedical Imaging (ISBI), Brooklyn, NY, USA, pp. 101-104. https://doi.org/10.1109/ISBI.2015.7163826
[37] Simonyan, K., Zisserman, A. (2014). Very deep convolutional networks for large-scale image recognition. arXiv preprint arXiv:1409.1556. https://arxiv.org/abs/1409.1556
[38] Liu, T., Wang, Z. (2019). HiCNN: A very deep convolutional neural network to better enhance the resolution of Hi-C data. Bioinformatics, 35(21): 4222-4228. https://doi.org/10.1093/bioinformatics/btz251
[39] He, K., Zhang, X., Ren, S., Sun, J. (2016). Deep residual learning for image recognition. In Proceedings of the IEEE Conference on Computer Vision and Pattern Recognition, pp. 770-778. https://doi.org/10.1109/CVPR.2016.90
[40] Szegedy, C., Liu, W., Jia, Y., Sermanet, P., Reed, S., Anguelov, D., Erhan, D., Vanhoucke, V., Rabinovich, A. (2015). Going deeper with convolutions. In: IEEE Conference on Computer Vision and Pattern Recognition (CVPR), pp. 1-9.
[41] Kingma, D.P., Ba, J. (2015). Adam: A method for stochastic optimization. arXiv:1412.6980.
[42] Lozano III, A., Hassanipour, F. (2019). Infrared imaging for breast cancer detection: An objective review of foundational studies and its proper role in breast cancer screening. Infrared Physics & Technology, 97: 244-257. https://doi.org/10.1016/j.infrared.2018.12.017