Cüneyt Ozdemir* | Mehmet Ali Gedik | Yılmaz Kaya
© 2021 IIETA. This article is published by IIETA and is licensed under the CC BY 4.0 license (http://creativecommons.org/licenses/by/4.0/).
OPEN ACCESS
Bone age is estimated in pediatric medicine for medical and legal purposes. In pediatric medicine, it aids in the growth and development assessment of various diseases affecting children. In forensic medicine, it is required to determine criminal liability by age, refugee age estimation, and child-adult discrimination. In such cases, radiologists or forensic medicine specialists conduct bone age estimation from left hand-wrist radiographs using atlas methods that require time and effort. This study aims to develop a computer-based decision support system using a new modified deep learning approach to accelerate radiologists' workflow for pediatric bone age estimation from wrist radiographs. The KCRD dataset created by us was used to test the proposed method. The performance of the proposed modified IncepitonV3 model compared to IncepitonV3, MobileNetV2, EfficientNetB7 models. Acceptably high results (MAE=4.3, RMSE=5.76, and R2=0.99) were observed with the modified IncepitonV3 transfer deep learning method.
bone age estimation, CNN, computer-aided diagnosis, deep learning
Advances in medical technologies have provided great convenience to clinicians to increase quality and efficiency in healthcare. Computer vision-based biomedical imaging applications give the radiologists preliminary information that provides more efficient workflow and high accuracy in diagnosis [1].
Age determination is one of the most critical elements of identification. The most commonly used method in age determination is bone age (BA) assessment [1].
BA is among the biological and structural maturity indicators and shows development and maturity better than chronological age. The degree of maturation of bones is described as BA. Clinicians compare hand-wrist radiographs of the individual with standardized radiographs in atlases to determine the BA. The BA is the same as the chronological age with normal bone maturation [2, 3].
Age determination according to bone development is the most commonly used method. But there are many factors affecting BA, such as environmental and geographical factors, gender, race, endocrine disorders (hypothyroidism, congenital adrenal hyperplasia, and puberty precocious), nutritional disorders, congenital disorders, congenital syndromes, constitutional growth retardation [4, 5].
BA assessment is traditionally performed using atlas methods consisting of left-hand wrist radiographs. However, recently, experimental methods have been developed with ultrasonography, magnetic resonance, and computed tomography images [6, 7].
In our country, the determination of BA is made by using the Gök atlas adapted from Greulich and Pyle (G-P) atlas. However, no widely accepted age determination atlas is based on our citizens in our country [8].
While radiographs of the left-hand wrist, elbow, shoulder, and pelvis are used in the Gök atlas, only left-hand wrist radiographs are used in GP and TW methods. In a study conducted in our country, 45% of the forensic medicine specialists use the Gök atlas, 21.7% the GP method, and 17.4% the TW method [4, 5].
GP atlas is the most widely used method in the world. It was first published in 1950 and renewed in 1988. Atlas contains standardized pictures of the left-hand wrist for both genders with a 1-year interval. BA of the individual is determined by the matching reference images in the left-hand wrist radiography atlas.
The TW method was created with the data set obtained from the left-hand wrist x-rays of children with middle socioeconomic status in England. In this method, the radius, ulna, carpal bones, and 13 hand bones are evaluated. Some of these bones are classified as A-I, and a total numerical value is created. According to this value, BA is determined from the reference value suitable for age and gender [9].
When the literature studies are examined, it is seen that many studies make age estimations from wrist radiographs. Among these models, it has been observed that the method that finds the age estimation closest to the truth is machine learning models.
Radiographs of the left hand are used in BA assessment because the non-dominant hand is usually on the left. Analyzing BA using this imaging method is preferred because of its simplicity, minimal radiation, and availability of more than one ossification center. The GP method is used most frequently in the world. The TW method is less preferred because it takes a longer time.
Automated methods are being developed to evaluate hand and wrist radiographs, which reduces inter-rater variability compared to manual methods. Non-radiation-based techniques for visualizing hand and wrist bones, such as ultrasonography for BA calculation, have been developed [10]. It requires intensive labor and highly trained professionals such as pediatric radiologists with a lot of experience to read and infer from such images [10]. It has been seen to be used in deep learning techniques in recent years.
In this study, we aim to estimate the age from wrist radiographs using deep learning methods. A decision support system was developed to help radiologists to speed up their work for pediatric BA estimation.
We used deep transfer methods, which are InceptionV3, EfficientNet, MobileNetV2, and modified InceptionV3. These transfer learning models are preferred because the inception v3 model is used extensively in bone age determination. Other models are selected because they are very similar to the InceptionV3 model in terms of parameter numbers.
Two different data sets, one newly formed by us and one used publicly were used to test deep learning methods. The new data set consists of images from hand-wrist graphs obtained from 4 different hospitals in Kütahya (Kütahya Child Radiology Dataset-KCRD).
Since the KCRD consists of images obtained from different hospitals and different x-ray devices, the contrast and brightness settings of the images were mixed and different from each other. Age range was between 8-216 months. The images in an age between 0-7 months have been removed since the number of images for that range was very low. The lack of a large-scale study with a dataset consisting of Turkish people is one of the main factors that led us to conduct the study.
The contribution of this study:
(1) A new data set for a different environment and geography was created. In addition to that, a publicly distributed data set is used. The effects of a different environment and geography on BA estimation are examined using the same deep learning methods on two data sets.
(2) A modified transfer deep learning approach has been proposed for bone age estimation.
(3) Our study revealed that different environments and geographies are an essential factor and affect bone development. So, using deep learning models may decrease this difference among data sets.
(4) The methods used for age determination are old, manual, and questionable. These methods cause time and labor loss. We aim to help this situation by using digital technologies.
(5) This study was carried out to reduce the time spent by physicians and forensic medicine specialists in age determination and to assist the experts in age determination by developing an up-to-date, fast, practical, economical, location-independent, and accessible decision support system following today's conditions.
There are machine learning-based approaches in the literature for BAA. In recent years, deep learning methods have been frequently used in BAA. Reddy et al. [11] tried to estimate the BA from radiographs using only the index finger instead of the whole hand. Their study resulted in a mean absolute difference ranging from 4.7 to 5.1 months for the reference and CNN BA for the entire hand and index finger. In addition, the results of the BA determination for the CNN model and the radiologist on single-finger radiography images vary in a range of 8 months.
Bui et al. [12] tried to find BA by using deep learning with the TW3 method in their research. They determined the BA in years with an absolute error rate of 0.59.
Iglovikov et al. [13] estimated bone age using machine learning methods from the Radiology Society of North America dataset containing 12600 radiological images with a mean absolute error (MAE) rate of 4.97 months.
Kashif et al. [14] used the SIFT, SURF, BRIEF, BRISK, and FREAK feature descriptors in the epiphyseal regions (eROI) for key points selection in hand radiographs. Features were extracted and BA was estimated using the support vector machine classification method. The data are divided into 30 classes representing the BA range between 0-18 years. Intensive SIFT worked best, with an average error of 0.605 years.
Larson et al. [15] used deep learning methods to estimate BA. Their dataset contains 14036 hand radiographs from two pediatric hospitals. BAs were assessed with the RMSE error of 0.61.
Lee et al. [16] developed a decision support system using deep learning methods to estimate BA from radiographs, producing 57.32% and 61.40% correct estimates for women and men.
Hao et al. [17] have developed a BAA method with an average deviation/error of 2.75 months. They estimated skeletal age of young children with a regression-based convolutional neural network by performing border extraction of carpal bones. They used an automated and efficient approach with a regression convolutional neural network and region of interest (ROI).
On open-source 1391 x-ray images, Spampinato et al. [18] estimated skeletal BA. They tested several deep learning methods (OverFeat, GoogLeNet, and OxfordNet) and a custom Bonet trained from scratch. They estimated the BA with an MAE rate of approximately 9.6 months.
Son et al. [19] tried to estimate BA by focusing on thirteen different points of the epiphysis-metaphyseal growth zones in the bone using the deep learning method with a 5.62 Mean Absolute Error (MAE) and 7.44 Root Mean Square Error (RMSE).
In their study, Chen et al. [20] tried to determine BA by extracting two attributes from lbp, glcm, and deep learning methods to assess BA through X-ray image recognition. They showed that the deep neural network-based feature extraction method could extract feature information better than the traditional image analysis.
Castillo et al. [21] used the RSNA dataset in their study to estimate BA using the VGG-16 model. The MAE result found 9.82 months for males and 10.75 months for females.
Wang et al. [22] used the Faster R-CNN network to classify radius and ulna bones seen in x-ray pictures to assess BA. 600 information was used for both the radius and ulna bones. Classification accuracy of 92% for radius and 90% for ulna was achieved.
Liu et al. [23] tried a different method of pre-processing to estimate BA. Before the deep learning model training, they applied a non-subsampled contourlet transform (NSCT) to the pictures and found an RMSE value of 8.28.
In the study of Han and Wang [24], the ResNet model in the deep learning algorithm detected the BA better than traditional methods, with a MAE of 0.455. When the learning rate is more significant than 0.0005, the Inception Resnet v2 model's MAE is higher than most models.
Shin et al. [25] studied the clinical efficacy of a TW3-based fully automated BAA system of Korean children and adolescents. The study was conducted on 80 subjects, consisting of 40 males and 40 females between 7-15 years. They obtained a result with a confidence interval of 95% and P> 0.05. Table 3 summarizes different studies and the results.
We used two different data sets for BA estimation. The first is the data set KCRD created by us and the other is the publicly available RSNA data set.
Ethics approval was sought through the non-interventional clinical research ethics committee (Ref. No. 2021/07-20).
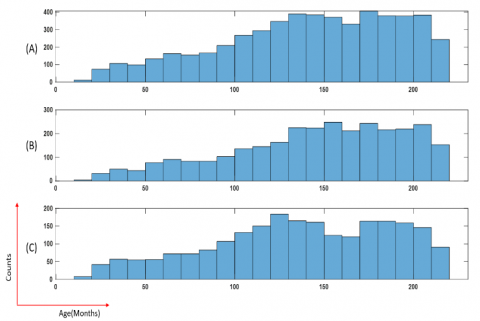
Figure 1. Age distribution in the KCRD data set. (A) Full data set, (B) Distribution of males, (C) Distribution of females
Figure 2. Age distribution in the RSNA data set. (A) Full dataset, (B) Distribution of males, (C) Distribution of females
KCRD (Kütahya Child Radiology Dataset): Images were obtained from 4 different hospitals in Kütahya, 3 districts, and 1 provincial center. It contains 5305 hand-wrist radiographs totally for both genders. The age range is between 0 and 18 years. Images were taken from the hospital Picture Archiving and Communication System (PACS) from the patients who were admitted to the emergency department between 2013-2021. X-ray devices are CR (computerized radiography) and DR (digital radiography). The brightness and contrast settings are different in some radiographs due to x-ray devices being from different centers. The images obtained from the picture archiving and communication system in DICOM (Digital Imaging and Communications in Medicine) format. Physician or technician information embedded in X-ray images was removed. Patient information is anonymized in all pictures. Chronological age and gender information were also recorded. This range was excluded from the data set because there were very few radiographic images in the 0-7 month range. Age distributions in the KCRD data set are shown in Figure 1.
RSNA: It is a publicly available data set used in the Radiology Association of North America (RSNA) competition in 2017. It contains 12611 radiographs from different hospitals [22]. The distribution of the images by age and gender in the RSNA data set is given in Figure 2.
The distribution of the images in the two data sets by gender is given in Table 1.
Table 1. Distribution of data sets by gender
|
|
KCRD |
RSNA |
|
Total Image |
5305 |
12621 |
|
Male |
2315 |
6833 |
|
Female |
2990 |
5778 |
|
Average Age |
140.33 months |
127.32 months |
4.1 Bone age assessment block diagram
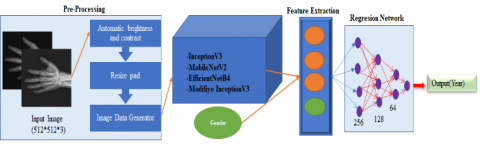
In this section, the deep learning architecture used to determine the age from hand-wrist images is explained. The proposed approach consists of 4 blocks. The proposed deep learning architecture is shown in Figure 3. Operations performed in each block are summarized below.
Figure 3. The general architecture of deep learning methods for BAA
Block 1: It is the pre-processing stage. At this stage, all the images in the KCRD and RSNA data set were pre-processed to remove the brightness and contrast differences. First, the contrast and brightness settings of the pictures were tuned. To eliminate this difficulty contrast-limited adaptive histogram equalization method is applied to images. In Figure 4, two different image examples obtained as a result of this method are given.
In the pre-processing stage, after the contrast and brightness adjustment, scaling was done. Reducing the size of the images will speed up the processing time since deep learning methods perform high mathematical operations. They are resized to an equal value since they are of different sizes and high resolution.
Block 2: The images passed the pre-processing stage are given to the CNN block. All kinds of information and properties are determined from the images in this block, including the edge information.
Block 3: At this stage, the regression process is performed using the previous block's features. Then, the BA of the person is estimated with the features from the CNN block to the regression block. MAE, RMSE, and R2 criteria were used to evaluate the performance of the model.
Figure 4. Automatic contrast and brightness process applied to images. (A) Original images, (B) Processed images
4.2 Convolutional neural networks
In classical artificial neural networks (ANN), properties of images or objects are extracted manually. CNN is an artificial neural network that automates the manual feature extraction method. CNN deals with raw images as input. These inputs then pass through a multi-layer feed-forward neural network containing different layer types: the convolution layer, activation layer, pooling layer, feature extraction layer with batch normalization, and fully connected output layer. CNN is designed to detect all kinds of information, features, including edges in images.
CNN is a popular deep learning technology used to distinguish between objects by picking up sometimes unnoticed points. One of the most prominent features of deep learning is the amount of data in the data set being studied should be abundant. Overfitting problems may occur during the study if the amount of data in the data set is small. To overcome this issue, to take advantage of deep learning technologies in working to small data sets, transfer learning method is used.
Deep learning CNN (DCNN) models contain series of layers with filters to perform feature extraction and dimensional reduction. The thin layers of a deep CNN method for visual acknowledgment adopts low-level features like edges, though the deeper layers adapt more semantical ideas by consolidating lower-level features [26, 27].
Transfer learning models with transfer learning method; trained on the ImageNet dataset (1.2 million images in 1000 categories).
The general architecture of deep learning methods used for BAA is given in Figure 9. We can get more efficient and effective results using these models with pretrained weights in our data set. Many transfer learning models are available. Since transfer learning models are pre-trained models, they contribute to classifying different images or regression problems. The models preferred for our study are InceptionV3 [28], MobileNetV2 [29] and EfficientNetB4 [30]. The Inception V3 was frequently used in studies on BAA issues. MobileNetV2 and EfficientNetB4 are fast models and very similar to Inception V3 in terms of model parameter numbers.
4.3 InceptionV3
The InceptionV3 network architecture has been trained over one million data on the ImageNet dataset. It is 42 layers deep and can be divided into 1,000 categories [28]. This model has been developed based on the GoogLeNet network. InceptionV3 network architecture is shown in Figure 5. In the modified InceptionV3 model, a new block has been added to the end of the InceptionV3 model, as shown in Figure 6. No fine-tuning has been done on the layers of the InceptionV3 model. This modified model performed better results with this newly added block on the KCRD dataset and RSNA dataset.
Figure 5. Inception V3 network architecture
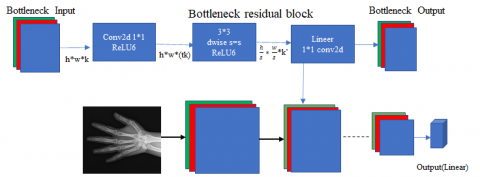
4.4 MobileNetV2
It is a CNN architecture proposed by Sandler et al. [29] for mobile devices. MobileNetV2 CNN architecture is used in large data sets such as ImageNet. It is a model that has been parameterized to meet the conditions with resource constraints. MobilenetV2 network architecture is shown in Figure 7.
4.5 EfficientNet
The Google research team has proposed the EfficientNet model as a new sizing method that equally scales all dimensions of the network's depth, width, and resolution. EfficientNet maintains and transfers learning datasets to maintain model efficiency and allows a basic ConvNet to scale to any target source constraint [30]. EfficientNet includes eight models between B0-B7, and each model is different in size and number of parameters. The EfficientNet B0 model is the smallest in terms of size and parameters. As the model number increases, the size and number of parameters increase. EfficientNet is based on compound scaling methods. The size and parameter numbers of the EfficientNetB4 model were the closest to other methods used in the study. Therefore, the EfficientNet B4 model was chosen. The primary network structure of EfficientNet B4 is given in Figure 8.
4.6 Network architecture for bone age assessment
The proposed network architecture for BAA from hand-wrist radiographs is shown in Figure 9.
Hand-wrist radiographs differ according to gender. A gender layer of 32 neurons and a binary gender information field (0 for male, 1 for female) were added to allow the model to recognize and explore this gender discrimination. The output layer of the InceptionV3 and MobileNetV2 models was removed, and the global average pooling process was applied to the remaining model. Later 512 * 512 inputs were given to the entrance of the model. After the two models were concatenated, 3 layers consisting of 256, 128, and 64 neurons were added to this model.
Figure 6. Modified Inception V3 network architecture
Figure 7. MobileNetV2 network architecture
Figure 8. EfficientNet B4 basic network structure [30]
Figure 9. Proposed bone age network architectural
4.7 Performance criteria
The performance of deep transfer learning models are tested with statistical criteria such as root-mean-square error (RMSE), mean absolute error (MAE), and coefficient of determination (R2). BA estimates were compared using statistical criteria. These criteria are defined by the following equations [31-34].
$R M S E=\sqrt{\frac{1}{N} \sum_{i=1}^{N}\left(\hat{Y}_{i}-Y_{i}\right)^{2}}$ (1)
$M A E=\frac{1}{N} \sum_{i=1}^{N}\left|\hat{Y}_{i}-Y_{i}\right|$ (2)
$R^{2}=\frac{\sum_{i=1}^{N}\left(Y_{i}-\underline{Y}\right)^{2}-\sum_{i=1}^{N}\left(\hat{Y}_{i}-Y_{i}\right)^{2}}{\sum_{i=1}^{N}\left(Y_{i}-\underline{Y}\right)^{2}}$ (3)
where, Yi is the actual age values of people in months. Y indicates the average values of these age values, $\widehat{Y}_{i}$ indicates the estimated BA values, N is the total number of observations. RMSE and MAE are positive values, and these statistical criteria are preferred to be small. Values close to zero indicate that the models estimate the age of the individuals close to the truth. The R2 measure suggests the relationship between the actual age values of persons in months and the values calculated by the models. For the success of the models, R2should be close to 1.
The sizes of the images obtained for the KCRD dataset were different from each other. When image sizes are reduced as 128, 256, 299 pixels according to the frequently used and recommended deep learning transfer methods, it is shown that valuable information in the image is lost, and the results were not at the desired level. Memory (RAM) troubles were encountered when the dimensions of the hand-wrist images were sized over 300 pixels. All the images were sized as 512 * 512 not to lose the distinctive pixels in the pictures. A special data generator method was written to keep and process pictures on this scale without causing any problems in RAM. In this method, 32 random images of 512 * 512 pixels in size were taken and processed at each step. The batch is taken as 32. With this special data generation method, the number of images in each epoch up to batch size has been uploaded to the system instead of uploading all. In this way, the loss of valuable information in the images was prevented and the RAM trouble encountered was eliminated.
Since the images were taken from different angles, a data augmentation process is applied to the images. For the training data set data augmentation, the normalization method of the transfer learning model, rotation between -10, +10 degrees, 10% magnification and 10% horizontal and vertical shift operations were applied. Only the normalization method of the transfer learning model was applied to the images reserved for the validation and test data set. BAA is performed with InceptionV3, EfficientNet, and MobileNetV2 deep transfer methods. Also, InceptionV3 was modified and used for BAA. The inceptionV3 model was the most successful in the RSNA 2017 Pediatric BA machine learning competition organized by Kaggle in 2017. The InceptionV3 model has been modified and turned into a more successful model for the KCRD dataset. MAE, RMSE, and R2 criteria were used to evaluate the performance of the models. Of the 5305 images in the KCRD data set, 3713 (70%) were used for training, 795 (15%) for validation, and 796 (15%) for testing. Similar rates of training, validation, and testing were used in the RSNA data set. Performance values obtained for the test data set of 4 models are given in Table 2. The methods were applied to KCRD and RSNA data sets separately.
The whole study used ADAM as the optimization function, MAE as the loss function, and RELU as the activation function.
Table 2 shows the performance values of the InceptionV3 deep transfer model, which is the most successful model in the competition organized by Kaggle as MAE=5.9, RMSE=8.22, and R2=0.974 for the RSNA dataset. The same model obtained MAE=11.18, RMSE=14.1 and R2=0.974 for the KCRD data set. However, for the modified InceptionV3 deep transfer model on the RSNA data set, MAE=5.75, RMSE=7.42 ve R2=0.96 values were obtained. For the KCRD data set, MAE =4.3, RMSE=5.76 and R2 = 0.99 values were observed. The modified Inception V3 model obtained more successful results for both data sets than the Inception V3 model. MobileNetV2 and EfficientNetB4 deep transfer methods were also used for RSNA and KCRD data sets. In the literature, there are studies with these deep transfer methods used for BAA. The modified InceptionV3 method achieved the best results for both data set than all other methods. MobileNetV2 deep transfer method resulted in the worst performance out of the four models. The chronological age and estimated age information of the images of a few randomly selected samples for the modified Inception V3 model are given in Figure 10.
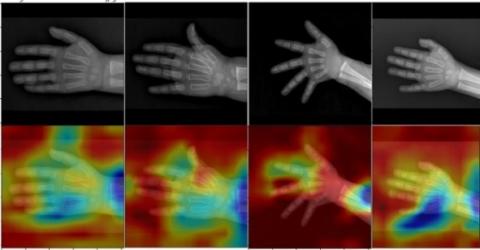
Grad-CAM (Gradientweighted Class Activation Mapping) method is used in CNN architectures to show the important regions that the model is interested in while estimating the images of the trained model. Estimation is made using the values in the last Conv layers of the CNN. Thus, by creating a heat map from the feature maps in the last layer, the regions that the model is intensely interested in are visualized. At this stage, the success of the InceptionV3 model, in which we obtained the best result while making predictions while finding the best results on the data set was visualized using the Grad-CAM method. In Figure 11, the regions that the trained modified Inception V3 model focuses on while estimating are shown.
Table 2. Results according to transfer learning models
|
|
KCRD data set |
RSNA data set |
||||
|
Models |
MAE |
RMSE |
R2 |
MAE |
RMSE |
R2 |
|
Inception3 |
11.18 |
14.1 |
0.970 |
5.9 |
8.22 |
0.97 |
|
InceptionV3 (modified) |
4.3 |
5,76 |
0.99 |
5.75 |
7.42 |
0.96 |
|
MobileNetV2 |
6.35 |
9.12 |
0.956 |
8.7 |
10.31 |
0.94 |
|
EfficientNetB4 |
5.42 |
7.15 |
0.970 |
9.4 |
12.44 |
0.87 |
Figure 10. A few examples of the modified Inception V3 method BAA results
Figure 11. Heatmap example of the modified Inception Model V3 (Grad-CAM)
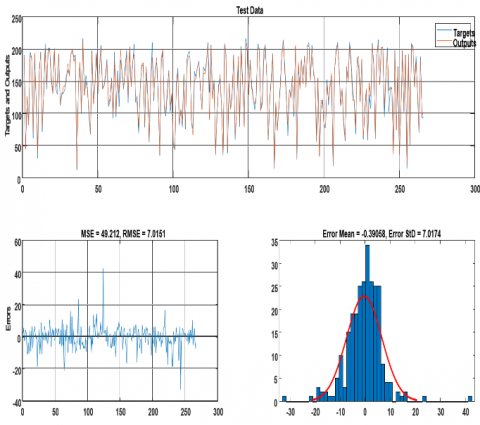
Figures 12-14 show the performance charts obtained for training, validation, and test sets after applying the modified InceptionV3 model to the KCRD data set. The graphs show the error and error distributions between the chronological age and the estimated age. Figure 15 shows the regression graphs between actual ages and estimated values for training, validation, and test sets. The regression determination coefficient charts show how closely related the predicted values are to the actual values.
In recent years in the literature, there have been many studies concerning BAA which use deep learning-based approaches. In these studies, the success of the models was generally evaluated on the MAE criterion. Some of the studies done are given in Table 3.
Figure 12. Performance values for KCRD training set
Table 3. Studies with the RSNA data set
|
Researchers |
Method |
DataSet |
MAE |
|
Iglovikov and others [13] |
U-Net |
RSNA |
7,52 |
|
Spampinato et al. [18] |
BoNet |
DHA |
9,6 |
|
Castillo et al. [21] |
VGG-16 |
RSNA |
9.82-10.75 |
|
Pan et al. [34] |
U-Net |
RSNA |
8.59 |
|
Chen et al. [36] |
Xception |
RSNA |
7.3 |
|
Lee et al. [37] |
CaffeNet |
RSNA |
18.9 |
|
Zhao et al. [38] |
DenseNet |
RSNA |
5,78±1,3 |
|
Cao et al. [39] |
U-Net |
RSNA |
6,24±3 |
|
Lee et al. [16] |
InceptionV3 |
XRBAGE |
RMSE=0.82 - 0.93 |
|
Zhao et al. [38] |
DenseNet |
RSNA |
5,78±1,3 |
|
Cao et al. [39] |
U-Net |
RSNA |
6,24±3 |
|
Lee et al. [16] |
InceptionV3 |
XRBAGE |
RMSE=0.82 - 0.93 |
|
Mutasa et al. [40] |
VGG-16 |
Mabal |
6.43±7.64 |
|
Chen et al. [20] |
ResNet |
China Medical University |
Accuracy=%78 |
|
Son et al. [19] |
VGGNet |
Korean children |
5.52 |
|
Bui et al. [12] |
InceptionV4 |
DHA |
7.44 |
|
This study |
Modified InceptionV3 |
RSNA, KCRD |
5.75, 4.3 |
Figure 13. Performance values for KCRD validation set
Figure 14. Performance values for KCRD test set
Figure 15. Regression graphs for training, validation, and test sets
Innovative technologies are frequently used in medical images. These technologies help clinicians to identify problems from images more accurately and save time. Using deep learning methods, one of the innovative technologies, a decision support system developed to assist experts in determining age from hand-wrist radiographs. For this purpose, a new data set created with 5305 images obtained from 4 hospitals in Kütahya province was used. InceptionV3, EfficientNetB4, MobileNetV2 and modified Inception V3 transfer learning models were used among the deep learning methods. A comparison was made with the data set used in a competition and winner model to measure the performance of our study. Performance values of modified InceptionV3 model on the KCRD data set are MAE=4.3, RMSE=5.76, R2=0.99 and on the RSNA data set are MAE=5.75, RMSE=7.42 ve R2=0.96. This study is the first one conducted with wrist radiographs collected in our country. For testing the success of our model on the KCRD, the publicly distributed RSNA data set was used, and it was determined that the proposed model gave one of the best results among the studies conducted in the literature, as can be seen from Table 3 on this data set. The proposed model can be used for both data sets, and we can obtain results close to the most optimal values.
It is known that the wrist graphs of individuals differ as a result of environmental factors and race. Our study shows that the bone age of individuals grown in different regions/environments can be determined by deep learning methods from the wrist radiographs; deep learning methods can decrease or eliminate this difference.
The primary purpose of this study was to compare the performances of the same model on the data sets obtained from different regions. The outcomes of the deep learning models differed for each data set. Future studies with other models may help to eliminate these differences.
A dataset has been created to determine bone age, which has become a necessity due to the migration events experienced intensively in our country, and a decision support system has been developed from a model trained on this dataset. We hope that this and similar studies will reduce the time spent by physicians and forensic medicine specialists to determine bone age with decision support systems that are suitable for today's conditions, fast, economic, accessible from anywhere, regardless of location, and producing more accurate results.
[1] Pan, I., Baird, G.L., Mutasa, S., Merck, D., Ruzal-Shapiro, C., Swenson, D.W., Ayyala, R.S. (2020). Rethinking Greulich and Pyle: A deep learning approach to pediatric bone age assessment using pediatric trauma hand radiographs. Radiology: Artificial Intelligence, 2(4): e190198. https://doi.org/10.1148/ryai.2020190198
[2] Dallora, A.L., Anderberg, P., Kvist, O., Mendes, E., Diaz Ruiz, S., Sanmartin Berglund, J. (2019). Bone age assessment with various machine learning techniques: A systematic literature review and meta-analysis. PLoS One, 14(7): e0220242. https://dx.plos.org/10.1371/journal.pone.0220242
[3] Creo, A.L., Schwenk, W.F. (2017). Bone age: A handy tool for pediatric providers. Pediatrics, 140(6): e20171486. http://pediatrics.aappublications.org/lookup/doi/10.1542/peds.2017-1486.
[4] Büken, B., Şafak, A.A., Yazıcı, B., Büken, E., Mayda, A.S. (2007). Is the assessment of bone age by the Greulich–Pyle method reliable at forensic age estimation for Turkish children? Forensic Science International, 173(2-3): 146-153. https://doi.org/10.1016/j.forsciint.2007.02.023
[5] Büken, B., Erzengin, Ö.U., Büken, E., Şafak, A.A., Yazıcı, B., Erkol, Z. (2009). Comparison of the three age estimation methods: which is more reliable for Turkish children? Forensic Science International, 183(1-3): 103.e1-103.e7. https://doi.org/10.1016/j.forsciint.2008.10.012
[6] Štern, D., Payer, C., Urschler, M. (2019). Automated age estimation from MRI volumes of the hand. Medical Image Analysis, 58: 101538. https://doi.org/10.1016/j.media.2019.101538
[7] Aref Elnasasra, M.D., Hilmi Alnsasra, M.D., Rozalia Smolyakov, M.D., Klaris Riesenberg, M.D., Lior Nesher, M.D. (2017). Bone age assessments by quantitative ultrasound (sonicbone) and hand X-ray based methods are comparable. The Israel Medical Association Journal (IMAJ), 19(9): 533-538.
[8] Koc, A., Karaoglanoglu, M., Erdogan, M., Kosecik, M., Cesur, Y. (2001). Assessment of bone ages: Is the Greulich-Pyle method sufficient for Turkish boys? Pediatrics International, 43(6): 662-665. https://doi.org/10.1046/j.1442-200X.2001.01470.x
[9] Satoh, M. (2015). Bone age: Assessment methods and clinical applications. Clinical Pediatric Endocrinology, 24(4): 143-152. https://doi.org/10.1297/cpe.24.143
[10] Mentzel, H.J., Vilser, C., Eulenstein, M., Schwartz, T., Vogt, S., Böttcher, J., Yaniv, I., Tsoref, L., Kauf, E., Kaiser, W.A. (2005). Assessment of skeletal age at the wrist in children with a new ultrasound device. Pediatric Radiology, 35(4): 429-433. https://doi.org/10.1007/s00247-004-1385-3
[11] Reddy, N.E., Rayan, J.C., Annapragada, A.V., Mahmood, N.F., Scheslinger, A.E., Zhang, W., Kan, J.H. (2020). Bone age determination using only the index finger: A novel approach using a convolutional neural network compared with human radiologists. Pediatric Radiology, 50(4): 516-523. https://doi.org/10.1007/s00247-019-04587-y
[12] Bui, T.D., Lee, J.J., Shin, J. (2019). Incorporated region detection and classification using deep convolutional networks for bone age assessment. Artificial Intelligence in Medicine, 97: 1-8. https://doi.org/10.1016/j.artmed.2019.04.005
[13] Iglovikov, V.I., Rakhlin, A., Kalinin, A.A., Shvets, A.A. (2018). Paediatric bone age assessment using deep convolutional neural networks. In Deep Learning in Medical Image Analysis and Multimodal Learning for Clinical Decision Support, pp. 300-308. https://doi.org/10.1007/978-3-030-00889-5_34
[14] Kashif, M., Deserno, T.M., Haak, D., Jonas, S. (2016). Feature description with SIFT, SURF, BRIEF, BRISK, or FREAK? A general question answered for bone age assessment. Computers in Biology and Medicine, 68: 67-75. https://doi.org/10.1016/j.compbiomed.2015.11.006
[15] Larson, D.B., Chen, M.C., Lungren, M.P., Halabi, S.S., Stence, N.V., Langlotz, C.P. (2018). Performance of a deep-learning neural network model in assessing skeletal maturity on pediatric hand radiographs. Radiology, 287(1): 313-322. https://doi.org/10.1148/radiol.2017170236
[16] Lee, H., Tajmir, S., Lee, J., Zissen, M., Yeshiwas, B.A., Alkasab, T.K., Choy, G., Do, S. (2017). Fully automated deep learning system for bone age assessment. Journal of Digital Imaging, 30(4): 427-441. https://doi.org/10.1007/s10278-017-9955-8
[17] Hao, P., Chokuwa, S., Xie, X., Wu, F., Wu, J., Bai, C. (2019). Skeletal bone age assessments for young children based on regression convolutional neural networks. Mathematical Biosciences and Engineering, 16(6): 6454-6466. https://doi.org/10.3934/mbe.2019323
[18] Spampinato, C., Palazzo, S., Giordano, D., Aldinucci, M., Leonardi, R. (2017). Deep learning for automated skeletal bone age assessment in X-ray images. Medical Image Analysis, 36: 41-51. https://doi.org/10.1016/j.media.2016.10.010
[19] Son, S.J., Song, Y., Kim, N., Do, Y., Kwak, N., Lee, M.S., Lee, B.D. (2019). TW3-based fully automated bone age assessment system using deep neural networks. IEEE Access, 7: 33346-33358. https://doi.org/10.1109/ACCESS.2019.2903131
[20] Chen, X., Li, J., Zhang, Y., Lu, Y., Liu, S. (2020). Automatic feature extraction in X-ray image based on deep learning approach for determination of bone age. Future Generation Computer Systems, 110: 795-801. https://doi.org/10.1016/j.future.2019.10.032
[21] Castillo, J.C., Tong, Y., Zhao, J., Zhu, F. (2018). RSNA bone-age detection using transfer learning and attention mapping. http://noiselab.ucsd.edu/ECE228_2018/Reports/Report6.pdf.
[22] Wang, S., Shen, Y., Shi, C., Yin, P., Wang, Z., Cheung, P.W.H., Cheung, J.P.Y., Luk, K.D., Hu, Y. (2018). Skeletal maturity recognition using a fully automated system with convolutional neural networks. IEEE Access, 6: 29979-29993. https://doi.org/10.1109/ACCESS.2018.2843392
[23] Liu, Y., Zhang, C., Cheng, J., Chen, X., Wang, Z.J. (2019). A multi-scale data fusion framework for bone age assessment with convolutional neural networks. Computers in Biology and Medicine, 108: 161-173. https://doi.org/10.1016/j.compbiomed.2019.03.015
[24] Han, Y., Wang, G. (2020). Skeletal bone age prediction based on a deep residual network with spatial transformer. Computer Methods and Programs in Biomedicine, 197: 105754. https://doi.org/10.1016/j.cmpb.2020.105754
[25] Shin, N.Y., Lee, B.D., Kang, J.H., Kim, H.R., Oh, D.H., Lee, B.I., Kim, S.H., Lee, M.S., Heo, M.S. (2020). Evaluation of the clinical efficacy of a TW3-based fully automated bone age assessment system using deep neural networks. Imaging Science in Dentistry, 50(3): 237. https://doi.org/10.5624/ISD.2020.50.3.237
[26] Bulla, P., Anantha, L., Peram, S. (2020). Deep neural networks with transfer learning model for brain tumors classification. Traitement du Signal, 37(4): 593-601. https://doi.org/10.18280/ts.370407
[27] Wajeed, M.A., Sreenivasulu, V. (2019). Image based tumor cells identification using convolutional neural network and auto encoders. Traitement du Signal, 36(5): 445-453. https://doi.org/10.18280/ts.360510
[28] Dong, N., Zhao, L., Wu, C.H., Chang, J.F. (2020). Inception v3 based cervical cell classification combined with artificially extracted features. Applied Soft Computing, 93: 106311. https://doi.org/10.1016/j.asoc.2020.106311
[29] Sandler, M., Howard, A., Zhu, M., Zhmoginov, A., Chen, L.C. (2018). Mobilenetv2: Inverted residuals and linear bottlenecks. In Proceedings of the IEEE Conference on Computer Vision and Pattern Recognition, pp. 4510-4520. http://arxiv.org/abs/1801.04381.
[30] Tan, M., Le, Q. (2019). Efficientnet: Rethinking model scaling for convolutional neural networks. In International Conference on Machine Learning, pp. 6105-6114. http://proceedings.mlr.press/v97/tan19a.html.
[31] Chai, T., Draxler, R.R. (2014). Root mean square error (RMSE) or mean absolute error (MAE)?–Arguments against avoiding RMSE in the literature. Geoscientific Model Development, 7(3): 1247-1250. https://gmd.copernicus.org/articles/7/1247/2014
[32] Chicco, D., Warrens, M.J., Jurman, G. (2021). The coefficient of determination R-squared is more informative than SMAPE, MAE, MAPE, MSE and RMSE in regression analysis evaluation. PeerJ Computer Science, 7: e623. https://doi.org/10.7717/peerj-cs.623
[33] Bakirci, K. (2009). Correlations for estimation of daily global solar radiation with hours of bright sunshine in Turkey. Energy, 34(4): 485-501. https://doi.org/10.1016/j.energy.2009.02.005
[34] Şahin, M., Kaya, Y., Uyar, M. (2013). Comparison of ANN and MLR models for estimating solar radiation in Turkey using NOAA/AVHRR data. Advances in Space Research, 51(5): 891-904. https://doi.org/10.1016/j.asr.2012.10.010
[35] Pan, X., Zhao, Y., Chen, H., Wei, D., Zhao, C., Wei, Z. (2020). Fully automated bone age assessment on large-scale hand X-ray dataset. International Journal of Biomedical Imaging, 2020: 1-12. https://doi.org/10.1155/2020/8460493
[36] Chen, C., Chen, Z., Jin, X., Li, L., Speier, W.F., Arnold, C. (2021). Attention-guided discriminative region localization and label distribution learning for bone age assessment. IEEE Journal of Biomedical and Health Informatics. https://doi.org/10.1109/JBHI.2021.3095128
[37] Lee, J.H., Kim, K.G. (2018). Applying deep learning in medical images: The case of bone age estimation. Healthcare Informatics Research, 24(1): 86-92. https://doi.org/10.4258/HIR.2018.24.1.86
[38] Zhao, X.X., Li, D.Y., Li, J., Kang, J., Yang, L. (2020). Research on the intelligent assessment algorithm of bone age based on attention mechanism. Journal of Physics: Conference Series, 1619(1): 012018. https://doi.org/10.1088/1742-6596/1619/1/012018
[39] Cao, S., Chen, Z., Li, C., Lv, C., Wu, T., Lv, B. (2019). Landmark-based multi-region ensemble convolutional neural networks for bone age assessment. International Journal of Imaging Systems and Technology, 29(4): 457-464. https://doi.org/10.1002/IMA.22323
[40] Mutasa, S., Chang, P.D., Ruzal-Shapiro, C., Ayyala, R. (2018). MABAL: A novel deep-learning architecture for machine-assisted bone age labeling. Journal of Digital Imaging, 31(4): 513-519. https://doi.org/10.1007/s10278-018-0053-3