Bokka Sridhar
© 2021 IIETA. This article is published by IIETA and is licensed under the CC BY 4.0 license (http://creativecommons.org/licenses/by/4.0/).
OPEN ACCESS
Medical image segmentation research is becoming efficient by using mathematical morphological (MM) operators. There are different methods in image segmentation such as supervised and unsupervised segmentations. The MM operators are much effective, in developing a computer aided diagnosis (CAD) system. Medical image such as mammograms, generally they are of low contrast, such that radiologists face difficulties in observing the results. Due to this, diagnosis fails to generate high rate false positives and false negatives. In the proposed work improvement of quality of image segmentation with inclusion of morphological operations with other methods such as watershed transform, fuzzy logic based techniques, curvelets and MRF to detect the masses and calcifications in mammograms. Classification of masses and evaluation of segmentation process are done with artificial neural network and other performance metrics. These methods lead to increase in the accuracy, specificity and sensitivity of mammography and reduce unnecessary biopsies.
image segmentation, medical images, watershed transform, fuzzy logic based techniques, MRF and mathematical morphology
Due to the increase in size and number of medical images the use of computers plays a vital role in assisting the computing and analysis of images. Particularly to compute a medical image algorithm for the demarcation of anatomical shapes and process the supplementary regions of interest (ROI) in various organ images by taking vital part of the image to facilitate and extract information for specific radiological challenges. These types of algorithms come under the image segmentation area of research, which play a key role especially in biomedical imaging applications like study of anatomical structure [1], diagnosis [2], quantification of tissue volumes [3], localization of pathology [4], treatment planning [5], partial volume correction of functional imaging data, and computer integrated surgeries [6] etc.
Mathematical morphology (MM) is very much powerful and rich operation for the analysis and symbolize of binary and gray scale images [7]. The mathematical operators are applied to extracts or isolated the features in the images. MM are using almost all the areas of image processing that is skeleton and shape representation and decomposition [8]. MM consists of basic operations dilation, erosion. The rest of the operations are with different combination of these operations. The MM operations can be combined with other methods such as active contour, neural network etc. to extract different types of features, and eliminated the redundant pixels, and removed the damaged areas [9, 10].
Serra [11] proposed an impulse noise removal filter using mathematical morphology. Hendriks and van Vliet [12] has given attempts on MM techniques which are implemented based on Scilab toolbox. The toolbox is openly used software and makes connection with mathematical morphology tool box. Li et al. [13] described an adaptable search-based approach for morphological shape enhancement. This method is also used in other applications purpose such as image recognition, coding, object detection.
Devi [14] proposed a method for the quality development of speculations by applying radon transform and linear filter to the mammogram. The method is to detected masses as well as in architecture distortion. They reported sensitivity of 80% at 14 false positives per image out of which 45 images are screened. Hamdi [15] developed a vector based neural network classification of masses as malignant or benign. Evans and Liu [16] proposed knowledge-based CAD system for lesion detection. They are used in two different data sets, and digitized separately is given to the system. The system is evaluated by the authors by applying three datasets. These are independent datasets; a dataset with other set is a knowledge base, and evaluating the system performance when they consider a knowledge database as an assorted data base. Keller et al. [17] reported a sensitivity, specificity are 95.91%, 93.97% with respect to proposed method. An algorithm of linear transformation filter is used to improve the image quality, after the lesion is extracted from the original image using suitable threshold value converts in to binary images, a data base of 61 images are used for this method. Sridhar et al. [18] proposed a region-based segmentation method applied to separate the suspicious regions using spatial gray level dependence (SGLD) matrices. The stepwise linear determination is obtained and the importance of each feature is explaining from abnormal masses to normal masses. In the experiment one half of a data set i.e. 168 mammograms are observed containing abnormal masses, later confirmed by biopsy [19-24].
The aim of this work is to develop an efficient medical image segmentation system for the complex images such as normal to complex mammograms. Here the basic tools in each algorithm are developed with mathematical morphology. To develop mass detection methods in mammograms using watershed transform, marker-controlled watershed transforms, morphological curvelet transform and then hybrid combinations comprised of mathematical morphology, watershed transform, & Markov random fields. Performances of these algorithms are compared with performance metrics. The outline and contributions of this paper are as follows: Existed works for medical image segmentation are discussed in Section 1, Section 2 a theoretical detail of the proposed work discussed. In Section 3 Experimentation details and results is explained MM with other algorithms. Comparative results are also discussed. Section 4: conclusion and remarks of proposed work are discussed in Conclusions.
2.1 Medical image (The Mammogram)
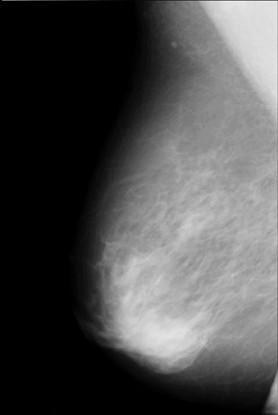
A vital information presented in the mammogram that can classify the breast lesions either malignant or benign. In this process the women age also consider to give decision along with clinical data of the patient. A particular advance to this problem is to extract called features from mammogram and then use a mathematical or statically model to classify lesions for the assessment of malignant versus benign. This approach is not exclusive to the classification using computers; a lot of radiologists are supporting for a related methodical approach during the analysis of mammograms [1]. As shown in Figure 1: A ranked malignant mass appears in mammogram which describes the severity of the disease.
Figure 1. Mammogram
Breast cancer causes a desmoplastic reaction in breast tissue. A mass is appeared as a bright hyper-dense object along with some deposits of calcium(calcifications) is also appears as intense areas in the mammogram.
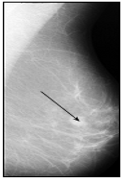
Mammograms are X-ray projections are penetrating through a breast tissue onto a detector array or a film plate, see Figure 2. Tumors are formed with a dense tissue, and they are reflected most of the incident X-rays. So, they were appearing as a bright region in the mammograms. Cancer detection in Breast using mammograms is complicated problem in image processing because a huge deviation appeared in the both normal breast and of cancerous breast tissues.
The location of the lesion is indicated by the arrow.
Few breasts are formed with very dense or glandular parenchymal tissues that are radio not transparent, similarly the other types of breasts are maximum percentage of fat and radiolucent. They are a number of types breast abnormalities are visible in mammograms those are asymmetry between the breasts, architectural distortions, calcifications increase the density of breast tissue, lesions.
Figure 2. Example of a mammogram (mdb010rm from the MIAS public database)
2.2 Mathematical morphological operations
The majority important MM operations are erosion and dilation. Dilation concentrates on object boundaries in the image to be extracted, whereas erosion is on deleting the object boundaries. While applying these operations the structure elements exhibit an important role [9]. Each pixel values within the region will be deleted or included by applying certain rules to the pixels and its neighborhood pixels. These rules are with constraint combinations of erosion and dilation operations. The secondary operations are closing and opening which are combinations of erosion followed by dilation operation and vice versa [7].
2.2.1 Understanding structuring elements (SE)
Structuring element is a two-dimensional matrix having the elements values 0 and 1. The shape of the position value of ‘1’ will decide that which pixel is to be highlighted and deleted. The image is explored by the structure element, which is a crucial part of the erosion and dilation operations [7]. SE is classified as the flat or two-dimensional matrix generated with the small dimension compared to the image dimensions. SE performs various operations by choosing the central pixel value from the sub part of the image equal to the dimensions of SE [6].
Dilation and Erosion are the basic operations of MM. The Eqns. (1)-(2) are the mathematical representation of Dilation and erosion.
Dilation operator $I \oplus B=\{a+b: a \in I, b \in B\}$ (1)
Erosion $\mathrm{I} \ominus \mathrm{B}=\left(\mathrm{I}^{\mathrm{c}} \oplus \mathrm{B}\right)$ (2)
Let I be the input of the image, Here I can be binary or gray scale image, and the SE is denoted with ‘B’, which is used to determine the precise effect of the operator.
Opening is an operation applied to shape interpretation, in that opening (given in 3) which smooth shape by dividing a narrow subpart and minimizing a small islands or gaps. Closing operation eliminates a small hole in the input image.
Opening $\mathrm{I}^{\circ} \mathrm{B}=(\mathrm{I} \ominus \mathrm{B}) \oplus \mathrm{B}^{c}$ (3)
Opening reconstruction is the geodic dilation.
Morphological reconstruction permits the separation of definite features inside an image that are based on exploitation of mask image XI and a marker image YI. Opening by reconstruction is given in Eq. (4).
δG(YI)=δ(1)(YI)οδ(1)(YI)οδ(1)(YI)…until stability (4)
The above Eq. (4) is the Iterations of elementary operation geodesic dilations, δ(1).
These operators can be required when considering the shape of an object in binary image, a ‘disc’ shaped SE is used extraction of the shape of the object. In this process a dilation blows up its boundaries, and erosion shrinks the boundaries. Morphological process is applied on image through dilation and erosion as primary basis [9].
2.3 Gradient morphology for Region of Interest (ROI) based detection of cancer
Mathematical morphology [10] is used to mark the dynamic dynamics of intensity levels. IG (x) gradient morphology for the given input image x. Where N is that scale, bp is that group of parts of the structure. If bp is chosen because the part of the bar structure.
$\mathrm{IG}(\mathrm{x})=\frac{1}{n} \sum_{p=1}^{n}\left[\left(\left(x \oplus b_{p}\right)-\left(x \ominus b_{p}\right)\right) \oplus b_{p-1}\right]$ (5)
If "bp" is chosen as a rod type with flat Prime values whose domain is the origin along with its vicinity, then the gradient based mainly on erosion and dilation is also known as an erosion residue edge detector or dilation residue edge detector correspondingly. Here, a lot of square measurements extracted with the IG (x). The series of operations of square measurements applied with adaptive bilateral filters together with morphological gradients to train the rule and generate an optimal result.
To find lesions based primarily on ROI in numerous mammograms, a technique planned the linear metric unit along with a non-linear filtering process [5]. The bilateral adaptive filter displays the properties of a non-linear filter. Zhang and Allebach [6] they generated the bilateral adaptive filter (ABF) that the normal variety of bilateral filters. However, there are 2 necessary changes., The Associated Compensation Value included together with the variation of filter. Then each amplitude and variation of the adaptive filters measures the flexible square with individual output value. The exit of the bite preserved with the Laplacian operation of Gauss (LOG) improves sharpness. it relies strictly on the structure of the image, the filtering operation of the variant of change of the bilateral filter. The standardization problem ensures that the filter retains the typical grey value in Constant Image areas. The dynamic variation of force variations is extracted with a gradient morphology that is the limit of abundance. These divided boundaries measure in square form superimposed on the first image, which highlights the mass in the image.
2.4 Morphological watershed algorithm
Watershed transform mostly depends on image domain and popularly used to segment the image. A watershed algorithm gives a quality output if quality input is given to the process, thus the transform allows on a high contrast with dynamical variation of level image as input. So a pre-processing technique is applied before the segmentation process is to be performed. In this context, a height image is described, where the highest image intensities correspond to logical boundaries between regions of interest. The algorithmic rule does not presume to construct this input image for analysis, as it cannot recognize which image options attract attention for an application type. In order to find associated input Gray level image options of interest, additional details may be needed on the mathematical ideas of the morphological algorithmic rule of the hydrographic Basin offered in the studies [8, 9].
2.4.1 Watershed
The watershed is described for the continuous case and may be compatible with distance functions. let us think of an "f" image as part of house C (D) of the real price that infinitely duplicated the differentiable functions in a domain D connected with only isolated crucial points. When considering Point p and letter D (the geographical distance) the minimum value (low gray value) is obtained above all the elegant curves within D with (0) = p, (1) = q. be minimum $\mathrm{f} \in \mathrm{C}$ (D) Ikk, for some index sets I. The catchment basin of a minimum mi is expressed as the set of pixels; those are topographically closer to mi than to any other regional minimum mj:
The watershed may be a connected boundary containing a group | Group / group} of constituent points that are not in any drainage basin group.
$\mathrm{CB}(\mathrm{mi})=\{\mathrm{x} \in \mathrm{D} \mid \mathrm{v} \mathrm{j} \in \mathrm{I}\{\mathrm{i}\}: \mathrm{f}(\mathrm{mi})+\mathrm{Tf}(\mathrm{x}, \mathrm{mi})<$$f(\mathrm{mj})+\mathrm{Tf}(\mathrm{mj})\}$ (6)
The watershed of f is a connected boundary that contain a group of pixel points that are not in any group of catchment basin.
$\mathrm{W}_{\text {SHED }}(\mathrm{f})=\mathrm{D} \cap\left[\mathrm{U}_{\mathrm{i}=1} \mathrm{CB}(\mathrm{mi})\right]$ (7)
However a watershed transform of I allocates a label the points of D, then 1) each catchment basin are unique, so label them differently; 2) all points are connected to form a desire region is watershed of f labeling with W.
Watershed method is basically elaborating an area in upward direction of increase pixel gray value. The method is applied on mammogram having cancer area in the center part and appear as more intensity than the adjacent pixels, when a tumor is found in mammogram. It has features are that contain superior gradient values towards center indicating maximum brightness at the center point. An improved watershed algorithm is applied for adapting the shape of cancer tumor that expands an area away from the center towards boundary of tumor.
2.4.3 Integration method
Watershed transform segmented all dynamic regions in the tumor; the process is requiring to combines dynamic variation regions. A methodology is based on consider the variation of brightness difference with respective to neighborhood pixels. The conditional based algorithm is developed with regional integration are defined as
Di $=\max (\mathrm{Hi})-$ Havg
$\operatorname{Ig}=\min (\mathrm{Di}, \mathrm{Dj})$
Area(i) $\supset$ Area(j) if $(\operatorname{Ig}<T h) \wedge(\mathrm{Mi}>M j)$
Area(i) $\subset$ Area(j) if $(\operatorname{Ig}<T h) \wedge(\mathrm{Mi}<M j)$
Do nothing if $(\operatorname{Ig}>t h)$ (8)
where, Hi and Havg measure a collection of brightness and also the average in limit pixels, Di is that the distinction between the maximum Hi and Havg, serum immunoglobulin is that the minimum distinction in space with various values of I and j, Th is the threshold of intensity level of pixel, and M is the size of the region to be mixed, separately. once the distinction of brightness around space boundaries is less than the limit, these 2 squares are combined.
2.5 Marker-controlled watershed segmentation
Separation of lesion objects in an image is one of the most difficult image processing operations. The rework of the hydrographic basin is commonly applied to the current drawback. The rework of the watershed gives an account of a "crest line of the watershed" and "catchment" in a given image to play as in a surface in which the pixel values of light measured most of the squares and the values of dark pixels measure the minimum [12].
A marker image is created by subtracting the associated tending input image from the low gray price. When the image reconstruction is marked to create regions that appear with a similar intensity. the gap is erosion followed by dilation, while the opening by reconstruction is erosion followed by morphological reconstruction [13]. The space with a closure will remove dark spots and branch marks on the grayscale image. The reconstruction was mainly based on the gap and closing operators’ area unit, effective largely as the normal gap and closing to remove small patches or noises without moving the entire forms of the regions.
Here, to extract the foreground makers-based regions a regional maximum of dilated image is used. In order to achieve an optimum threshold value for makers an adaptive threshold process is introduced.
Segmentation of medical image with the watershed transform effective if properly mark or identify a foreground or background regions [8], that extracts the mass detection and shape of lesions.
2.6 Curvelet transform with MM
Curvelet transform allow a most favorable non adaptive demonstration of edges that are designed to represent images at different scales and different angles. The most important property is a multi-scale directional transform and an advanced dimension of the Wavelet transform the transform has two mathematical properties [3-5, 7]:
a) Some coefficients showing curved singularities should be approximated and in a non-adaptive representation called “curvelets."
b) In a smooth surface the curvelets show a coherent property and the frame of the curvelet a packet framed L2R2 second dyadic decomposition [6].
$\begin{aligned} y(x) &=\sum f \emptyset(x) \\ \text { where } f &=\int y(x) \emptyset(x) \end{aligned}$ (9)
The x values 2k<|x|<2 (k+1) are frequency shells; and the angular sectors are finally the approximation rate is optimal:
$y=\int f \emptyset$ Minimum value $\left\|y-y_{n}\right\|^{2}<\frac{1}{n^{2}} \log n^{3}$
$\left\|y-y_{n}\right\|^{2}<n^{-f}$ (10)
2.6.1 Adaptive threshold curvelet
The best threshold price for the radiogram is calculated by mistreatment of the subsequent steps.
Cypher social control of the reprocessing of Curvelet, wherever Curvelet is normalized mistreatment the subsequent equation:
f(i, j, k)=n/√(m1, i-m2, i) and (i, j, k) (11)
where, m1, I, m2, J unit area the facet lengths of the quadrangle.
The threshold price is calculated in three steps:
In order to encrypting the Pixel by mean of the input image, the media specifies the central purpose of all pixel values of the input images [11].
Calculate the live space frequency that characterizes the input image.
The compute distinction operator detects the Stinger of the image and identifies the slope of the variation of the gray price within the image.
Threshold = (distorted image difference operator) *
(Spatial frequency measurement of distorted image) *
Media (distorted image) +
(Medium. (Distorted image) *
(Curvelet constant number) (12)
Here the number of iterations is the same coefficient of curvature [14].
Apply the quick Curvelet deformation separated by deformation, which to be mistreated the subsequent equation is calculated [5].
$y(i, j, k)$
$=\frac{1}{n^{2}} \sum_{n 1 n 2} y(n 1, n 2) U(n 1, n 2) e^{i 2 \pi\left(\frac{k 1 n 1}{R 1, j}+\frac{k 2 n 2}{R 2, j}\right)}$ (13)
Apply the calculated threshold to The Associated nursing input image, then apply reverse FDCT to an image to maneuver the image from the curve to a spatial domain.
Finally, remove the pure imaginary number of images obtained from the step taken to accumulate an increased X-ray.
2.6.2 Mathematical morphology operators
SE plays crucial roles in extracting the shape of the object, type of processing as a result, preferred according to the requirement and purpose of the related application. Suppose I(x, y) is a gray scale image and B is the SE [5] in 2-D Euclidean space Z2. Morphological edge detector also called as top hat transform is applied to detect the edges. Top-hat (TP) operation is in terms of morphological operations is given below.
TP(I)=I−(I◦B) (14)
where, the opening operator is denoted as (◦).
Top-hat operation is pixels in an opened image which has lesser or the same gray level pixel values compare to the original image which is main difficulty, as a result, top-hat operator includes a little normal intensity fluctuation which are to be found in the image such as noise. To avoid the limitations, a modification is introduced on a closing operation along with original top-hat transformation [16]. As shown in equation represents a modified equation.
TP(I)=I−min((I•Bc)◦Bo (15)
where, Bc and Bo are the SE`s in closing (•) and opening (◦) operations, correspondingly.
2.6.3 Experimenting process
Initially, a preprocess image applied to top hat rework is to extract infected pixels from the malignant one within the image. The result of the photo image of X-ray is applied to the rework of the curve, to obtain the coefficients for the operations of the threshold to normalize the coefficients.
The operation of curved rework is explained in the following steps [9]:
1) Decomposition of sub-bands: each image is rotten log2M (M is the size of the image of Associate in nursing) sub-bands of ripple, then unit area of the sub-bands of Curvelet made in operation to a totally different level.
2) level partitioning: each subband softens the window into" squares " of the applicable scale.
3) renormalization: a square of that unit of area is obtained once again normalized at Unit scale.
4) Ridgelet analysis: Ridgelet reworking [16] is calculated in each square result from the earliest stage
within the planned methodology, images of size 256 x 256 units of area thought out. A different wave is transformed at first to decompose the image into 3 levels that provide ten wave subbands. In totally different levels (2s, 2s + 1) of these sub-bands, unit of area of sub-bands Curvelet formed by partial reconstruction. therefore, the sub-band curve, s = 1 corresponds to the undulated sub-bands j = 0,1,2,3; sub-band curve, s = 2 corresponds to the undulated sub-bands j = 4,5 and sub-band curve, s = 3 corresponds to the undulated sub-bands j = 6,7. The subband Curvelet s = 1 could be a low pass band while s = 2 and s = 3 Upper pass bands area unit. The unit of area of curvelet sub-bands divided into blocks and renormalized on a unitary scale. The subbands, s = 2, are divided into nursing associate of eight by eight sets of squares, while the subbanda, s = 3 is divided into a set of squares of sixteen by sixteen. The reprocessing of Ridgelet is applied in each square of the previous stages for s = 2 and s = 3, which provides an array of Associate in Nursing of 256x256x2 that contains coefficients for each band. currently the coefficients donated in s = 1, 2, 3 unit of curved subbands area, options such as mean, variance, energy and unit of entropy area calculated and maintained as a vector of characteristics. These characteristic vectors were obtained for all photo area units Fed to the classifier for classification. Then apply the reverse curve rework to obtain the spatial domain image. This image overlaps the original image that applies the second-order gradient and highlights the infected half.
2.7 Hybrid model with Markov random field (MRF)
Markov random field (MRF) modeling is a statistical model that is not a segmentation method, but it is useful to extract regions within segmentation methods [14, 18]. The relation between the spatial pixels between their neighborhoods is obtained with MRF based model. A variety image property is extracted by correlation of pixels that belong to the same class with neighboring pixels [15]. MRF assumes that any unique structure may having only one gray value of pixel gives a low probability of occurrence [15]. In a Bayesian prior model, MRFs are frequently integrated into clustering segmentation methods [14, 18]. MRF segmented the image by enhancing a posteriori probability on image data with number of iterations [17] or simulated annealing [11].
Given an undirected graph H=(V,E), a set of random variables A=(Av)v∈V indexed by V from a Markov random field with respect to H if they satisfy the following equivalent Markov [18].
Let H(v,e) be a graph, y ε{0,1}|v| be a vector of labels, (0–back ground, 1-object)Pair of MRF energy:
$\mathrm{E}(\mathrm{y})=\sum_{v \varepsilon V} \varphi_{v}\left(y_{v}\right)+\sum_{(v, u) \in} \varphi_{v u}\left(y_{v}, y_{u}\right)$ (16)
In this process is to find y=argminyE(y).
Unary potentials $\varphi_{i}\left(v_{i}\right)$ are defined by the gray model which is tuned on images from label dataset. They define probability of each pixel being a part of object or background.
Binary potentials $\varphi_{i, j}\left(v_{i, j}\right)$ penalize labeling where a boundary between an object and a background lies across similar pixels
Examples
In a Bayesian network, one may calculate the conditional distribution a set of nodes V1 = {v1,v2,. . .,vi} are given values to another set of nodes W1={w1,w2,. .,wj} in the Markov random field by summing over all possible assignments to $u \notin V^{1}, W^{1}$; this is called exact inference [14, 15].
Since region based segmentation methods are not suitable for segmentation of curvilinear objects, a framework is proposed, which relies on a new region segmentation algorithm to address this issue.
2.7.1 Experimental details
MRF process: Curvilinear objects that are converted to be a graph labeling process. Define a Markov random field to get lead the graph structure. Let us consider X is the observation field, Y is the result field, xi and yi are the respective restriction to a given node i, YVi is the restriction of Y to the neighborhood of i. The variable yi give a Boolean realization, where ‘1’ labeled for suspect object and ‘0’ labeled for no object. Markovian assumption, the first energy terms, deals a priori knowledge regarding the curvilinear objects, and the second energy term which deals with labeling a appropriate information. Since, here it is expressed as an energy minimization problem by the object segmentation problem [11].
The MRF step consists of computing an area and labeling the closing of the potential image in a binary format and then running the watershed transform on a “closed” potential image which have minima is less value compare to the “original” potential image, that properly retaining ridge line’s location. Then watershed line incorporates the curvilinear objects. The ridge line has been formed a curve adjacency graph (CAG). The connected part of the ridge line that are separated by two adjacent basins. An edge is highlighted between two node pixels, in which one end of the first node is connected by a ridgeline to second end node such that forms a clear edge for an object. Each node pixel, the difference between edges approaching from links to one node end and those comes from links to the other node end. This process is executed until get a desired segmentation result.
2.8 Fuzzy techniques with MM
Zadeh had developed fuzzy sets from classic sharp sets in 1965. Fuzzy can have an effect on the intrinsic properties of images, which offer several results options for analysis [5].
Mathematical morphology could be a nonlinear method, showing powerful effects on the image process. It is compatible with pure mathematics, net and pure random mathematics. These are applied in various areas of image application, such as image enhancement, feature extraction, multi-scale filtering, detection and segmentation [6].
Since a segmentation technique supported the diffuse medium C cluster and the active contours, they were applied to medical imaging and knowledge was extracted [15, 18]. Zhang and Allebach [6] given a largely diffuse curve, it allowed the planned algorithmic rule to be rewritten and applied to completely different data sets of Mr images and detected the defects. G. Louverdis planned a morphological technique based mainly on diffuse to increase the Color Image. Sridhar et al. [18] planned a way to change the diffuse algorithmic rule c-mean for mammography segmentation. Includes mathematical morphology operator to improve the performance of the algorithmic rule. Sridhar and Reddy jointly planned [19] a discovery of diabetic retinopathy from complex images of body parts together with mathematical morphological operators to mark the regions.
Mathematical morphology could be a nonlinear method, showing powerful effects on the image process. It is compatible with pure mathematics, net and pure random mathematics. Here, The Associated forced operations of adaptive mathematical morphology (AMM), that square measure classified as accommodating relative to the spatial vicinity, which represents pure mathematics, sets of levels at totally different levels, standard filtering [15].
2.8.1 Adaptive mathematical morphological operators
Fundamental morphological operators are a type of hard and fast functions that show horizontal translation invariant or abstraction invariant. In AMM together with millimeter operators, non-linear filter operators are included. These filters are non-linear filters of range, median, stack type.
Suppose that f could be a part of a weighted structure with convolution of non-linear filter masks, such as a type of ar min, GHB and medium filters, A is that the input and x image is part of each set of "A". Dilation and erosion operators are expressed as
$D(f)=(f \oplus A)(x)=\vee y \in A(x) a(x-y)$ (17)
The AMM level could be a mounted operator, i.e. in magnitude I, then the weight family is an intensity operation and is denoted as a. then the adjustment operator is expressed as within the following equation
X (f) is a sign operator. Here Ψv decreases with the increase of the operator equation
$\Psi_{V}=V v \Psi v(X(f))$ (18)
A diffuse set is described as follows: If S could be a variety of objects, then a diffuse set FS in S is described as a group of order in (16) pairs:
$F S=\{(s, m f(s)) s \in S\}$ (19)
The set has no delineated boundaries. These are described by the operating membership. Sea m membership operates from article s in set S. membership values vary strictly from zero to one.
It provides a certain degree of truth. A diffuse rule contains subroutines of diffuse rules as shown in the condition [15].
If condition THEN conclusion (20)
Along these instructions logical operators are also used. Those are AND, OR, COMP. etc.
2.8.2 Experimental method
The AMM block consists of a space for reconstruction operations that can be applied to an image together with a non-linear filtering method in the resized image. The filtering method makes a morphologically operated image convolution. The mathematical logic operation contains a series of operations called fuzzification and membership function method based mainly on conditions [13]. Fuzzification normalizes the value gray from zero to one.
The mammographic image is the image of low distinction. Several classes of abundance appear to have a dynamic variation of intensity or level of gray with neighborhood pixels. The opera membership for the input image is represented
$\mu(x, y)=e^{-\frac{(l-I(x, y) / \sigma)^{2}}{2}}$ (21)
where, the gamma hydroxybutyrate level of Gray, the gray value of the input image and the variance of the gray values of most value to the area unit of the specific element denoted as l, i (x, y), σ at the same time.
The diffuse set is applied in a given normalized image to change the membership grade as follows.
$\operatorname{If}(\mathrm{I}(\mathrm{x}, \mathrm{y})=0.5), \mathrm{K}(\mathrm{x}, \mathrm{y})=\mathrm{n}^{*} \mu(x, y)^{\mathrm{n}} \mathrm{THEN} \mathrm{K}(\mathrm{x}, \mathrm{y})=1-$
$\mathrm{n}^{*}\left(1-\mu(x, y)^{\mathrm{n}}\right)$ (22)
Here I (x, y) is that the input image that normalizes and operates with membership is made of the Order n as indicated in the equation. K (x, y) precedes the intermediate value and defuzzification is performed by counting with the input dimension. To extract the varied intensity levels, the order value varies from one to the other, i.e. n = 1, 2, 3.
Let "n" receive a coffee value, then the Pixel value of the image becomes a high-distinction output at the same time in the opposite direction.
The proposed algorithm is implemented in MATLAB 7.8 software. To execute the detection part of this method here a MIAS database [12] and real-time are chosen for experiment. The mammograms were digitalized at a fixed resolution from the MIAS database [15]. The mammograms with shapes of lesions benign, malignant and normal are considered. The ground truth for each abnormality was also chosen from this database.
3.1 Morphology (Opening)
Morphological opening operator is an operation of dilation of erosion, it is also named Minkowski addition [6]. When the operator is applied, the separated view of image is obtained as shown in Figure 3 happens to be narrow isthmus part, and removed the isolated area. The system performs smoothing by opening for pre-processing of watershed algorithm.
Figure 3. Example of an output of morphological operation; a) input image, and b) the result given by opening operation
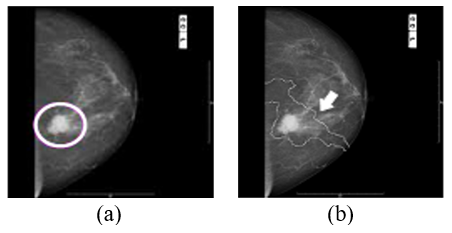
Figure 4 shows an example for comparison of doctor and system detection. The circle around the tumor shown in Figure 4 (a) is a malignant is found by the radiologist, and as shown in Figure 4 (b), the proposed system successfully segments the lesion that is marked around the region.
Figure 4. Example of system output; a) cancer clinically found by a doctor, and b) the result given by the proposed system
This method is suitable for detecting the mass location in the mammogram. However, it is unable to classify the benign and malignant mass in dense mammograms. To minimize the false classification of masses a new method is developed with modified marker-controlled watershed transform and artificial neural networks, which are discussed in the next section.
It is observed that minimum cluster of calcifications extended to 23 pixels in radius and maximum of upto 348 pixels. In all these mammograms calcifications are broadly scattered throughout the mammogram. Here, concentration is more on identifying calcification in order from normal to malignant. Similar ground truth is also applied to the real mammogram images.
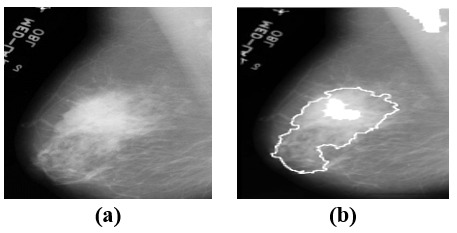
Figure 5 shows an example of a mammogram image is benign and with the detection of the shape of the lesion is superimposed on the input image.
Figure 5. Detection of benign mass (a) input mammogram (b) mass detection
The proposed method is based on simple mathematical morphology operations with watersheds to segment the mammogram. Evans and Liu [16] studied calcification structures and determined the detection lesions by morphological methods. Hendriks et al. [12] used a two-stage algorithm for spot detection and shape extraction. The method evaluated by the clustered neural network algorithm has been used. They achieved 97 percent of sensitivity and 70 percent specificity.
Similarly mass detection also experimented with transform and statics methods such as curvelet transform and Markov random fields explained in the next sections.
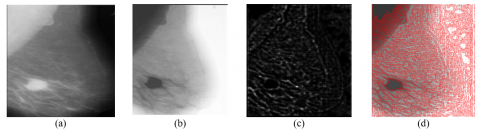
Figure 6(a) show a pre-processed carcinoma image of a breast-growing patient. Morphological operations of square measure applied to the image to isolate the pixels containing tumors from the rest of the image, shown in the Figure 6(b). Graph the image with the intensity of the X-Ray photograph marked with curve transforms shown in the Figure 6(c). With the help of an adaptive threshold and morphological operations, the image is divided. The malignant split overlaps in the input image as shown in the Figure 6(d).
In order to judge the performance of the proposed methodology, its performance measures were compared with measures derived from the methodology based mainly on mobile ridges. For this, the characteristic vectors were derived from the exploitation of growth images remodeling the mobile crest with 3 levels of decomposition and classified neural classification of identical exploitation. The projected methodology shows precision, sensitivity and, together, specifies that it is higher than moving ridges based mainly on strategies.
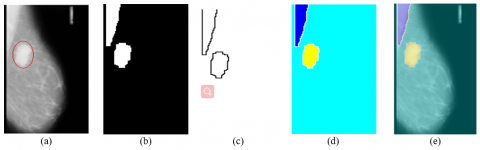
In medical image diagnosis, X-ray is considered as an exceptional imaging instrument [17]. Figure 7 shows an example application of the proposed method in segmenting a mammogram image. As shown in Figure 7(a), a mammogram image usually contains benign and malignant tumors. The most blurring prominent noise occur, that is a speckle noise that makes an artifact superimposed on mammogram, the speckle noise reduces the quality of the image. Morphological based filtering is used to suppress the speckle noise. Since the lesions usually have circle or elliptical shape, the marker-based system evaluation method is effective in this problem. From Figure 7(b) and Table 1, we can see that the marker-controlled watershed algorithm successfully identifies each lesion. The markers are generated by using MRF labeling process, from the segmented object image, the number and the size of lesion can be estimated easily.
Here a textural feature map generated a blurry boundary segmented output, however this provides a proper guidance for labeling the regions through a Markov random field process. The final segmentation shown in Figure 7(c) is obtained by applying watershed transform on image. Because of strong artifacts and low resolution, segmentation of mammograms images is generally difficult. To isolate the tumor region and better appearance the image converted in to pseudo color image by applying a color transformation technique which shown in Figure 7(d). In order to mark the tumor on input image the color segmented is superimposed which has shown in Figure 7(e).
Table 1. Comparation of the performance of algorithm
|
Method |
MIAS performance |
Real-time mammogram |
|
State vector machines |
95.11 |
95.52 |
|
Bayesian |
96.13 |
95.31 |
|
Artificial neural network |
93.94 |
94.3 |
|
Proposed method |
96.81 |
96.01 |
Figure 6. (a) Pre-processed images (b) morphological operations (c) segmentation of curvelet transforms (d) superimposition of segmented image on image by applying morphological gradient
Figure 7. (a) Pre-processed image a lesion marked by radiologist (b) marked image by MRF labeling process (c) watershed segment of an image (d) color transformation (e) super imposition segment image on input image
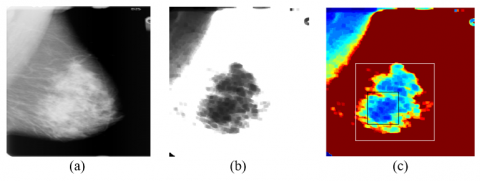
Figure 8. (a) Abnormal mammogram, (b) lesion detection, (c) color transformation
As demonstrated in this work, masses are detected efficiently by extracting information through intensity, edge, texture and density. Color representation developed that yellow color shows the tumors area, superimposition of this color segmentation on original medical image is shows more precisely where the tumor is located and also it gives whether tumor is benign and malignant. Radiologist can easily detect the where exactly tumors is located. This is an effective method for mammogram as well as ultrasound image-based breast segmentation. However, to guide a biopsy of breast tumor a fuzzy based techniques is more suitable which is discussed in the next sections.
In order to evaluate the performance of the approach, projected, used the database of the society of image analysis techniques for diagnosis (MIAS) [12] to classify the region's traditional and abnormal suspicious lesions in the unit area of X-ray image is analyzed. With regard to information, some problems should be taken into account [14] that the origin of the organization is at the bottom left corner of the X-ray image. The experimental results Area Unit provides an inventory of images in pairs: the even numbers correspond to the X-ray image of the left breast and the odd numbers correspond to the X-ray image of the right breast as shown in Figure 4. The scale of each image is 512X512 pixels and is focused within the Matrix. The Figure 8 is that the traditional image of x-ray samples of mammograms with many types of units of area of tissue tested, and the analysis is shown in fig. Here it is determined that abnormalities within the X-ray imaging area unit are difficult to see once there is an increase in density tissue changes associated with nursing.
Figure 8(a) is associated with an abnormal Nurse X-ray image. some of the batches within the X-ray image appear to be malignant, the results obtained clearly show the greasy space of the gray level image in Figure 8(b) and the color area illustration in Figure 8(c). show a malignant neoplasia and the size is calculated by distance network. Ten sets of X-ray images are experimented. Color classification are considered each pixel are transformed basing on the pixel intensity. Tumor are represented with blue colors and surrounded tissue pixels are represent with yellow, remaining pixels are displayed with other colors. The obtained results are easier to identify the tumor by the radiologist.
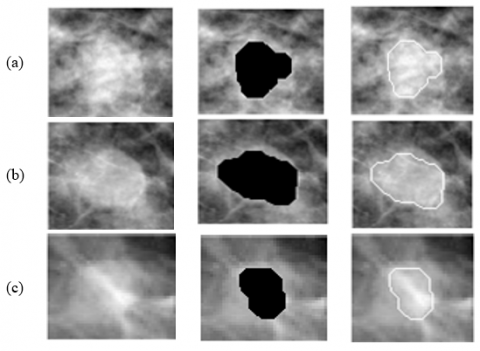
If the segmentation is focused based on the for Region of Interest (ROI). Here Gradient morphology has given the accurate results for examples consider ROI mammogram, The projected algorithmic rule is experimented with a varied X-ray taken largely from the MIAS information base and discovered the results shown in Figure 9(a) is that the input image, the Figure 9(b) is that the segmental space for adaptive mistreatment of bilateral filters, and Figure 9(c) segmental limit with operation of morphological gradient next to the MABF filters. Here, it offers 2 abundance options. they are the size of abundance and its shape.
Figure 9. (a) Partial malignant input masses, (b) segmented output, (c) segmented with boundary
The detection system, which extracts suspicious regions and their form from an X-ray, is applied. based mainly on the form of limit, the unit of abundance area classified as cancerous (malignant) or not and feasible to estimate the growth of cancerous growth. The performance of the system is evaluated and the human result Area Unit is compared with the results of clinical findings completed by the physician. the typical detection rate is eighty-six, you take care of thirty samples during this experiment, which demonstrates the system's performance. ROI based primarily is considered as secondary conformation of cancer if the suspect breast space is chosen. The CAD system has a comfortable capacity to support the appointment of the physician.
Medical image segmentation research is becoming efficient by using mathematical morphological (MM) operators. The developments carried out in the estimation of the risk factor by quantitative medical image analysis using MM operators and the correspondent prototypes are discussed. The proposed work develops an efficient medical image segmentation system for the complex images such as normal to complex mammograms. Here the basic tools in each algorithm are developed with mathematical morphology. Segmentation algorithms using watershed transform, marker-controlled watershed transform, morphological curvelet transform and then hybrid combinations comprised of mathematical morphology, watershed transform, & Markov random fields are developed. Segmentation results are evaluated with Neural Networks classifier. All algorithms are simulated with medical image data bases such as: MIAS, real time data. Performances of these algorithms are compared with performance metrics such accuracy, specificity and sensitivity. We have achieved the to 100% with inclusions of MM operators. The proposed detection methods of breast cancer are compared with existing methods [9-13]. We conclude that MM operators are explore medical image segmentations, in future MM operators provide an optimum result with machine learning and deep learning techniques.
[1] Nougrara, Z., Hachemi, K. (2019). Buildings extraction from imagery based on contextual information and mathematical morphology. Advances in Modelling and Analysis B, 62(2-4): 43-47. https://doi.org/10.18280/ama_b.622-402
[2] Bloch, I. (2020). Modeling imprecise and bipolar algebraic and topological relations using morphological dilations. Mathematical Morphology-Theory and Applications, 5(1): 1-20. https://doi.org/10.1515/mathm-2020-0107
[3] Leon, L.M., Ciesielski, K., Miranda, P.A. (2020). Efficient hierarchical multi-object segmentation in layered graphs. Mathematical Morphology - Theory and Applications, 5(1): 21-42. https://doi.org/10.1515/mathm-2020-0108
[4] Sanchez-Reyes, L.M., Rodriguez-Resendiz, J., Salazar-Colores, S., Avecilla-Ramírez, G.N., Pérez-Soto, G.I. (2020). A High-accuracy mathematical morphology and multilayer perceptron-based approach for melanoma detection. Applied Sciences, 10(3): 1098. https://doi.org/10.3390/app10031098
[5] Hassan, A.M., El-Shenawee, M. (2011). Review of electromagnetic techniques for breast cancer detection. IEEE Reviews in Biomedical Engineering, 4: 103-118. https://doi.org/10.1109/RBME.2011.2169780
[6] Zhang, B., Allebach, J.P. (2008). Adaptive bilateral filter for sharpness enhancement and noise removal. IEEE Transactions on Image Processing, 17(5): 664-678. https://doi.org/10.1109/TIP.2008.919949
[7] Li, H.D., Kallergi, M., Clarke, L.P., Jain, V.K., Clark, R.A. (1995). Markov random field for tumor detection in digital mammography. IEEE transactions on Medical Imaging, 14(3): 565-576. https://doi.org/10.1109/42.414622
[8] Sridhar, B., Sridhar, S., Nanchariah, V., Gayatri, K. (2021). Cluster medical image segmentation using morphological adaptive bilateral filter based BSA algorithm. 2021 5th International Conference on Trends in Electronics and Informatics (ICOEI), pp. 726-731. https://doi.org/10.1109/ICOEI51242.2021.9452816
[9] Regentova, E., Zhang, L., Zheng, J., Veni, G. (2007). Microcalcification detection based on wavelet domain hidden Markov tree model: Study for inclusion to computer aided diagnostic prompting system. Medical Physics, 34(6Part1): 2206-2219. https://doi.org/10.1118/1.2733800
[10] Haralick, R.M., Sternberg, S.R., Zhuang, X. (1987). Image analysis using mathematical morphology. IEEE Transactions on Pattern Analysis and Machine Intelligence, PAMI9(4): 532-550. https://doi.org/10.1109/TPAMI.1987.4767941
[11] Serra, J. (1982). Image Analysis Using Mathematical Morphology. Academic Press, London. https://doi.org/10.1002/cyto.990040213
[12] Hendriks, C.L., van Vliet, L.J. (2003). Discrete morphology with line structuring elements. International Conference on Computer Analysis of Images and Patterns, Groningen, The Netherlands, pp. 722-729. https://doi.org/10.1007/978-3-540-45179-2_88
[13] Li, D., Zhang, G., Wu, Z., Yi, L. (2010). An edge embedded marker-based watershed algorithm for high spatial resolution remote sensing image segmentation. IEEE Transactions on Image Processing, 19(10): 2781-2787. https://doi.org/10.1109/TIP.2010.2049528
[14] Devi, K.K., Anto, A., Peter, K.J. (2012). Curvelet transform and multi structure elements morphology by reconstruction based retinal image analysis. International Journal of Soft Computing and Engineering, 2: 548-553.
[15] Hamdi, M.A. (2011). Modified algorithm marker-controlled watershed transform for image segmentation based on curvelet threshold. Canadian Journal on Image Processing and Computer Vision, 2(8): 88-91.
[16] Evans, A.N., Liu, X.U. (2006). A morphological gradient approach to color edge detection. IEEE Transactions on Image Processing, 15(6): 1454-1463. https://doi.org/10.1109/TIP.2005.864164
[17] Keller, B., Nathan, D., Wang, Y., Zheng, Y., Gee, J., Conant, E., Kontos, D. (2011). Adaptive multi-cluster fuzzy C-means segmentation of breast parenchymal tissue in digital mammography. International conference on medical image computing and computer-assisted intervention, Toronto, Canada, pp. 562-569. https://doi.org/10.1007/978-3-642-23626-6_69
[18] Sridhar, B., Reddy, K.V.V.S., Prasad, A.M. (2015). Mammographic image analysis based on adaptive morphological fuzzy logic CAD system. International Journal of Biomedical Engineering and Technology, 17(4): 341-355. https://doi.org/10.1504/IJBET.2015.069399
[19] Sridhar, B., Reddy, K.V.V.S. (2013). Qualitative detection of breast cancer by morphological curvelet transform. 2013 8th International Conference on Computer Science & Education, Colombo, Sri Lanka, pp. 514-517. https://doi.org/10.1109/ICCSE.2013.6553964
[20] Aboutanos, G.B., Dawant, B.M. (1997). Automatic brain segmentation and validation: image-based versus atlas-based deformable models. Medical Imaging 1997: Image Processing, 3034: 299-310. https://doi.org/10.1117/12.274098
[21] Salzenstein, F., Collet, C. (2006). Fuzzy Markov random fields versus chains for multispectral image segmentation. IEEE Transactions on Pattern Analysis and Machine Intelligence, 28(11): 1753-1767. https://doi.org/10.1109/TPAMI.2006.228
[22] Maragos, P., Vachier, C. (2009). Overview of adaptive morphology: Trends and perspectives. 2009 16th IEEE International Conference on Image Processing (ICIP), Cairo, Egypt, pp. 2241-2244. https://doi.org/10.1109/ICIP.2009.5413961
[23] Liu, J., Liu, X., Chen, J., Tang, J. (2011). Mass segmentation in mammograms based on improved level set and watershed algorithm. International Conference on Intelligent Computing, Zhengzhou, China, pp. 502-508. https://doi.org/10.1007/978-3-642-25944-9_65
[24] Sridhar, B. (2020). A quality representation of tumor in breast using hybrid model watershed transform and Markov random fields. (2020) International Conference on Computer Communication and Informatics (ICCCI), pp. 1-5. https://doi.org/10.1109/ICCCI48352.2020.9104154