Eali Stephen Neal Joshua | Debnath Bhattacharyya | Midhun Chakkravarthy | Hye-Jin Kim*
© 2021 IIETA. This article is published by IIETA and is licensed under the CC BY 4.0 license (http://creativecommons.org/licenses/by/4.0/).
OPEN ACCESS
The leading cause of cancer-related death globally has been identified as lung cancer. Early lung nodule detection is critical for lung cancer therapy and patient survival. The Gard Cam++ Class Activation Function is used with a squeeze-and-excite network to provide a revolutionary method for differentiating malignant from benign lung nodules on CT scans. The new SENET (Squeeze-and-Excitation Networks) Grad Cam++ module, which combines the features calibration and discrimination benefits of SENET, has been shown to have a substantial potential for improving feature discriminability in lung cancer classification. According to the publicly available LUng Nodule Analysis 2016 (LUNA16) database, when assessed on 1230 nodules, the technique achieved an AUC of 0.9664 and an accuracy of 97.08% (600 malignant and 630 benign). The favorable results demonstrate the robustness of our technique to nodule classification, which we anticipate will be valuable in the future. The technology's objective is to aid radiologists in evaluating diagnostic data and differentiating benign from malignant lung nodules on CT images. To our knowledge, no systematic evaluation of SENET usefulness in classifying lung nodules has been done.
lung cancer, (SENET) squeeze and excite network, class activation, Grad-Cam++, deep learning, CNN, Luna-16, nodule
When it comes to the top cause of mortality in the world [1], lung cancer has surpassed all other cancers, accounting for the biggest number of deaths. According to cancer data, there are expected to be 142,670 lung cancer deaths in the United States in 2019, accounting for 23.51% [2] of all cancer patients in the country. Patients' 5-year survival rates climb from 19% to 54% when lung cancer is detected early, according to the American Lung Association [3]. As a result, early identification of lung cancer is crucial in order to maximize survival chances for patients. Typically, a nodule in the lungs is characterized by the presence of parenchymal lesions that are less than 3 cm [4] in diameter and that are spherical in shape. Figure 1 displays the categorization of lung nodules into two types: those that are malignant and those that are benign. The majority of the time, medical pictures such as magnetic resonance imaging (MRI), positron emission tomography [5] (PET), and computed tomography [6] (CT) scans may identify lung nodules (CT). When it comes to recognizing [7] and detecting nodules, low-dose CT has emerged as the most sensitive and extensively utilized imaging technology. The great spatial resolution, non-invasive nature, and cheap cost of CT screening [8] are the three most important advantages of this procedure. The appearance of nodules [9] as a regular or irregular white shadow on CT scans increases their visibility, increasing the likelihood that they will be discovered [10]. In a similar vein, the National Lung Screening Trial [11] (NLST) discovered that CT screening reduced lung cancer mortality [12] by 20%.
In order to arrive at an appropriate interpretation of the nodule, radiologists must analyse massive quantities of nodule data margin, scope, consistency, and outline, among other things from several CT scans, which is a complex and time-consuming job. Also contributing to a misunderstanding of the visual data are circumstances such as exhaustion, inattention, and a lack of professional skill, to name a few examples. Systemic computer-aided diagnostic [13] (CAD) systems, which comprise computer-aided detection (CADe) and computer-aided diagnosis (CADx) systems, have shown to be a very successful tool for the detection and diagnosis of lung cancer in a number [14] of studies. This research focuses on computer-aided diagnosis (CADx) systems, which make use of computed tomography (CT) images to identify and diagnose potentially harmful abnormalities. There are four primary processes in CADx systems, which are widely used in the pharmaceutical business and consist of data collecting, nodule segmentation, feature extraction, and nodule classification, among other things. When it comes to nodule diagnosis, one of these approaches, feature extraction, is quite useful. Overall, there are two types of nodule classification methodologies that are now accessible, and they may be alienated into 2 groups. Both malevolent and benevolent nodules may be distinguished using handmade characteristics retrieved using classic feature descriptors, while deep features learnt using different deep convolutional neural networks may be used to distinguish malignant and benign nodules as well (DCNNs).
Figure 1. The benign and malignant nodules in LUNA 16 benchmark dataset
The capacity to detect lung nodes using low dose computed tomography (CT) metaphors is critical in cancer transmission since it allows for early detection [15]. It is challenging to create deep learning models for nodule identification because of differences between positive and negative data. By merging a deep 3D convolutional neural network with an Encoder-Decoder structure as well as a region proposal network, we hope to improve on current nodule detection algorithms. We use an animatedly ascended cross entropy loss in nodule identification to counterbalance sample disproportion and the false positive rate in nodule identification. With the squeeze-and-excite structure, we may use interdependency information to identify essential image features that would otherwise go undetected. Verification of our methodology was performed using publicly available CT scans and ground truth data from LIDCT and IDRI, as well as the LUNA16 subset of the LUNA16 dataset. We were able to outperform rival detection systems in ablation testing and in-field testing by a significant margin.
SE-ResNet is a residual network that may be used to discover lung nodule candidates while simultaneously reducing the number of false positives [16]. The purpose of this 3D area proposal network is to identify potential lung nodule candidates for further investigation. A 3D SE-ResNet-based classifier is given to distinguish genuine nodules from false positives in order to improve accuracy. Recalibrating the channel-wise residual feature responses in 3D SE-ResNet modules is done in an acceptable manner. Both models make use of 3D SE-ResNet modules in order to learn nodule characteristics and improve nodule detection performance.
Among the leading causes of cancer-related death, lung cancer is by far the most frequent [17]. Early diagnosis of nodules is critical in the treatment and survival of lung cancer patients. By using computed tomography data, we demonstrate how the squeeze-and-excite network as well as aggregated residual changes may be utilised to distinguish between malignant and benign lung nodules (SE-ResNeXt). With this SE-ResNeXt module, you may significantly increase the distinguishing power and discriminability of features in picture shape appreciation. The approach is assessed using the Lung Nodule Analysis 2016 (LUNA16) database, which has 1004 nodules (450 malignant and 554 benign), with an AUC of 0.9563 and an accuracy of 91.67%. The database has an AUC of 0.9563 and an accuracy of 91.67%. The success of our technique in nodule categorization is shown by the high number of positive results obtained. This method may be useful to radiologists in the clinical setting for the discovery and differentiation of benign and malignant lung nodes on CT metaphors of the lungs. At this time, we are not aware of any study including the use of SE-ability ResNeXts to help in the classification of lung nodules.
The iterative development of radiation therapy treatment programmes consumes a significant amount of time and effort [18]. Treatment planning tool A-Net estimates the ideal 3D dose distribution for lung cancer patients using a probabilistic approach. To 392 lung cancer patients, it was provided at the indicated dosages of 50Gy and 60Gy, respectively. When working with GPU memory limits, A-Net makes use of asymmetric encoders and decoders to preserve input data. The SE units are used to increase the ability to fit data to a given set of parameters. The dosage distribution as well as the recommended dosage are both included in the ground truth loss calculations. For the most part, A-performance Net's performance is comparable to that of HD-UNET and 3D-Unet, while there are a few instances when it is somewhat better. The A-measures Nets performed much better in both the 50Gy and 60Gy samples. Finally, A-Net successfully predicts the dosage distribution in each of the three datasets tested.
Lung cancer must be recognised and diagnosed as soon as possible in order to increase the chances of survival [19]. Deep learning is becoming more and more important in medical diagnostics. Deep learning-based nodule recognition system performed well, however the generalization-performance issue remained unaddressed owing to the unequal distribution of data in the training data. This difficulty was addressed by developing a single-stage, double three-dimensional (3D) squeeze-and-excitation (SE) network. The two-dimensional (2D) SE network is constructed from a single three-dimensional (3D) SE network that specifies in great detail the relationship between channels and channel depths. Because a CT image frequently only contains a few numbers of group truth 3D pulmonary nodules, the new nodules are constructed from the other CT images in the training dataset. This is done to ensure that the training dataset is as accurate as possible. Our approaches were tested against the LUNA16 dataset, and we were able to achieve a sensitivity of 97.3%. Any single-stage approach now available outperformed the results obtained with this approach.
Lung cancer is the most common and severe illness that affects people's health all over the world, and it is also the most preventable [20]. For the purpose of preventing and diagnosing lung cancer, it is vital to recognise and identify lung nodules as soon as they are seen and identified. In this study, a unique Squeeze-and-Excitation Convolutional Neural Network structure is constructed using Squeeze-and-Excitation techniques. According to the results, the SE-CNN can discriminate between benign and malignant lung nodules in a clinical setting. When it comes to distinguishing between benign and malignant lung nodules, SE-CNN is more accurate than conventional CT imaging methods.
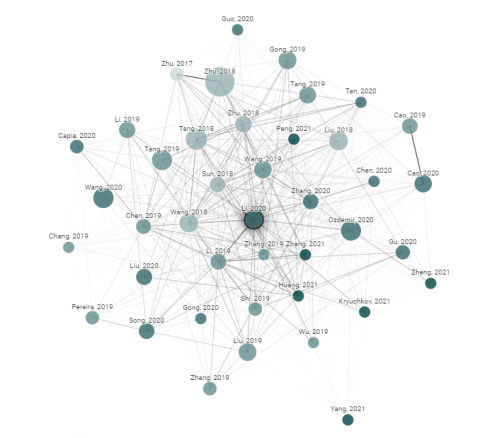
Figure 2. Graph shows the literature review on academic paper related to origin of the paper. Node Citations and Size represents the citations and publishing year. Similar papers have strong Connection
Figure 2 shows the literature work done on the various origins of the paper. Here the bigger node represents the citations and publishing year. We have taken Similar papers and strong connections for the Literature survey.
The proposed technique for the classification of benevolent and malevolent lung nodes is divided into 3 major stages. These are as follows:
(1) Image data gaining from the “LUNA16” database.
(2) Node Cataloguing using Squeeze and Excitation extraction of nodules.
(3) Feeding classified image to Gard-Cam++ Activation function for the foreseeable future classification.
3.1 Proposed model
3.1.1 Data acquisition from LUNA-16 benchmark dataset
This study uses the Lung Image Database Consortium image collection (LIDC–IDRI) dataset, which has been upgraded from the freely accessible Lung Image Database Consortium dataset (LIDC–IDRI). Thin-slice CT scans are optional by the American College of Radiology for nodule identification and categorization. Because of this, scans having slice thicknesses larger than 3 mm, images with uneven slice spacing, and scans with missing slices were rejected. Another precaution, given that physicians' experience has shown that tiny nodules are usually innocuous, is to remove any nodules with a diameter of less than 3 mm simply to be careful. We discovered 888 CT images with 1004 nodules and selected all of them, yielding a total of 888 CT images with 1004 nodules. Four radiologists with extensive experience provided comments for each CT image. The annotations in the dataset were acquired as part of a two-phase image annotation methodology that was acknowledged by at least three out of four radiologists in the study. most specific characteristics, such as node positions, diameters, and malevolence stages (from 1 to 5). "A cancer risk of Level 1 indicates that there is no chance of developing cancer; a cancer risk of Level 2 indicates that cancer development is only possible; a cancer risk of Level 3 indicates that disease development is slightly likely; a cancer risk of Level 4 indicates that disease development is more likely; and a cancer risk of Level 5 indicates that disease development is very likely."
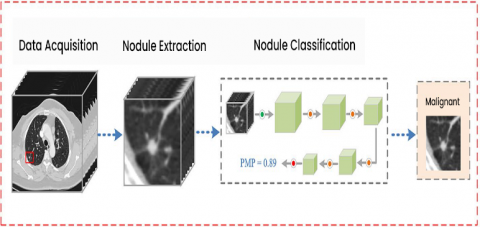
Figure 3. Background of the anticipated node diagnosis method
3.1.2 Data extraction
To ensure that the learning model is correctly trained, 3D patches containing lung nodules are clipped from raw CT images and inserted in the network to serve as training examples. In the centre of each nodule is a cantered patch of fungus. Expert radiologists estimate that the two greatest diameters of the nodules that were selected are 33.26 mm and 31.62 mm, with the other node sizes ranging from 3.1 mm to 35 mm. Nodule sizes were chosen at random from the LUNA16 database, and the distribution of nodule sizes is shown in Table 1. Nodules that are not cancerous are often smaller in size than nodules that are cancerous; however, this is not always the case. Due to the large number of nodules that were chosen, the scope of the contribution patch has been expanded to 32*32*32 in order to capture the majority of them chosen. Figure 3 shows the brief view of our proposed model. Diagram Showing Data acquisition, Node Extraction and Nodule Classification to check weather it is Benign or Malignant.
Table 1. The spreading of node dimensions in the LUNA16 database
|
Number of Nodules |
Lung Nodules size in MM |
||||
|
Size in mm |
(0,10) |
(10,20) |
(20,30) |
(30,36) |
Total |
|
Benign |
554 |
16 |
1 |
0 |
571 |
|
Malignant |
256 |
234 |
56 |
8 |
554 |
3.1.3 Basic structure of squeeze-and-excitation networks
SENETS are a type of CNN that, despite having limited computational power, increases channel interdependence. SENETS are a type of CNN that is subdivided. Through the use of channel adjustments for each conversion block, we were able to fine-tune the weighting on each feature map. Using these filters, CNNs are able to extract hierarchical information from images. Higher layers are capable of detecting faces, text, and other complex geometric shapes, whereas lower layers are only capable of detecting borders or extremely high frequencies. They gather all of the information necessary to complete a task in a short period of time. This is accomplished through the combination of space and image data. Following that, the filters will combine data from all of the output channels that are currently available. When the network generates output charts, it assigns the same weight to each of the channels. SENets intends to alter the channel weighting by incorporating a content-aware mechanism into its network. In its most basic form, this entails assigning a single parameter and linear scalar to each of the channels.
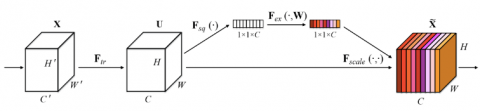
Figure 4 shows the Squeeze and Excitation Network and working of the proposed Model for classification of the Lung Cancer Nodules.
In convolutional neural networks (CNNs), SENETS (Squeeze-and-Excitation Networks) are a novel kind of building component that enhances channel dependence while requiring low computational effort. As a reminder, the basic notion is as follows: A convolutional block should have parameters assigned to each of the channels, which will allow the network to adjust the weighting of each feature map as necessary, as shown in the example. When CNNs analyse images, convolutional filters are used to collect hierarchical information contained within the images. Higher degrees of intelligence may be able to recognise faces, language, and other complex geometrical patterns that are undetectable to lesser levels of intelligence. Figure 5 shows the detailed view of the proposed Model.
They gather whatever information is necessary in order to complete a task properly. By merging the spatial and channel data contained inside a single image, this may be done. The different filters will search for spatial components in each individual input channel before aggregating the data over all available output channels to get a final conclusion. When the network is constructing the output feature maps, it provides equal weight to each of the channels that it has. SENETS objective of revolutionising the Internet involves including a content-aware technique for adaptively weighing each channel as part of its overall objective of revolutionising the Internet. In its most basic form, this may be accomplished by assigning a single parameter to each channel and processing it as if it were a linear scalar value. For each channel, they begin by condensing its feature maps into a single numerical value, which they then use to get a global understanding of that channel. This results in an n-dimensional vector, where n is the number of convolutional channels in the underlying technique used to generate the vector. Data is then fed into a two-layer neural network, which generates a result with a size equal to or greater than that of the input vector. Now that the n values have been determined, they may be used as weights on the original feature maps, allowing for accurate scaling of each channel.
Figure 4. The basic structure of the squeeze and excitation network for the lung cancer classification
Figure 5. The structure of proposed network SENETS
3.1.4 SENETS with Grad Cam++ Class activation
According to this research, we can use this method to offer visual explanations by highlighting discriminative areas in the model, which is a very strong strategy for finding out how to make the model interpretable for those who are not familiar with the domain. Essentially, we want to develop a 3D CNN with the highest level of accuracy possible while simultaneously providing visual insights into the model's decision-making processes. This study proposes grade cam++ techniques for visual nations based on a single module categorization, which is shown by a single module classification in this study. Grad-CAM++ is supported by a large number of different CNN models. It generates a visual image that distinguishes between different classes of people. It also informs you of the model's failure modes, should they occur. To determine the importance of each neuron for a particular decision, Grad-CAM++ examines the information on the gradient that is passed into the final convolutional layer of the CNN, which is called the final convolutional layer.
$Y_{G r a d-C a m}^{a}=\sum_{p}^{1} w_{p}^{q} \frac{1}{z} \sum_{i} 1 \sum_{j} A_{i j}^{p}$ (1)
Eq. (1) is used to calculate the average pooled global Output of the Squeeze and Excitation Network.
Let us define JP to be average pooled global output
$J^{p}=\frac{1}{z} \sum_{i} * \sum_{j} A_{i j}^{p}$ (2)
Grad-Cam++ Computes the end scores by gradient via back propagation of the network JP is the object of the prediction and their confidence of the image, nodule classification with discriminative regions, object annotations.
$Y_{G r a d-C a m}^{a}=\sum_{p}^{1} * w_{p}^{q} * J^{p}$ (3)
where, $w_{p}^{q}$ is the weight connecting the Kth Feature map with forward activation maps with non-linearity to the squeeze and Excitation Network.
Taking the gradient class score (JP) w.r.t to feature map we get.
$\frac{\delta y_{1}^{c}}{\delta J_{1}^{p}}=\frac{\frac{\delta y^{c}}{\delta A_{i j}^{p}}}{\frac{\delta J^{p}}{\delta A_{i j}^{p}}}$ (4)
Taking Partial Derivation (4) w.r.t. $A_{i j}^{p}$ ; We can see that $\frac{\delta J^{p}}{\delta A_{i j}^{p}}=\frac{1}{z}$ . Substituting this on (4) we get Grad-CAM++, which uses a weighted combination of the positive partial derivatives of the last convolutional layer feature maps with respect to a specific class score as weights to generate a visual explanation for the class label under consideration.
$\frac{\delta y_{1}^{c}}{\delta J_{1}^{p}}=\frac{\delta y^{c}}{\delta A_{i j}^{p}} * z$ (5)
From (3) We get
$w_{p}^{q}=z * \frac{\delta J^{p}}{\delta A_{i j}^{p}}$ (6)
Summing both sides of (6) we get to know the $Z * \frac{\delta J^{p}}{\delta A_{i j}^{p}}$ visualize Convolutional Networks and understand what is learnt by each neuron.
$\sum_{i} \sum_{j} W_{p}^{q}=\sum_{i} \sum_{j} z * \frac{\delta y^{c}}{\delta A_{i j}^{p}}$ (7)
Therefore $\frac{\delta y^{c}}{\delta A_{i j}^{p}}$ is used for the pixel wise Value and the true value of the lung nodule.
$w_{p}^{q}=\sum_{i} \sum_{j} \frac{\delta y^{c}}{\delta A_{i j}^{p}}$ (8)
Because of this, Grad-Cam++ may be considered to be a rigorous generalisation of the class activation. It is possible to offer a visual explanation for domain experts by creating a 3D CNN-based model, which makes the procedure both lighter and more sophisticated due to this generalisation. As a consequence, computer tomography scans will be able to pinpoint the exact site of the tumour. To construct a Mish, we do a weighted combination of forward activation maps followed by a ReLu.
$L N_{G r a d-C a m}^{a}=\operatorname{Re} L u\left(\sum_{k} \alpha_{k}^{c} A^{k}\right)$ (9)
From the Eq. (9), we pointwise multiply the up-sampled (to image resolution) saliency map Lc with the pixel-space visualisation generated by Guided Backpropagation in order to generate class-discriminative saliency maps with the richness of pixels-space gradient visualisation methods. Grad CAM++ makes use of a technique that is similar. Guided Representations using Grad-Cam++ are the end result of this procedure.
SEGNET is being investigated and developed with the goal of improving the accuracy and confidence in the identification of lung nodules and CT scan data compared to current models, with the ultimate goal of aiding in the early diagnosis of lung cancer in order to enhance survival and prognosis.
3.1.5 Class discrimination and trust
These methods are each devolutionised, with redirected background and Grad-cam++ versions available (Deconvolution Grad-CAM and Guided Grad-CAM). It is possible to visualise 160 different images of the lung nodule in order to answer the question "What image represents the two categories of objects?" During the testing process, a total of 90 pairs of images (360 visualisations) were used. The following 9 people have given their opinions. The category visualised is correctly identified by humans when they view Grad-cam++ (63.43% when viewing Guided Backpropagation, compared to 44.44% when viewing Grad-CAM++; thus, Grad-cam++ improves human performance by 16.79%). Grad-CAM++, on the other hand, would appear to be more discriminatory in its treatment of Deconvolution (from 54.36% to 62.32%). Grad-cam++ outperforms all of the other methods. It was taken into consideration only when the two models predicted the same outcome as the fundamental truth. Using 54 lung nodules, the model's reliability was assessed using three different levels of reliability: outstandingly more/unreliable (+/-2), slightly more/unreliable (+/-1), and equally reliable (+/-1). (0). Despite the fact that the predictions are identical, noduled subjects can identify the more accurate classifier by examining different explications.
3.1.6 Nodule classification network parameters
Figure 6 displays a SENETS network with Grad Cam++ class activation for the classification of lung nodules. A total of 32 x 32 x 32 image patches is supplied into the network as input. For the first time, a convolutional level is used in the generation of the feature map (3 x 3). Table 2 shows the Parameter of the Proposed Classification Network
In order to get the necessary results, SENET blocks are interposed with the average-pooling layers, which are interleaved with four average-pooling layers, which are interleaved with four average-pooling layers. Three Squeeze and Excitation modules are included inside each of the four Squeeze and Excitation blocks (the first, second, and third), with the first block containing four modules, the second including six modules, and the third including three modules. Using a average-pooling layer, each block is segregated from the rest of the blocks. The last layer of the network is composed of three layers, which are arranged in the following sequence: an average pooling layer, an FC layer, and a SoftMax layer (in that order). It is shown in this study how to solve a binary classification issue using the cross-entropy loss function. Following the SoftMax, the projected malignant probability (PMP) of each lung nodule may be estimated individually.
Figure 6. The SENETs with Grad Cam++ Class activation
Figure 7. The proposed architecture
Table 2. The parameters of the proposed network
|
Layers |
Type |
Activation Shape |
Activation Size |
#Parameters |
|
CNN |
Conv_1 |
(32,32,3) |
3072 |
0 |
|
CNN |
Average_pooling_1 |
(28,28,8) |
6272 |
208* |
|
SE_BLOCK_1 |
Recalibration |
(14.14,8) |
1568 |
0 |
|
CNN_2 |
Conv_1 |
(10,10,16) |
1600 |
416* |
|
CNN_2 |
Conv_1 |
(5,5,16) |
400 |
0 |
|
CNN_2 |
Average_pooling_2 |
(12,0,1) |
120 |
48001 |
|
SE_BLOCK_2 |
Recalibration |
(84,1) |
84 |
10081 |
|
Fully_Connected_1 |
SoftMax |
(10,1) |
10 |
841 |
|
Output |
ReLU |
2*1 |
- |
Malignancy/Benign |
Table 1 shows that there are 1230 [21] clinical thoracic computed CT images are included in the LUNA16 collection. This study excludes CT scans with slice thicknesses more than 3 mm or images with uneven slice spacing. This research included contributions from four thoracic radiologists with substantial experience in picture annotation. On a scale of 1 to 10, each radiologist labelled the lesions that they considered to be nodules as non-nodule, nodule 3 mm, and nodules >= 3 mm. All nodules larger than 3 mm in diameter that have been approved by at least three out of four radiologists form the reference standard. The pictures of benign and malignant tumour are shown in Figure 7.
The training process is basically some images X input into the model and then this model makes some predictions and then this output or the predictions as compared with the actual value of the label which is Y and some loss function that is Binary Cross Entropy is used for computation for image classification. It is a method of determining which model the data is using in conjunction with the algorithm. If your forecasts turn out to be completely incorrect, your loss function will be larger. If they're pretty good, the result will offer you a lower score.
Figure 8 shows the data preprocessing of the LUNA 16 Dataset. Figure 8.a shows the Nodule Images and Figure 8.b showing the Non-Nodule Images.
In most cases Squeeze and Excitation Network use a cross-entropy loss on the one-hot encoded output. For a single image the cross-entropy loss looks like this:
$-\sum_{C=1}^{M}\left(y c \cdot \log y_{c}\right)$ (10)
where, M is the number of classes (i.e., 1000 in ImageNet) and y^c is the model's prediction for that class (i.e., the output of the SoftMax for class c). Due to the fact that the labels are one-hot encoded and y is a (1000×1) vector of ones and zeroes, yc is either 1 or 0. Thus, out of the whole sum only one term will actually be added: the one with yc=1.
This loss function says how far away we are from where we want to be and how we can minimize this loss, so that this model is updated and is better at predicting what we're trying to do. The optimization of this loss function is basically where we update the model with new parameters and, in this case, as we talked, the new parameters would be the values inside of the kernels, as we were speaking about earlier, as opposed to traditional weights and artificial neural networks. During the training process, the SoftMax activation function was used before loss was calculated and cross-entropy was used as the loss function to be optimized and all of the models used an optimizer with default parameters and a learning rate of 0.30 in and out. We can use different optimizers, so the idea is that we can change these things and try and get a better model.
(a)
(b)
Figure 8. (a) Nodule image vs (b) Non-nodule image
We want to evaluate the model with some key metrics, so some of the ones that are used widely are precision recall and accuracy. It's just how many you got right out of the total recall is how many you were able to detect of all the positive values and finally precision is out of the ones you've labelled as positive How many are actually positive? They are all useful for different reasons to detect as many nodules as possible to have a high recall, but you don't want to sacrifice precision.
We redetected with a lung nodule early on, it can save a life, as opposed to a false positive, which will probably show that the patient isn't good for them, but it's not the same impact as just missing the nodule entirely, so the final outcome is the same. A graduate camera was used to visualize CNN in order to understand how the model made its decisions. Grad-Cam++ is basically an algorithm that uses the penultimate or the convolution alert right before the fully connected layers and it uses the activation from this con Blair and it can utilize spatial information in this con where it's completely lost in the later dense layers, so this is a critical step to gaining insight.
We worked with the Kerras and TensorFlow libraries in Python, and I used a library called the corrals visualization toolkit for my grad cam algorithm and we used SK learning on metrics to get the metrics for all of the decisions and models.
In order to evaluate the methodology, the researchers employed the LUNA16 nodule database, which has 1004 nodules. The image data was separated into 10 subgroups at random, with each subgroup being cross-validated 10 times. As a result, all of the image data was divided into 10 subsets that were distributed equally and randomly. It was necessary to analyse nine sets of training data in order to determine which ones should be used, however only one set of testing data was assessed throughout the process. This method of classifying nodule-level trials into binary categories included averaging the levels of each nodule and labelling them as questionable or certain depending on whether the final average level was more than or equal to 3. The presence of a malignant nodule is determined by the average final level of the nodule being more than 3. However, there is no scientific evidence to suggest that they are harmful to humans. The LIDC–IDRI database was used to collect all of the annotations for the item in question. The chance of malignancy was projected to aid radiologists in their diagnosis, and in addition, Windows 10 and Ryazan 9 series CPUs, as well as 12 GB graphics cards, were used in each of the tests.
5.1 Implementation details
Figure 9. Classification accuracies of diverse frameworks with comparison with different classifiers
Figure 9 shows the performance evaluation of the proposed model with other classifiers.
Several CT scanners were utilised in the same experiment to analyse images from the LUNA16 database, which was conducted on the same day. Before the training method, all CT scans were resampled to the same exact resolution of 1 mm, which is one millimetre by one millimetre: one millimetre by one millimetre. To scale the pixel values of the clipped region, they were first normalised to the range [0, 1] and then truncated to the range [1200, 600]. For the purpose of reducing overfitting, data augmentation was performed to the training dataset, which was checked for accuracy by randomly flipping and rotating the patches on the training dataset. The stochastic gradient descent algorithm was used to optimise the learning process (SGD). The process had an impetus of 0.9, and its weight decay was more than 1,000 times more than that of the process. Furthermore, since there was a restriction on the amount of GPU RAM that could be used, the batch size was restricted to a maximum of 24 persons per batch. A total of 150 training sessions were conducted using the learning model. Initially, the initial learning rate was 0.001, and after 60 epochs, it was 0.0001, and after 120 epochs, it was 0.0001. Using the AUC score and accuracy calculations, as well as the average performance on each of the 10 test folds, the suggested methodology was assessed. As for the accuracy of lung nodule diagnosis, it is defined as the fraction of correctly identified nodules, and it is provided in the following as:
$\text { Accuracy }=\frac{T P+T N}{T P+F N+F P+F N}$ (11)
$\text { Sensitivity }=T P /(T P+F N)$ (12)
$\text { Specificity }=T N /(T N+F P)$ (13)
$\text { Precision }=T P /(T P+F P)$ (14)
$\begin{aligned}
&F P R=F P /(F P+T N) \\
&T P R=T P /(T P+F N)
\end{aligned}$ (15)
where, the TP is true positive, TN is true negative, FP is false positive, and FN is false negative.
From the Table 3, it was very clear that our classifier SENETS-Grad-Cam++ has outperformed remaining all the classifiers in terms of the performance metrics like AUC and accuracy on LUNA 16 benchmark dataset.
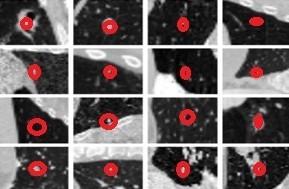
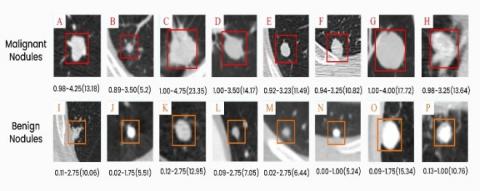
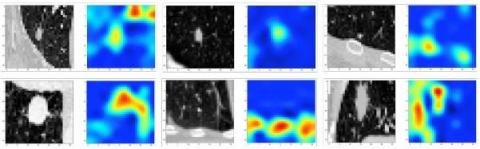
Figure 11 and 12 Shows the Model Classification after the Testing. The red heat map shows the benign lung nodule classification. Thus as a results it would be easy for the radiologists to classifier the tumor.
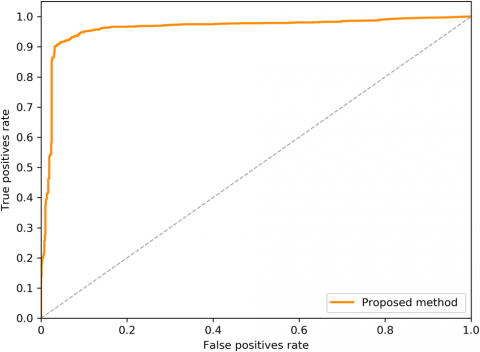
From the Table 4 it was clearly evident that our method was performed very well with few samples size from LUNA 16 dataset. The results clearly shows that out proposed model and method are good at classifying odd benign and Malignant tumours. As, a result the model has achieved a trust gain when compared with various others methods. From the Figure 10 we can clearly state that with ROC curve performance our model has out performed when compared with other classifiers.
Figure 10. ROC curve showing the proposed classifier
Figure 11. Visualization of benign and malignant nodule classifications. Malignant prognosis, four radiologists, and nodule diameter (mm)
Figure 12. Grad Cam++ visualization of the malignant nodules after classification
Table 3. Evaluation of proposed with other procedures based on handcrafted structures
|
Author’s |
Year |
Features |
Classifier |
Database |
Samples |
AUC |
Accuracy |
|
de Carvalho et al. [22] |
2016 |
Intensity Features |
SVM |
LIDC |
86 |
0.9557 |
95.53 |
|
Ferreira et al. [23] |
2017 |
Shape Features |
RF |
LIDC |
1406 |
- |
92.20 |
|
Jalalimanesh et al. [24] |
2018 |
Texture Feature |
MLP |
LIDC |
1406 |
- |
90.68 |
|
Hu et al. [25] |
2018 |
Morphology Feature |
MLP, KNN |
LIDC |
1178 |
0.8669 |
79.35 |
|
Gong et al. [26] |
2018 |
Size Feature |
NBC, LDA |
LIDC |
150 |
- |
94.89 |
|
Xie et al. [27] |
2018 |
Classical Random Features |
BPNN |
LIDC |
1363 |
092 |
91.13 |
|
Kaya et al. [28] |
2018 |
Wavelet Feature |
CC |
LIDC |
570 |
0.65 |
91.13 |
|
Proposed Work |
2021 |
SENETS-GRAD-CAM++ |
|
LIDC/LUNA16 |
1200 |
0.9664 |
97.08 |
Table 4. Assessment of the proposed methods with other approaches based on deep learning topographies
|
Authors |
Year |
Method |
Database |
Samples |
AUC |
Accuracy |
|
Neal Joshua et al. [29] |
2021 |
3D -CNN |
LIDC |
2619 |
0.91 |
90.15 |
|
Nibali et al. [30] |
2017 |
2D- ResNet |
LIDC |
487 |
0.77 |
- |
|
Zhu et al. [31] |
2018 |
2D -DPN |
LIDC |
890 |
0.9658 |
90.91 |
|
Mao et al. [32] |
2018 |
2D- DAE |
LIDC |
2889 |
0.95 |
93.85 |
|
Shen et.al. [33] |
2016 |
3D -MCCNN |
LIDC |
1200 |
- |
91.44 |
|
Liu et al. [34] |
2018 |
3D- SE-ResNeXt |
LIDC |
60 |
0.9440 |
90.58 |
|
Proposed Work |
2021 |
SENETS-GRAD-CAM++ |
LUNA16 |
1230 |
0.9664 |
97.08 |
As part of this study, we developed a unique End-to-End 3D deep learning network inside an Encoder-Decoder architecture that employs Squeeze-and-Excitation structures for the detection of pulmonary nodules in low-dose lung CT images, which was evaluated. Targeted classification loss was applied in the proposed network in order to solve the challenges caused by sample imbalance and to reduce the frequency of false positives in the data set, respectively. With regard to the performance of our nodule identification model, we ran a large number of trials on the LUNA16 and LIDC/IDRI datasets, and the results revealed that our model outperforms state-of-the-art techniques that employ the same network backbone, as shown in Figure 1. According to ablation research, both the Squeeze-and-Excite structure and the localised categorization loss are crucial in improving the ability to identify nodules and other abnormalities in the brain. Our future research will be focused on enhancing existing methodologies and building deep learning algorithms to characterise lung nodules in order to better classify them in the future.
I want to thank Dr. Debnath Bhattacharya for thoroughly encouraging to conduct research on this topic.
[1] Qin, R., Wang, Z., Jiang, L., Qiao, K., Hai, J., Chen, J., Yan, B. (2020). Fine-grained lung cancer classification from PET and CT images based on multidimensional attention mechanism. Complexity, 2020: 1-12. https://doi.org/10.1155/2020/6153657
[2] Ardila, D., Kiraly, A.P., Bharadwaj, S., Choi, B., Reicher, J.J., Peng, L., Shetty, S. (2019). End-to-end lung cancer screening with three-dimensional deep learning on low-dose chest computed tomography. Nature Medicine, 25(6) 954-961. https://doi.org/10.1038/s41591-019-0447-x
[3] Liu, Z., Wang, S., Di Dong, J. W., Fang, C., Zhou, X., Sun, K., Tian, J. (2019). The applications of radiomics in precision diagnosis and treatment of oncology: opportunities and challenges. Theranostics, 9(5): 1303. https://doi.org/10.7150/thno.30309
[4] Kumari, N.M.J., Krishna, K.K. (2018). Prognosis of diseases using machine learning algorithms: A survey. In 2018 International Conference on Current Trends towards Converging Technologies (ICCTCT), pp. 1-9. https://doi.org/10.1109/ICCTCT.2018.8550902
[5] Liao, F., Liang, M., Li, Z., Hu, X., Song, S. (2019). Evaluate the malignancy of pulmonary nodules using the 3-d deep leaky noisy-or network. IEEE Transactions on Neural Networks and Learning Systems, 30(11): 3484-3495. https://doi.org/10.1109/TNNLS.2019.2892409
[6] Wang, S., Shi, J., Ye, Z., Dong, D., Yu, D., Zhou, M., Tian, J. (2019). Predicting EGFR mutation status in lung adenocarcinoma on computed tomography image using deep learning. European Respiratory Journal, 53(3): 18009860 https://doi.org/10.1183/13993003.00986-2018
[7] Bhattacharyya, D., Kumari, N.M.J., Joshua, E.S.N., Rao, N.T. (2020). Advanced empirical studies on group governance of the novel corona virus, MERS, SARS and EBOLA: A systematic study. International Journal of Current Research and Review, 12(18): 35-41. https://doi.org/10.31782/IJCRR.2020.121828
[8] Xie, Y., Xia, Y., Zhang, J., Song, Y., Feng, D., Fulham, M., Cai, W. (2018). Knowledge-based collaborative deep learning for benign-malignant lung nodule classification on chest CT. IEEE Transactions on Medical Imaging, 38(4): 991-1004. https://doi.org/10.1109/TMI.2018.2876510
[9] Bulik-Sullivan, B., Busby, J., Palmer, C.D., Davis, M.J., Murphy, T., Clark, A., Yelensky, R. (2019). Deep learning using tumor HLA peptide mass spectrometry datasets improves neoantigen identification. Nature Biotechnology, 37(1): 55-63. https://doi.org/10.1038/nbt.4313
[10] Alom, M.Z., Yakopcic, C., Hasan, M., Taha, T.M., Asari, V.K. (2019). Recurrent residual U-Net for medical image segmentation. Journal of Medical Imaging, 6(1): 014006. https://doi.org/10.1117/1.JMI.6.1.014006
[11] Munir, K., Elahi, H., Ayub, A., Frezza, F., Rizzi, A. (2019). Cancer diagnosis using deep learning: A bibliographic review. Cancers, 11(9): 1235. http://dx.doi.org/10.3390/cancers11091235
[12] Nasrullah, N., Sang, J., Alam, M.S., Mateen, M., Cai, B., Hu, H. (2019). Automated lung nodule detection and classification using deep learning combined with multiple strategies. Sensors, 19(17): 3722. http://dx.doi.org/10.3390/s19173722
[13] Gerard, S.E., Patton, T.J., Christensen, G.E., Bayouth, J. E., Reinhardt, J.M. (2018). FissureNet: A deep learning approach for pulmonary fissure detection in CT images. IEEE Transactions on Medical Imaging, 38(1): 156-166. https://doi.org/10.1109/TMI.2018.2858202
[14] Gao, J., Jiang, Q., Zhou, B., Chen, D. (2019). Convolutional neural networks for computer-aided detection or diagnosis in medical image analysis: An overview. Mathematical Biosciences and Engineering, 16(6): 6536-6561. https://doi.org/10.3934/mbe.2019326
[15] Li, Y., Fan, Y. (2020). DeepSEED: 3D squeeze-and-excitation encoder-decoder convolutional neural networks for pulmonary nodule detection. 2020 IEEE 17th International Symposium on Biomedical Imaging (ISBI), pp. 1866-1869. https://doi.org/10.1109/ISBI45749.2020.9098317
[16] Gong, L., Jiang, S., Yang, Z., Zhang, G., Wang, L. (2019). Automated pulmonary nodule detection in CT images using 3D deep squeeze-and-excitation networks. International Journal of Computer Assisted Radiology and Surgery, 14(11): 1969-1979. https://doi.org/10.1007/s11548-019-01979-1
[17] Zhang, G., Yang, Z., Gong, L., Jiang, S., Wang, L., Zhang, H. (2020). Classification of lung nodules based on CT images using squeeze-and-excitation network and aggregated residual transformations. La Radiologia Medica, 125: 374-383. https://doi.org/10.1007/s11547-019-01130-9
[18] Shao, Y., Zhang, X., Wu, G., Gu, Q., Wang, J., Ying, Y., Xu, Z. (2020). Prediction of three-dimensional radiotherapy optimal dose distributions for lung cancer patients with asymmetric network. IEEE Journal of Biomedical and Health Informatics, 25(4): 1120-1127. https://doi.org/10.1109/JBHI.2020.3025712
[19] Huang, W., Zhang, Y., Dong, H., Wang, Y. (2021). DSENet: Double three-dimensional squeeze-and-excitation network for pulmonary nodule detection. In 2021 IEEE 5th Advanced Information Technology, Electronic and Automation Control Conference (IAEAC), 5: 1396-1402. https://doi.org/10.1109/IAEAC50856.2021.9390804
[20] Chen, Y., Du, W., Duan, X., Ma, Y., Zhang, H. (2021). Squeeze-and-excitation convolutional neural network for classification of malignant and benign lung nodules. Journal of Advances in Information Technology, 12(2): 153-158. https://doi.org/10.12720/jait.12.2.153-158
[21] Armato, S.G., McLennan, G., Bidaut, L., McNitt‐Gray, M.F., Meyer, C.R., Reeves, A.P., Clarke, L.P. (2011). The lung image database consortium (LIDC) and image database resource initiative (IDRI): A completed reference database of lung nodules on CT scans. Medical Physics, 38(2): 915-931. https://doi.org/10.1118/1.3528204
[22] de Carvalho Filho, A.O., Silva, A.C., de Paiva, A.C., Nunes, R.A., Gattass, M. (2017). Computer-aided diagnosis system for lung nodules based on computed tomography using shape analysis, a genetic algorithm, and SVM. Medical & Biological Engineering & Computing, 55(8): 1129-1146. https://doi.org/10.1007/s11517-016-1577-7
[23] Ferreira, J.R., Oliveira, M.C., de Azevedo-Marques, P.M. (2018). Characterization of pulmonary nodules based on features of margin sharpness and texture. Journal of Digital Imaging, 31(4): 451-463. https://doi.org/10.1007/s10278-017-0029-8
[24] Jalalimanesh, A., Haghighi, H.S., Ahmadi, A., Soltani, M. (2017). Simulation-based optimization of radiotherapy: Agent-based modeling and reinforcement learning. Mathematics and Computers in Simulation, 133: 235-248. https://doi.org/10.1016/j.matcom.2016.05.008
[25] Hu, J., Shen, L., Sun, G. (2018). Squeeze-and-excitation networks. 2018 IEEE/CVF Conference on Computer Vision and Pattern Recognition, pp. 7132-7141. https://doi.org/10.1109/cvpr.2018.00745
[26] Gong, J., Liu, J.Y., Sun, X.W., Zheng, B., Nie, S.D. (2018). Computer-aided diagnosis of lung cancer: the effect of training data sets on classification accuracy of lung nodules. Physics in Medicine & Biology, 63(3): 035036.
[27] Xie, Y., Zhang, J., Xia, Y., Fulham, M., Zhang, Y. (2018). Fusing texture, shape and deep model-learned information at decision level for automated classification of lung nodules on chest CT. Information Fusion, 42: 102-110. https://doi.org/10.1016/j.inffus.2017.10.005
[28] Kaya, A. (2018). Cascaded classifiers and stacking methods for classification of pulmonary nodule characteristics. Computer Methods and Programs in Biomedicine, 166: 77-89. https://doi.org/10.1016/j.cmpb.2018.10.009
[29] Neal Joshua, E.S., Bhattacharyya, D., Chakkravarthy, M., Byun, Y.C. (2021). 3D CNN with visual insights for early detection of lung cancer using gradient-weighted class activation. Journal of Healthcare Engineering, 2021: 1-11. https://doi.org/10.1155/2021/6695518
[30] Nibali, A., He, Z., Wollersheim, D. (2017). Pulmonary nodule classification with deep residual networks. International Journal of Computer Assisted Radiology and Surgery, 12(10): 1799-1808. https://doi.org/10.1007/s11548-017-1605-6
[31] Zhu, W., Liu, C., Fan, W., Xie, X. (2018). Deeplung: Deep 3d dual path nets for automated pulmonary nodule detection and classification. In 2018 IEEE Winter Conference on Applications of Computer Vision (WACV), pp. 673-681. https://doi.org/10.1109/WACV.2018.00079
[32] Mao, K., Tang, R., Wang, X., Zhang, W., Wu, H. (2018). Feature representation using deep autoencoder for lung nodule image classification. Complexity, 2018: 1-11. https://doi.org/10.1155/2018/3078374
[33] Shen, W., Zhou, M., Yang, F., Yu, D., Dong, D., Yang, C., Tian, J. (2017). Multi-crop convolutional neural networks for lung nodule malignancy suspiciousness classification. Pattern Recognition, 61: 663-673. https://doi.org/10.1007/978-3-319-19992-4_46
[34] Liu, Y., Hao, P., Zhang, P., Xu, X., Wu, J., Chen, W. (2018). Dense convolutional binary-tree networks for lung nodule classification. IEEE Access, 6: 49080-49088. https://doi.org/10.1109/ACCESS.2018.2865544