Mohan Goud Kathi* | Jakeer Hussain Shaik
© 2021 IIETA. This article is published by IIETA and is licensed under the CC BY 4.0 license (http://creativecommons.org/licenses/by/4.0/).
OPEN ACCESS
One of the key challenges that the computer vision is facing is the age prediction. A well efficient CNN is selected for age prediction by performing various CNN operations by taking the categories as age 40 and above age 40. The selected CNN method obtained a training accuracy of 100% at more than 100 epochs. Hence, 100 epochs is considered for training. At this, the validation accuracy achieved is 84.9%. Three kinds of age phases with an age gap of 20,10 and 5 are used to predict the age. The normal method results in very less accuracy. Hence a hierarchical method is formulated. Under the hierarchical method, CNN is trained to estimate the age gaps in decreasing order. Hence not a single classifier, a group of classifiers are used for testing the image. From traditional method to hierarchical method, the 20 age gap accuracy increased from 27% to above 60%, ten age gap increased from 12% to above 35%, and five age gap increased from 5.5% to above 21%. To improve further, the features of the face parts are derived and combined which improves the efficiency compared to normal method, but not good accuracy as Hierarchical method. The combination of hierarchical method along with the face feature extraction method results in a considerable improvement in accuracy.
age prediction, CNN, face parts extraction, Hierarchical method
Age of a person can be estimated in several ways by the usage the several advancements in different fields. Popularly used ways are categorised as physical activity, medical records and tests, and by processing the images.
The Walking style, handwriting are examples of physical activity, With the change in age, the pattern of walking changes. Hence walking factor can be used for age prediction [1]. Handwriting also aids in detecting the age, gender and nationality [2].
DNA methylation tests, MRI, and EMR, are sources of tests used for age prediction. It is difficult to predict the age because most of the people are not seems as their age. Chronological age is the age that a person alive while the biological age is the person seems. Biological age can be predicted with blood biomarkers [3]. Overall electronic medical records are sources of biological age. It is possible to estimate the chronological age from EMRs using deep neural networks [4]. By proper feature selection, matching younger age faces with the older one is possible [5].
With the increase in age, few features of face changes. By extracting those, one can estimate the age [6]. Ageing affects many tissues. Hence it can be estimated by considering the different tissues and DNA methylation [7]. The epigenetic clock is the test based on DNA methylation levels which are extensively used in forensic age prediction. MRI tests can aid in brain age prediction [8, 9]. MRI data of hand bones, clavicle bones, and wisdom teeth can help assist the age [10].
The processing of images doesn’t require any physical tests. it is possible to design the age estimator by training the human faces with age difference information [11]. There were different age databases [12] available for research in age. In this paper, all the age images are collected from Kaggle.
The age can be estimated by sorting the facial images as per age in time plane and extracting the features [13]. It is difficult to predict the exact age because ageing is a slow process, and there is not much feature difference between the adjacent ages. Hence while learning from a set of images related to age. It should not only learn that age but also contributes to learning the adjacent ages [14]. Extraction of attributes of the face with age progression helps in reliable age estimation [15]. Estimating with face attributes in camera images is a challenging task, the dynamic features extraction can make this task easier [16]. Instead of using holistic features, discriminative local features can aid in better age estimation [17].
Facial landmarks assist in improving the efficiency of age prediction [18]. Some of the effects like Lightning, pose etc., may reduce the chances of extracting the features. 2D to 3D modelling reduces the effect of Lightning and pose variations [19]. Computational intelligence attained an excellent accuracy of age estimation in recent years [20].
SVM is used extensively for age regression [21]. Instead of using SVM, Gaussian process can also be used for the age estimation [22]. Some methods like the Manifold learning method can also be used for age estimation [23].
It is difficult for a human, to detect the exact age by watching. However, it is easier to detect whether the person is kid or adult or old. Similarly, CNN's having only three such categories can efficiently predict [24]. One of the methods that CNN is used to train is by taking each age as a category. Nevertheless, by grouping adjacent ages as a category [25], there would be many different combinations that can improve efficiency. Agrawal and Dixit [26] uses the CNN for age estimation in which four categories as child, young, adult and old. After extracting features, PCA is applied in order to minimize the dimensionality of features. Using the proposed Divide by Rule [27] method can permit good results along with CNN. CNN can give the best results by training grayscale images instead of colour images [28]. CNN can be used to estimate gender, age and race [29]. The feature extraction and classification are the two phases of CNN for age estimation [30]. Directly using CNN on different categories of images may not give a sufficient output. It is found that diverse combinations of attributes which are in connection with age can aid in the most effective age predictor [31].
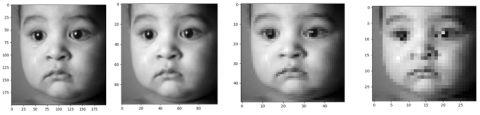
A common neural network is used for all the classifications. The neural network is selected by performing the operations on two categories of images- below 40 and above 40 age. Because of craniofacial growth, there would be considerable changes in the faces of kids and adults. Kids skull is small, and hence their face appeared to be small. The newborn baby cannot up his head with his neck. The tiny face of kids is just one-third of their skull, but adult’s face is half of their skull. The chins are smaller for kids. Hence their faces are visible to be round. During the child phase, the face changes are more with age, and it continues in decreasing order with age. When transformed into adults, moustache and beard will develop for males. While changing from adult age to older age, the skin becomes loose, and wrinkles in the face will be formed. The whites of eyes of older people may change to yellow due to the exposure of dust, wind and UV light for many years. By doing face image processing well, the machine can able to predict the age more accurately. The main aim of the Block1 is to extract the features. The minimum L value considered is 32, which means at least 32 filters are used for extracting the features in the face. The images are converted from BGR to greyscale before training. All the faces are different shaped photos some are landscape, portrait. All are converted to portrait and normalized to a common size. As the size increases, the clarity would be more but need to select the same size for all. It is found that 100x100 is enough to extract the features. Figure 1 presents an illustration of loss in clarity of images with size.
Hence all the images used for training are normalized to 100x100 pixels. The training data must be properly balanced. For each age up to 60, the training images used is 50 for training and above 60 age images are 1030. So for below 40 category, the total images are 40x50=2000. And for above 40, the total images are 20x50+1030=2030. 70% of images are used for training and 30% of images are used for validation. If one category of data trained first and another category next which makes not proper training. Hence the images were shuffled before training. It is difficult to work with images with the change in neural network Hence the training images are converted to pickles for easy access.
Figure 4 illustrates various neural networks that are obtained with different combinations of L, C and D values. Where L is used for convolution layer size, C for Number of convolution layers and D for Number of Dense layers. Block 1 and Block 2 of Figure 4 are illustrated in Figure 2 and Figure 3. The accuracies of various combinations of these parameters along with epochs are illustrated in Table 1. The training accuracy < 100% at the epochs 10. The possible reason would be underfitting or improper training. Since training accuracy>validation accuracy, it is not due to underfitting. The training can be improved with an increase in epochs, and it is found that by improving epochs to 100, the training accuracy reaches 100%.
For 10 Epochs of training, keeping L and C constant, the training accuracy increases with increase in D in most of the cases. In the case of L=64 and C=1, the training accuracy is reached up to 97%. But the improvement in training accuracy is achieved well by increasing epochs. The training accuracy reaches its maximum for the epochs from 50 to 100. But there is no much effect on validation accuracy with the increase in epochs.
Considering all of these, L=32, C=3 and D=3 is selected as a neural network for all the operations. Let the neural network be N. Epochs is increased to 200 for N, the validation accuracy achieved is 84.4 which is not a considerable improvement. Since validation accuracy < training accuracy, there is a chance of overfitting. Batch normalization can regularize this. Besides, it can increase the speed of training and can decrease the importance of initial weights. Dropout also can reduce overfitting. Hence Batch normalization and a dropout of 0.25 is added before the sigmoid activation layer of Figure 4. The accuracy now achieved is 80.5 and the same layers are added after each of Block 2, the accuracy obtained is 80.3. Addition of these layers for 200 epochs doesn’t affect much. Same is trained with 100 epoch which results in 82.2 for layers addition for each of Block 2. 81% of accuracy is achieved for the addition before sigmoid activation function. From the above results, the neural network N with 100 epochs is selected for all the pieces of training.
200x200 100x100 50x50 30x30
Figure 1. Effect of image quality at different sizes
Figure 2. Block 1
Figure 3. Block 2
Figure 4. Neural network
Table 1. Selection of neural network
|
Below and Above 40 |
||||||||
|
Layer size (L) |
Convolution Layers (C) |
Dense(D) |
Epoch 10 |
Epoch 50 |
Epoch 100 |
|||
|
Training accuracy |
Validation accuracy |
Training accuracy |
Validation accuracy |
Training accuracy |
Validation accuracy |
|||
|
32 |
1 |
0 |
89.9 |
82.27 |
100 |
80 |
100 |
82.27 |
|
1 |
92.4 |
82.6 |
100 |
81.9 |
100 |
81.5 |
||
|
2 |
94.7 |
72.8 |
100 |
81.6 |
100 |
82.6 |
||
|
3 |
95.6 |
81.6 |
100 |
82.27 |
100 |
81.1 |
||
|
2 |
0 |
89.6 |
83.9 |
100 |
81 |
100 |
82.7 |
|
|
1 |
92.2 |
82.2 |
100 |
83.1 |
100 |
83 |
||
|
2 |
92 |
83.5 |
100 |
81.9 |
100 |
82.5 |
||
|
3 |
92.9 |
81.9 |
100 |
82.1 |
100 |
82.4 |
||
|
3 |
0 |
87.3 |
80.9 |
100 |
84 |
100 |
82.9 |
|
|
1 |
87.4 |
81.7 |
100 |
84.1 |
100 |
82.9 |
||
|
2 |
87.2 |
82.9 |
100 |
84.4 |
100 |
82.4 |
||
|
3 |
87 |
83 |
100 |
84.9 |
100 |
84.1 |
||
|
4 |
0 |
86.1 |
82.1 |
100 |
81 |
100 |
84.5 |
|
|
1 |
86.6 |
81.04 |
100 |
82.2 |
100 |
81.7 |
||
|
2 |
84.5 |
81.5 |
100 |
82.6 |
100 |
82.7 |
||
|
3 |
85 |
82 |
99.97 |
83.3 |
100 |
83.1 |
||
|
64 |
1 |
0 |
91.2 |
81.6 |
100 |
82 |
100 |
83 |
|
1 |
97.4 |
81.4 |
100 |
82.6 |
100 |
81 |
||
|
2 |
97.5 |
87.5 |
100 |
84.1 |
100 |
82.3 |
||
|
3 |
97.2 |
86 |
100 |
81.4 |
100 |
80.5 |
||
|
2 |
0 |
87.7 |
77.05 |
100 |
81 |
100 |
82.1 |
|
|
1 |
90.5 |
82.4 |
100 |
81.9 |
100 |
82.1 |
||
|
2 |
92.7 |
82.5 |
100 |
82.9 |
100 |
83.4 |
||
|
3 |
93.1 |
82.7 |
100 |
82.9 |
100 |
82.4 |
||
|
3 |
0 |
87.1 |
81.7 |
100 |
83 |
100 |
84 |
|
|
1 |
89.8 |
84.2 |
100 |
83.4 |
100 |
84.1 |
||
|
2 |
88.3 |
81.5 |
100 |
84.6 |
100 |
83.5 |
||
|
3 |
90 |
82 |
100 |
83.2 |
100 |
83.1 |
||
|
4 |
0 |
88.8 |
83.1 |
100 |
83 |
100 |
82 |
|
|
1 |
87.2 |
82.3 |
100 |
83 |
100 |
82.1 |
||
|
2 |
86.1 |
81.3 |
100 |
82.5 |
100 |
83 |
||
|
3 |
90 |
83 |
100 |
84.9 |
100 |
84.7 |
||
|
128 |
1 |
0 |
92.1 |
80.9 |
100 |
82.4 |
100 |
82.1 |
|
1 |
95.5 |
80.9 |
100 |
82.1 |
100 |
81.2 |
||
|
2 |
97.5 |
81.2 |
100 |
80.9 |
100 |
81.1 |
||
|
3 |
97.7 |
78.2 |
100 |
80.2 |
100 |
80 |
||
|
2 |
0 |
89.04 |
81.4 |
100 |
83.1 |
100 |
82.9 |
|
|
1 |
91.2 |
81.9 |
100 |
82.9 |
100 |
81.6 |
||
|
2 |
89.9 |
80.3 |
100 |
82.9 |
100 |
81.9 |
||
|
3 |
91.5 |
81.2 |
100 |
80.7 |
100 |
80.4 |
||
|
3 |
0 |
89.04 |
82.96 |
100 |
83.6 |
100 |
83.9 |
|
|
1 |
91.2 |
81.9 |
100 |
84 |
100 |
84 |
||
|
2 |
89.9 |
82.5 |
100 |
83.9 |
100 |
83.9 |
||
|
3 |
89.9 |
79.4 |
100 |
82.9 |
100 |
83.5 |
||
|
4 |
0 |
91.4 |
81.6 |
100 |
83.4 |
100 |
83 |
|
|
1 |
89.5 |
82.5 |
100 |
83.1 |
100 |
82 |
||
|
2 |
88.5 |
79.9 |
100 |
83.4 |
100 |
83.6 |
||
|
3 |
87.3 |
84.1 |
100 |
82.3 |
100 |
82.9 |
||
It is arduous for training a model such that it can predict the exact age. Also, it requires a huge number of images for each age. Hence, Age prediction is taken as a classification problem instead of a regression problem. The classifier trying to develop, can classify the age gap of 5 years up to 60 and above 60 categories. Overall total categories are 13. For each age, the training images are 50. Since 5 years is taken as one category, the total images per category are 250. Above 60 age, the images taken are 1030. 70% of the images are used for training and 30% are used for validation.
The accuracy achieved for All5All is only 5.5% which is very less. All10All reaches 12% and All20All gives 27%. The notation AllnAll represents the trained model having the categories – n,2n,3n----60 and above 60. Where n is a multiple of 60.
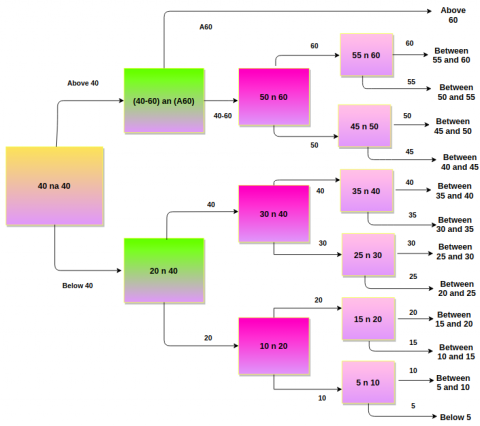
To improve accuracy, a hierarchical method is designed. The hierarchy method consists of various trained models which is illustrated in Figure 5. First, the hierarchy method predicts whether the age is below 40 or above 40 with the aid of 40 na 40 trained model. If below 40 then it is checked with the models trained with 20 age gap. In this case 20n40 followed by 10 and at the end 5 age gap. Hence the highest priority is 40 followed by 20,10, and 5 age gaps. The accuracies achieved for the various age gaps are as follows-
40: 40na40 – 81%
20: 20n40 – 82.6% and (40-60)an(A60) – 75.5%
10: 10n20 - 81.37%, 30n40 – 68.2% and 50n60 – 57.19%
05: 5n10 – 73.2%, 15n20 – 71.24%, 25n30 – 60.13%, 35n40 – 50.66%, 45n50 – 62.89%, 55n60 – 61.63%.
Figure 5. Block diagram of the Hierarchical method
Table 2. Hierarchical method
|
|
Hierarchical method’s Accuracy in percentage |
||
|
Age |
Range 20 |
Range 10 |
Range 5 |
|
1-5 |
(40na40)(20n40)=66.9 |
[Range20](10n20) = 54.19 |
[Range10](5n10) = 39.27 |
|
6-10 |
[Range10](5n10) = 39.27 |
||
|
11-15 |
[Range20](10n20) = 54.19 |
[Range10](15n20) =38.6 |
|
|
16-20 |
[Range10](15n20) = 38.6 |
||
|
21-25 |
(40na40)(20n40)=66.9 |
[Range20](30n40) = 45.6 |
[Range10](25n30) = 27.36 |
|
26-30 |
[Range10](25n30) = 27.36 |
||
|
31-35 |
[Range20](30n40) = 45.6 |
[Range10](35n40) = 23.1 |
|
|
36-40 |
[Range10](35n40) = 23.1 |
||
|
41-45 |
(40na40)[(40-60)n(A60)] = 61.15 |
[Range20](50n60) = 34.97 |
[Range10](45n50) = 21.99 |
|
46-50 |
[Range10](45n50) = 21.99 |
||
|
51-55 |
[Range20](50n60) = 34.97 |
[Range10](55n60) = 21.55 |
|
|
56-60 |
[Range10](55n60) = 21.55 |
||
|
Above 60 |
(40na40)[(40-60)n(A60)] = 61.15 |
[Range20]=61.15 |
[Range20]=61.15 |
The notation xnax represents the trained model having two categories – belowx, above x. xny represents the trained model having two categories – (above [2x-y] and below x), (above x and below y). The notation (x-y)an(Ay) represents the trained model having two categories – abovex and belowy, above y.
Table 2 illustrates the accuracies achieved at different age ranges. It is not easy to find the age within the age-gap of 5. Hence the accuracy of 5 age gap is less compared to 20 age gap. Nevertheless, for the above 60age category, the ages are from 60 to 100. Hence it becomes easier for the model to find the person having the age above 60 and so the accuracy for above 60 is vast compared to 5 age gap.
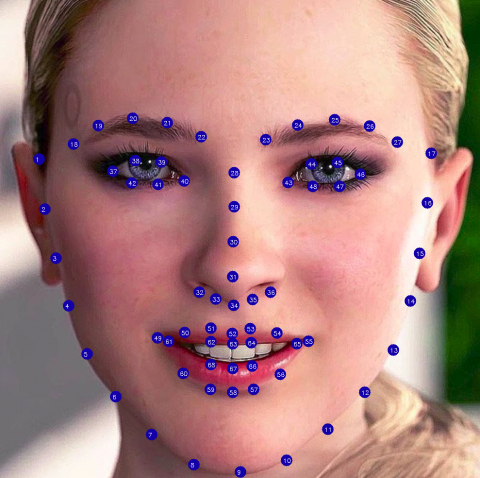
By extracting the features of different parts of the face, the age of a person can be predicted. The face parts that are extracted are the forehead, chin, left cheek, right cheek, eyes, left eye, right eye, nose, mouth and are trained to understand their influence on age. The face parts are extracted from the image by using the 68 landmarks which are illustrated in Figure 6.
The landmarks that represent the parts are – chin – {6,7,8,9,10,11,12,57,58,59} = c
left cheek – {2,3,4,5,49,32,40,41,42} = lc
Right cheek – {13,14,15,16,47,48,55} = rc
nose – For extracting nose 40 and 43 which are the edges of right and left eyes are also needed. {28,29,30,31,32,33,34,35,36,40,43} = n.
left eye – {37,38,39,40,41,42}=le
Right eye – {43,44,45,46,47,48}=re
eyes – {37,38,39,40,41,42,43,44,45,46,47,48}=e
mouth– {49,50,51,52,53,54,55,56,57,58,59,60,61,62,63,64,65,66,67,68}=m
Forehead – {for forhead the upper limits are extracted by the coordinates of the upper limits of face detector and for the lower limts -g ={19,20,21,24,25,26} } = f.
The cutter which is used to separate the face part, is provided with left(L),upper(U),right(R) and bottom(B) values. The left and right are the x-coordinate and upper and bottom are the y-coordinates of the image.
The respective coordinates for face parts are – Right eye – L=Min[X(re)], R=Max[X(re)], U=Min[Y(re)], B=Max[Y(re)], where X(n) and Y(n) are the xth and yth coordinates of point n.
Left eye – L=Min[X(le)], R=Max[X(le)], U=Min[Y(le)], B=Max[Y(le)].
Eyes - L=Min[X(le)], R=Max[X(re)], U=Min[U(le),U(re)], B=Max[B(le),B(re)].
Chin - L=Min[X(c)], R=Max[X(c)], U=Min[Y(c)], B=Max[Y(c)].
Forehead – L = L[facedetector],R=Max[X(g)],U=U[facedetector],B=Max[Y(g)]
Nose - L=Min[X(n)], R=Max[X(n)], U=Min[Y(n)], B=Max[Y(n)].
Left cheek - L=Min[X(lc)], R=Max[X(lc)], U=Min[Y(lc)], B=Max[Y(lc)].
Right cheek - L=Min[X(rc)], R=Max[X(rc)], U=Min[Y(rc)], B=Max[Y(rc)].
Mouth - L=Min[X(m)], R=Max[X(m)], U=Min[Y(m)], B=Max[Y(m)].
Figure 6. Representation of landmarks on face
Table 3. Accuracies of normal training
|
|
Accuracy |
||
|
All20All |
All10All |
All5All |
|
|
Eyes |
22.5 |
12.3 |
5.97 |
|
Nose |
22.4 |
12.9 |
6.3 |
|
Chin |
22.7 |
15.5 |
5.93 |
|
Left eye |
25.2 |
12.6 |
6.1 |
|
Right eye |
22.6 |
12.6 |
6.3 |
|
Mouth |
29.8 |
15.9 |
6.1 |
|
Right cheek |
23.75 |
12.09 |
5.6 |
|
Left cheek |
22.09 |
12.6 |
5.2 |
|
Forehead |
23.7 |
11.4 |
5.9 |
|
FA |
39 |
23 |
9 |
The extracted face parts are trained with the Neural network N. The face part wise accuracy for the age gaps 20,10 and 5 considering all the ages and along with the combination of all face parts are presented in Table 3. The final accuracy FA is better than the normal accuracy achieved in section III but less than the accuracy achieved in section IV.
FA represents combination of all face part models.
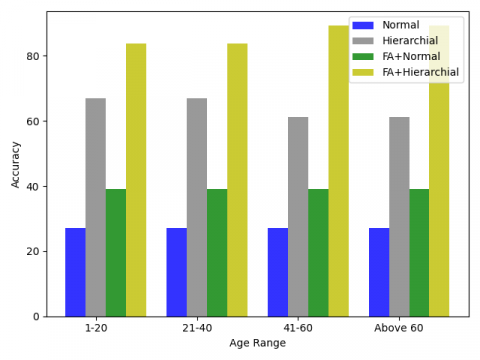
Similar to section IV, 40, 20, 10 and 5 age gap models are derived and illustrated in Table 4, 5, 6 and 7 respectively. The final Hierarchical model’s accuracies obtained are presented in Table 8. It is found that faceparts extraction method along with Hierarchical method produces better accuracies compared to all other methods. The age range wise comparison is illustrated in Graph 1, Graph 2 and Graph 3.
Table 4. Accuracies of 40 age gap
|
All 40 |
Eyes |
Nose |
Chin |
Left eye |
Right eye |
Mouth |
Right cheek |
Left cheek |
Forehead |
FA |
|
40na40 |
72 |
74.6 |
71.11 |
71.15 |
70 |
69 |
77.3 |
76 |
80 |
93 |
Table 5. Accuracies of 20 age gap
|
All 20 |
Eyes |
Nose |
Chin |
Left eye |
Right eye |
Mouth |
Right cheek |
Left cheek |
Forehead |
FA |
|
20n40 |
79.9 |
70 |
66.6 |
70 |
75.2 |
67.5 |
75.1 |
71.7 |
82 |
90 |
|
(40-60)an61 |
64.6 |
63.04 |
60 |
62.3 |
59.7 |
69.56 |
69.9 |
65.4 |
63.7 |
96 |
Graph 1. Comparison of methods for age 20 group
Graph 2. Comparison of methods for age 10 group
Graph 3. Comparison of methods for age 5 group
Table 6. Accuracies of 10 age gap
|
All10 |
Accuracy |
||
|
|
10n20 |
30n40 |
50n60 |
|
Eyes |
66.44 |
55.3 |
46.21 |
|
Nose |
55.6 |
54 |
57.24 |
|
Chin |
57.6 |
71 |
72 |
|
Left eye |
55.4 |
53.5 |
55.6 |
|
Right eye |
67.91 |
55.9 |
60.19 |
|
Mouth |
62.03 |
61.1 |
52.41 |
|
Right cheek |
69.15 |
61.07 |
46.9 |
|
Left cheek |
63.39 |
59.1 |
53.45 |
|
Forehead |
60.06 |
50.3 |
54.51 |
|
FA |
83 |
87 |
81 |
Table 7. Accuracies of 5 age gap
|
All5 |
Accuracy |
|||||
|
|
5n10 |
15n20 |
25n30 |
35n40 |
45n50 |
55n60 |
|
Eyes |
73.4 |
61.4 |
58 |
48.6 |
45.07 |
56 |
|
Nose |
65.3 |
57.4 |
60 |
49.6 |
47.8 |
52.3 |
|
Chin |
61.2 |
50.5 |
52.6 |
52.3 |
49.3 |
51.6 |
|
Left eye |
64.6 |
56.3 |
49.3 |
57 |
49.2 |
60 |
|
Right eye |
68.7 |
55.7 |
54 |
51.1 |
52.4 |
63 |
|
Mouth |
62.5 |
56.7 |
56.6 |
56.3 |
54.9 |
52.3 |
|
Right cheek |
61.9 |
54.7 |
62 |
53.6 |
53.2 |
53.69 |
|
Left cheek |
58.5 |
56.3 |
52.6 |
47.6 |
52.1 |
53.6 |
|
Forehead |
81.9 |
53.7 |
44.5 |
49.3 |
49.2 |
57 |
|
FA |
77 |
81 |
74 |
72 |
65 |
69 |
Table 8. Accuracies of Hierarchical model
|
|
Accuracy in percentage |
||
|
Age |
Range 20 |
Range 10 |
Range 5 |
|
1-5 |
(40na40)(20n40)=83.7 |
[Range20](10n20) = 69.47 |
[Range10](5n10) = 53.13 |
|
6-10 |
[Range10](5n10) = 53.13 |
||
|
11-15 |
[Range20](10n20) = 69.47 |
[Range10](15n20) =55.89 |
|
|
16-20 |
[Range10](15n20) = 55.89 |
||
|
21-25 |
(40na40)(20n40)=83.7 |
[Range20](30n40) = 72.81 |
[Range10](25n30) = 53.29 |
|
26-30 |
[Range10](25n30) = 53.29 |
||
|
31-35 |
[Range20](30n40) = 72.81 |
[Range10](35n40) = 51.84 |
|
|
36-40 |
[Range10](35n40) = 51.84 |
||
|
41-45 |
(40na40)[(40-60)an(60)] = 89.2 |
[Range20](50n60) = 72.09 |
[Range10](45n50) = 46.81 |
|
46-50 |
[Range10](45n50) = 46.81 |
||
|
51-55 |
[Range20](50n60) = 72.09 |
[Range10](55n60) = 49.68 |
|
|
56-60 |
[Range10](55n60) = 49.68 |
||
|
Above 60 |
(40na40)[(40-60)an(A60)] = 89.2 |
[Range20]=89.2 |
[Range20]=89.2 |
The selection of neural network is crucial in reliable results. Few parameters were taken into consideration to get an efficient neural network. The efficiency of a neural network reduces with increase in the categories. Hence, a hierarchical method containing few models is designed. Each model has only two categories which makes an increase in age prediction considerably. Many observable changes with age can make predict near age. Hence, face characteristics are considered for improving the efficiency of predicting. But taking only a certain face part not give much results. Hence nine face parts are considered and combined which gives better results. The application of hierarchical method with this leads to a good improvement in accuracy.
[1] Jin, B., Thu, T.H., Baek, E., Sakong, S.H., Xiao, J., Mondal, T., Deen, M.J. (2014). Walking-age analyzer for healthcare applications. IEEE Journal of Biomedical and Health Informatics, 18(3): 1034-1042. https://doi.org/10.1109/JBHI.2013.2296873
[2] Al Maadeed, S., Hassaine, A. (2014). Automatic prediction of age, gender, and nationality in offline handwriting. EURASIP Journal on Image and Video Processing, 2014(1): 1-10. https://doi.org/10.10.1186/1687-5281-2014-10
[3] Rahman, S.A., Adjeroh, D.A. (2019). Centroid of age neighborhoods: A new approach to estimate biological age. IEEE Journal of Biomedical and Health Informatics, 24(4): 1226-1234. https://doi.org/10.1109/JBHI.2019.2930938
[4] Wang, Z., Li, L., Glicksberg, B.S., Israel, A., Dudley, J.T., Ma'ayan, A. (2017). Predicting age by mining electronic medical records with deep learning characterizes differences between chronological and physiological age. Journal of Biomedical Informatics, 76: 59-68. https://doi.org/10.1016/j.jbi.2017.11.003
[5] Suo, J., Zhu, S.C., Shan, S., Chen, X. (2009). A compositional and dynamic model for face aging. IEEE Transactions on Pattern Analysis and Machine Intelligence, 32(3): 385-401. https://doi.org/10.1109/TPAMI.2009.39
[6] Fu, Y., Huang, T.S. (2008). Human age estimation with regression on discriminative aging manifold. IEEE Transactions on Multimedia, 10(4): 578-584. https://doi.org/10.1109/TMM.2008.921847
[7] Li, X., Li, W., Xu, Y. (2018). Human age prediction based on DNA methylation using a gradient boosting regressor. Genes, 9(9): 424. https://doi.org/10.3390/genes9090424
[8] Sajedi, H., Pardakhti, N. (2019). Age prediction based on brain MRI image: A survey. Journal of Medical Systems, 43(8): 279. https://doi.org/10.1007/s10916-019-1401-7
[9] Jónsson, B.A., Bjornsdottir, G., Thorgeirsson, T.E., Ellingsen, L.M., Walters, G.B., Gudbjartsson, D.F., Ulfarsson, M.O. (2019). Brain age prediction using deep learning uncovers associated sequence variants. Nature Communications, 10(1): 1-10. https://doi.org/10.1038/s41467-019-13163-9
[10] Štern, D., Payer, C., Giuliani, N., Urschler, M. (2018). Automatic age estimation and majority age classification from multi-factorial MRI data. IEEE Journal of Biomedical and Health Informatics, 23(4): 1392-1403. https://doi.org/10.1109/JBHI.2018.2869606
[11] Hu, Z., Wen, Y., Wang, J., Wang, M., Hong, R., Yan, S. (2016). Facial age estimation with age difference. IEEE Transactions on Image Processing, 26(7): 3087-3097. https://doi.org/10.1109/TIP.2016.2633868
[12] Fu, Y., Guo, G., Huang, T. S. (2010). Age synthesis and estimation via faces: A survey. IEEE Transactions on Pattern Analysis and Machine Intelligence, 32(11): 1955-1976. https://doi.org/10.1109/TPAMI.2010.36
[13] Geng, X., Zhou, Z.H., Smith-Miles, K. (2007). Automatic age estimation based on facial aging patterns. IEEE Transactions on Pattern Analysis and Machine Intelligence, 29(12): 2234-2240. https://doi.org/10.1109/TPAMI.2007.70733
[14] Geng, X., Yin, C., Zhou, Z.H. (2013). Facial age estimation by learning from label distributions. IEEE Transactions on Pattern Analysis and Machine Intelligence, 35(10): 2401-2412. https://doi.org/10.1109/TPAMI.2013.51
[15] Wang, S., Tao, D., Yang, J. (2015). Relative attribute SVM+ learning for age estimation. IEEE Transactions on Cybernetics, 46(3): 827-839. https://doi.org/10.1109/TCYB.2015.2416321
[16] Dibeklioğlu, H., Alnajar, F., Salah, A.A., Gevers, T. (2015). Combining facial dynamics with appearance for age estimation. IEEE Transactions on Image Processing, 24(6): 1928-1943. https://doi.org/10.1109/TIP.2015.2412377
[17] Lu, J., Liong, V.E., Zhou, J. (2015). Cost-sensitive local binary feature learning for facial age estimation. IEEE Transactions on Image Processing, 24(12): 5356-5368. https://doi.org/10.1109/TIP.2015.2481327
[18] Wu, T., Turaga, P., Chellappa, R. (2012). Age estimation and face verification across aging using landmarks. IEEE Transactions on Information Forensics and Security, 7(6): 1780-1788. https://doi.org/10.1109/TIFS.2012. 2213812
[19] Park, U., Tong, Y., Jain, A.K. (2010). Age-invariant face recognition. IEEE Transactions on Pattern Analysis and Machine Intelligence, 32(5): 947-954. https://doi.org/10.1109/TPAMI.2010.14
[20] Wang, J.G., Sung, E., Yau, W.Y. (2011). Active learning for solving the incomplete data problem in facial age classification by the furthest nearest-neighbor criterion. IEEE Transactions on Image Processing, 20(7): 2049-2062. https://doi.org/10.1109/TIP.2011.2106794
[21] Intille, S.S. (2004). A new research challenge: persuasive technology to motivate healthy aging. IEEE Transactions on Information Technology in Biomedicine, 8(3): 235-237. https://doi.org/10.1109/TITB.2004.835531
[22] Sawant, M.M., Bhurchandi, K. (2019). Hierarchical facial age estimation using Gaussian process regression. IEEE Access, 7: 9142-9152. https://doi.org/10.1109/ACCESS.2018.2889873
[23] Guo, G., Fu, Y., Dyer, C.R., Huang, T.S. (2008). Image-based human age estimation by manifold learning and locally adjusted robust regression. IEEE Transactions on Image Processing, 17(7): 1178-1188. https://doi.org/10.1109/TIP.2008.924280
[24] Dileep, M.R., Danti, A. (2018). Human age and gender prediction based on neural networks and three sigma control limits. Applied Artificial Intelligence, 32(3): 281-292. https://doi.org/10.1080/0883951 4.2018.1451217
[25] Tan, Z., Wan, J., Lei, Z., Zhi, R., Guo, G., Li, S.Z. (2017). Efficient group-n encoding and decoding for facial age estimation. IEEE Transactions on Pattern Analysis and Machine Intelligence, 40(11): 2610-2623. https://doi.org/10.1109/TPAMI.2017.2779808
[26] Agrawal, B., Dixit, M. (2019). Age estimation and gender prediction using convolutional neural network. In International Conference on Sustainable and Innovative Solutions for Current Challenges in Engineering & Technology, Springer, Cham, pp. 163-175. https://doi.org/10.1007/978-3-030-44758-8_15
[27] Liao, H., Yan, Y., Dai, W., Fan, P. (2018). Age estimation of face images based on CNN and divide-and-rule strategy. Mathematical Problems in Engineering, 2018. https://doi.org/10.1155/2018/1712686
[28] Jhang, K., Cho, J. (2019). CNN training for face photo based gender and age group prediction with camera. In 2019 International Conference on Artificial Intelligence in Information and Communication (ICAIIC), pp. 548-551. https://doi.org/10.1109/ICAIIC.2019.8669039
[29] Wan, J., Tan, Z., Lei, Z., Guo, G., Li, S.Z. (2018). Auxiliary demographic information assisted age estimation with cascaded structure. IEEE Transactions on Cybernetics, 48(9): 2531-2541. https://doi.org/10.1109/TCYB.2017. 2741998
[30] Agbo-Ajala, O., Viriri, S. (2020). Deeply learned classifiers for age and gender predictions of unfiltered faces. The Scientific World Journal, 2020. https://doi.org/10.1155/2020/128940
[31] Xie, J.C., Pun, C.M. (2019). Chronological age estimation under the guidance of age-related facial attributes. IEEE Transactions on Information Forensics and Security, 14(9): 2500-2511. https://doi.org/10.1109/TIFS.2019.2902823