Sumanth Kumar Panguluri* | Laavanya Mohan
© 2021 IIETA. This article is published by IIETA and is licensed under the CC BY 4.0 license (http://creativecommons.org/licenses/by/4.0/).
OPEN ACCESS
Nowadays multimodal image fusion has been majorly utilized as an important processing tool in various image related applications. For capturing useful information different sensors have been developed. Mainly such sensors are infrared (IR) image sensor and visible (VI) image sensor. Fusing both these sensors provides better and accurate scene information. The major application areas where this fused image has been mostly used are military, surveillance, and remote sensing. For better identification of targets and to understand overall scene information, the fused image has to provide better contrast and more edge information. This paper introduces a novel multimodal image fusion method mainly for improving contrast and as well as edge information. Primary step of this algorithm is to resize source images. The 3×3 sharpen filter and morphology hat transform are applied separately on resized IR image and VI image. DWT transform has been used to produce "low-frequency" and "high-frequency" sub-bands. "Filters based mean-weighted fusion rule" and "Filters based max-weighted fusion rule" are newly introduced in this algorithm for combining "low-frequency" sub-bands and "high-frequency" sub-bands respectively. Fused image reconstruction is done with IDWT. Proposed method has outperformed and shown improved results in subjective manner and objectively than similar existing techniques.
infrared image, visible image, DWT, IDWT, Filters based mean-weighted fusion rule, Filters based max-weighted fusion rule
Recently fusion of multimodal images has been used in many applications. Mainly multimodal image fusion means fusing images that are captured using different sensors. Out of many multimodal images, we are now discussing about IR image and VI image. IR image is captured by using an infrared camera. IR image sensor fundamental principle is to capture thermal radiation. VI image is captured by using a visible camera. VI image sensor fundamental principle is to capture light reflection. Objects that are captured during poor weather conditions [fog, low light, snow and dust] can be clearly detected in IR image. Whereas it can’t be possible in VI image due to reflection nature. The background information such as textures can be clearly seen in VI image. Since it exhibits high spatial resolution. But it can’t be possible in IR image. Because IR image exhibits low spatial resolution. By considering the advantages of both IR image and VI image. Fusing these images can generate a single informative image which contains more information than individual images. Nowadays the fused image generated by fusing IR and VI images [1, 2] has been widely used in the military [3, 4], surveillance [5, 6], and remote sensing [7, 8] applications in order to improve visual appearance and situation awareness.
Generally, image fusion schemes are categorized into two types based on domain. They are
Some of the spatial domain fusion schemes that comes under this category are weighted average fusion scheme [9] and PCA [10] fusion scheme. The major advantage of spatial domain fusion schemes is that they require less computational time. Whereas drawbacks are that they produce blurred results. Later transform domain schemes have been developed. The advantage of transform domain fusion schemes is that they produce high quality fused images. Some of the transforms used in these schemes are Laplacian pyramid transform [11, 12], DWT [13, 14], DTCWT [15, 16], and Contour-let transform [17, 18]. A DWT based novel multimodal fusion method is presented in this paper. The main purpose of DWT multi-scale transform is that it avoids blurring of fusion result. It also removes spectral degradations as well as spatial distortions present in fusion result.
Shah et al. [19] have introduced a fusion mechanism using two multi-scale transforms for fusing IR and VI images in 2010. The multi-scale transforms used are DWT and curve-let transform. "Mean-max rule" has been utilized for integrating "low frequency" and "high-frequency" sub-bands. For producing high quality fused image, this algorithm has used two multi-scale transforms. Because of this complexity of algorithm has been increased and also execution time also increased.
In order to overcome above complexity problem, Han et al. [20] has introduced a basic discrete wavelet transform fusion approach for fusing IR and VI images in 2015. This approach is developed mainly using two fusion rules. The rules involved are weighted average based feature extraction and absolute value selection. Since this algorithm is developed using very simple rules. It is unable to allow more features of source image into fusion result.
By considering above problem, Zhan and Zhuang [21] have proposed a multi-stages discrete wavelet transform based fusion method for fusing IR and VI images in 2016. This method involves three stages of DWT and multiple fusion rules. It produced high quality and good sharpness image. The drawback of this method is that it takes more time for execution.
Later Zhan et al. [22] have proposed a new DWT based fusion scheme for fusing IR and VI images in 2017. Mainly in this fusion scheme, two new fusion strategies based on segmentation have been introduced. "Regional energy-based rule" has been utilized for integrating "approximation coefficients". "Weighted sum and difference of neighboring coefficients based fused strategy" has been utilized to integrate "detailed coefficients". Compared to previous algorithms much improved fusion rules have been used in this algorithm for improving the quality of fused image. The drawback of this algorithm is that no enhancement techniques were used for enhancing source images.
Habeeb et al. [23] have proposed a basic DWT based fusion approach for fusing IR and VI images in 2018. The highlight of the work is that a new sharpen filter has been proposed for enhancing the details of the IR image. A simple "weighted average fusion strategy" has used for integrating approximation as well as detailed sub-bands. Compared to standard methods proposed fusion approach produced better results. But the major limitation of the work is that the visible image details are not much reflected in the final fused image.
Panguluri and Mohan [24] have proposed a novel DWT based fusion method for fusing IR and VI images in 2020. The novelty of this method is that applying the unsharp masking technique in the frequency domain for integrating low-frequency sub-bands in order to improve contrast. In this method "Average fusion rule" has been utilized for integrating "low-frequency" sub-bands. "Max fusion rule" has been utilized for integrating "high-frequency" sub-bands. This method has achieved good performance than existing methods with respect to mean, standard deviation, and entropy. But the drawback of this method is, details of source images have not reflected much in the resultant fused image.
To reduce the above-mentioned problems and to improve fusion performance, a DWT based novel multimodal image fusion method is proposed in this paper. The highlights of proposed approach are listed below.
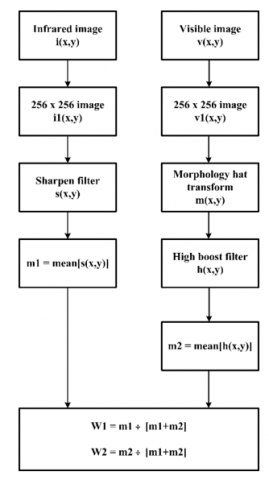
The block diagram of a DWT based novel multimodal image fused method is shown in Figure 1. Here source images have resized into 256 x 256 images. The 3 x 3 sharpen filter and morphology hat transform are applied separately on resized IR image and VI image. DWT on decomposition produces approximation and as well as detailed sub-bands. Here in this paper, two new fusion rules are presented. "Filters based mean-weighted fusion rule" is introduced for integrating "approximation" sub-bands. Whereas, "Filters based max-weighted fusion rule" is introduced for integrating "detailed" sub-bands. Final image reconstruction is done using IDWT.
Figure 1. Block diagram of the proposed algorithm
3.1 Sharpen filter
Image sharpening is an image enhancement method. It is mainly used for improving the edges of images. IR image mainly exhibits very poor spatial resolution. So textures are not clear in I-R image.
The formula for image sharpening is given by
$s(x, y)=f(x, y)-\nabla^{2} f(x, y)$ (1)
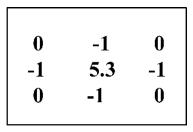
Here "s(x,y)" represents "Sharpened image", "f(x,y)" represents "Input image", and " $\nabla$2f(x,y)" represents "Laplacian of input image". As shown in Figure 1, sharpen filter is applied on resized IR image. Here it is mainly used for enhancing the textures of the IR image. The sharpening filter used in this method is shown in Figure 2.
Figure 2. 3 x 3 image sharpening filter
3.2 Morphology hat transform
"Morphology hat transform" is one of the significant technique used for enhancing the contrast of input images. It comprises of "top hat transform" and as well as "bottom hat transform". "Top hat transform" has been used to improve brightness information. Moreover "bottom hat transform" has been used to improve darkness information. The formula for "morphology hat transform" is given by
$M T(x, y)=f(x, y)+T H T(x, y)+B H T(x, y)$ (2)
where, "MT(x,y)" represents "Morphology-hat transform image", "f(x,y)" represents "Input image", "THT(x,y)" represents "Top hat transform image", and "BHT(x,y)" represents "Bottom hat transform image".
The formula for "Top hat transform" is given by
$T H T(x, y)=f(x, y)-f_{\text {opening }}(x, y)$ (3)
$f_{\text {opening }}(x, y)=f \circ s$ (4)
where, "THT(x,y)" represents "Top hat transform image", "f(x,y)" represents "Input image", and "fopening(x,y)" represents morphological-opening of "f(x,y)" with structuring element "s".
The formula for “Bottom hat transform" is given by
$B H T(x, y)=f_{\text {closin } g}(x, y)-f(x, y)$ (5)
$f_{\text {closing }}(x, y)=f \bullet s$ (6)
where, "BHT(x,y)" represents "bottom hat transform image", "f(x,y)" represents "Input image", and "fclosing(x,y)" represents closing of "f(x,y)" with structuring element "s".
VI images in this algorithm are captured during poor and low light weather conditions. So, contrast of VI images is very low. As shown in Figure 1, "Morphology hat transform" is applied on the resized VI image. Here it is mainly used for improving the contrast of the VI image.
3.3 DWT decomposition
The fusion method presented in this paper is developed with using single level decomposition of DWT multi-scale transform. The DWT decomposition process is shown in Figure 3. Here DWT is applied separately on source image-1 and source image-2. On DWT decomposition, four sub-band images are produced. They are "LL, LH, HL, and HH" sub-band images. "LL" sub-band provides approximation information. "LH, HL, and HH" sub-bands provide edge information. "LL" sub-bands of the source image-1 and the source image-2 are combined using "fusion rule for low-frequency sub-bands". Similarly, "LH, HL, and HH" sub-bands of the source image-1 and the source image-2 are combined using "fusion rule for high-frequency sub-bands". Finally, IDWT produces the final fused image.
As shown in Figure 1, DWT multi-scale transform is applied on both the sharpen image of IR image and morphology hat transform of VI image.
Figure 3. DWT decomposition
3.4 Fusion strategy for low-frequency sub-bands
"Filters based mean-weighted fusion rule" has been newly introduced in this paper for fusing "low-frequency" sub-bands produced on DWT decomposition as shown in Figure 1. Let "FLF1(U,V)" indicates "low-frequency" sub-band produced on DWT decomposition of sharpen image of IR image. "FLF2(U,V)" indicates "low-frequency" sub-band produced on DWT decomposition of "morphological hat transform" of VI image.
The formula for "Filters based mean-weighted fusion rule" is given by
$F_{M E A N}(U, V)=W 1 * F_{L F 1}(U, V)+W 2 * F_{L F 2}(U, V)$ (7)
where, W1, W2 indicates weights.
The main motive of "Filters based mean-weighted fusion rule" is to improve brightness and increase sharpness information in the final fused image.
Figure 4. Weights generation model for filters based mean-weighted fusion rule
The design of the weights generation model for "filters based mean weighted fusion rule" is shown in Figure 4. Here "i(x,y)" indicates IR image and "v(x,y)" indicates VI image. Both IR and VI images are resized into 256 x 256 images. They are indicated as "i1(x,y)" and "v1(x,y)". Sharpening filter is applied on the "i1(x,y)". It is mainly used for enhancing edge information of IR image. The sharpening filter output is indicated as "s(x,y)". The sharpening filter used in this design is shown in Figure 2. Morphology hat transform is applied on the "v1(x,y)". It improves the contrast of VI image. The morphology hat transform output is indicated as "m(x,y)". High boost filter is applied on the "m(x,y)". It is used for increasing the sharpness. So, that edges will be well preserved in the resultant image.
Figure 5. 3 x 3 high boost filter
The high boost filter output is indicated as "h(x,y)". The high boost filter used in this design is shown in Figure 5. Then, after we find the mean of "s(x,y)" and it is indicated as "m1". It is given by
$m 1=\operatorname{mean}(s(x, y))$ (8)
Similarly, we find the mean of "h(x,y)" and it is indicated as "m2". It is given by
$m 2=\operatorname{mean}(h(x, y))$ (9)
Mainly mean gives average brightness information of image. The mean values m1 and m2 constructed using this method are the improved mean values than the original mean values.
Finally, "W1" and "W2" are generated by
$W 1=m 1 \div(m 1+m 2)$ (10)
$W 2=m 2 \div(m 1+m 2)$ (11)
Weights W1 obtained with using m1 and m2 contains much improved IR average brightness information. Similarly W2 contains much improved VI average brightness information.
3.5 Fusion strategy for high-frequency sub-bands
"Filters based max-weighted fusion rule" has been newly introduced in this paper for fusing "high-frequency sub-bands" produced on DWT decomposition as shown in Figure 1. Let "FHF1(U,V)" indicates "high-frequency" sub-bands produced on DWT decomposition of sharpen image of IR image. "FHF2(U,V)" indicates "high-frequency" sub-bands produced on DWT decomposition of morphological hat transform of VI image.
The formula for "Filters based max-weighted fusion rule" is given by
$F_{M A X}(U, V)=W 3 * F_{H F 1}(U, V)+W 4 * F_{H F 2}(U, V)$ (12)
where, W3, W4 indicates weights.
The main motive of "Filters based max-weighted fusion rule" is to improve edge information. So, that it reflects in the final fused image.
Figure 6. Weights generation model for filters based max-weighted fusion rule
The design of weights generation model for "filters based max-weighted fusion rule" is shown in Figure 6. Here "i(x,y)" indicates IR image, and "v(x,y)" indicates VI image. Both IR and VI images are resized into 256 x 256 images. They are indicated as "i1(x,y)" and "v1(x,y)". Sharpening filter is applied on the "i1(x,y)". It is mainly used for enhancing edge information of IR image. The sharpening filter output is indicated as "s(x,y)". The sharpening filter used in this design is shown in Figure 2. "Morphology hat transform" is applied on the "v1(x,y)". It improves the contrast of VI image. The "morphology hat transform" output is indicated as "m(x,y)". High boost filter is applied on the "m(x,y)". It is used for increasing the sharpness. So, that edges will be well preserved in the resultant image. The high boost filter output is indicated as "h(x,y)". The High boost filter used in this design is shown in Figure 5. Then, after we find the max of "s(x,y)" and it is indicated as "m3". It is given by
$m 3=\max (s(x, y))$ (13)
Similarly, we find the max of "h(x,y)" and it is indicated as "m4". It is given by
$m 4=\max (h(x, y))$ (14)
Mainly max gives highest intensity value of image. The max values m1 and m2 constructed using this method are the improved max values than the original max values.
Finally, "W3" and "W4" are generated by
$W 3=m 3 \div(m 3+m 4)$ (15)
$W 4=m 4 \div(m 3+m 4)$ (16)
Weights W3 obtained with using m3 and m4 contains much improved IR edge information. Similarly W2 contains much improved VI edge information.
4.1 Software and hardware used
The software utilized for the development of the proposed method is MATLAB R2019b. The hardware equipment utilized is a computer system with features 1TB hard-disk, 4GB RAM, and Core i5 processor.
4.2 Image database
Mainly five sets of IR and VI source images are used for analyzing the proposed method performance. They are shown in Figures 9-13. The image database that has been used in this work is taken from the TNO image fusion dataset [25].
4.3 Comparison methods
The comparison methods that are chosen for evaluating the proposed method performance are
All the three above methods are implemented and have been used for evaluating proposed method performance in this paper.
4.3.1 Procedure for sharpen filters fusion method
First source images are resized into 256 x 256 images. Here source images used are IR image and VI image. The 3 x 3 sharpen filtering technique is applied on the output of resized IR image for enhancement of contrast in the spatial domain. The 3 x 3 sharpen filter1 that has used is shown in Figure 7.
Figure 7. 3 x 3 sharpen filter1
Later DWT is applied on both resized VI image and output of sharpening filter. It produces both detailed and approximation sub-bands. The "weighted average fusion strategy" has used for integrating "approximation" and "detailed" sub-bands. Finally, IDWT produces the final fused image. The major limitation of the work is the visible image details are not much reflected in the final fused image.
4.3.2 Procedure for spatial domain multi-modality fusion method
First source images are resized into 256 x 256 images. Here source images used are IR image and VI image. PCA is applied on both resized images for reducing dimensionality. Later sharpen filter and the histogram equalization are applied on the outputs of PCA of IR image and PCA of VI image. The sharpen filter2 used in this method is shown in Figure 8.
This method is developed in the spatial domain. Finally "weighted average fusion strategy" has used for fusing output images of sharpening filter and histogram equalization. Finally, the resultant image is generated.
Figure 8. 3 x 3 sharpen filter2
Mainly this method is developed in spatial domain. So, it has produced blurred result.
4.3.3 Procedure for DWT based unsharp masking fusion method
First source images are resized into 256 x 256 images. Here source images used are IR image and VI image. DWT is applied on both resized images. Later unsharp masking technique is applied on approximation sub-bands which are produced after DWT decomposition. Here "Average fusion rule" is used for integrating "low-frequency" sub-bands. "Max fusion rule" has been used for integrating "high-frequency" sub-bands. Finally, IDWT produces the resultant fused image. But the drawback of this method is, details of source images have not reflected much in the resultant fused image.
4.4 Subjective analysis
The subjective analysis gives clear picture regarding "proposed method" performance.
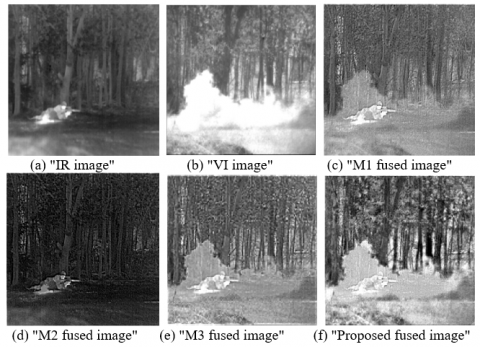
Figure 9 shows the "soldier image" fused results. (a) represents "IR image", (b) represents "VI image" (c) represents "Fused image of sharpen filters fusion method" and is indicated as "M1 fused image". (d) represents "Fused image of Spatial domain multi-modality fusion method" and is indicated as "M2 fused image". (e) represents "Fused image of DWT based unsharp masking fusion method" and is indicated as "M3 fused image". (f) represents "Proposed method fused image ".
It clearly shows that when compared to fused images shown in Figures 9(c-e), proposed method fused image shown in Figure 9f is exhibiting high contrast. So, that soldier and trees are visualized clearly in fused image of proposed method.
We can easily notice that details of person, tree, and board are not clearly appeared in existing method resultant images shown in Figures 10(c-e) because due to a lack of brightness and edge preservation information. But same details are clearly appeared in the resultant image of proposed method shown in Figure 10(f). The main reason is that edge information is well preserved in the proposed method resultant image.
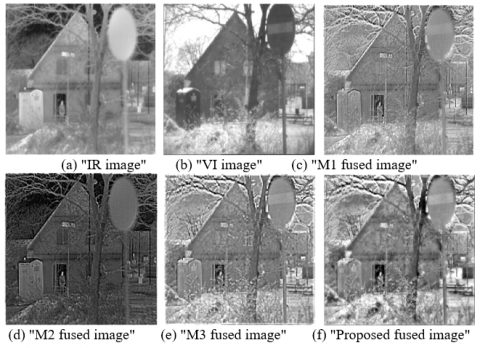
Out of all method fused images shown in Figures 11(c-f). Two person, house, and board details are appeared visually better in the resultant image of proposed method. Since proposed method has obtained rich edge information.
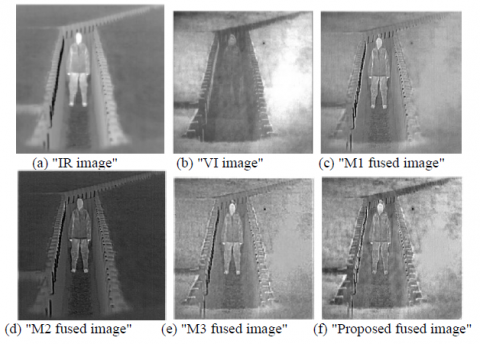
Visible image information is very much reflected in the resultant image of proposed method shown in Figure 12(f). Due to that soldier and trench details are appeared better in the proposed method resultant image.
Figure 9. The "soldier image" fused results
Figure 10. The "single person image" fused results
Figure 11. The "Two person image" fused results
Figure 12. The "soldier in trench image" fused results
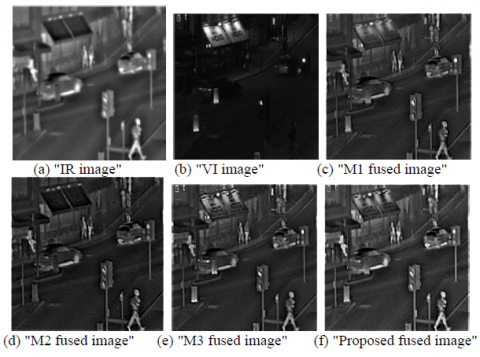
Figure 13. The "Traffic image" fused results
The display board, cars and persons details are not clearly appeared in existing method resultant images shown in Figures 13(c-e). Whereas, they are clearly visualized in the fused image of proposed method shown in Figure 13(f). It is mainly because the proposed resultant image has achieved better contrast and also rich amount of texture information.
4.5 Performance metrics
Mean: It is particularly used for measuring average brightness information of the fused image. Its value should always be high. So, that the visual clarity of image looks better. The formula is given by
$M=\frac{1}{(M\times N)}\sum\limits_{x=1}^{M}{\sum\limits_{y=1}^{N}{I(x,y)}}$ (17)
Standard deviation: It is particularly used for reflecting the amount of contrast information present in the fused image. Its value should always be high. So, that the visual clarity of image looks better. The formula is given by
$SD=\sqrt{\frac{1}{(M\times N)}\sum\limits_{x=1}^{M}{\sum\limits_{y=1}^{N}{{{(I(x,y)-M)}^{2}}}}}$ (18)
Information Entropy: It is particularly used for reflecting the amount of information present in the fused image. Its value should always be high. So, that image contains abundant information such as rich textures. The formula is given by
$IE=-\sum\limits_{i=0}^{L-1}{p(i)\log p(i)}$ (19)
Mean gradient: It is particularly used for reflecting the amount of preserved edge information present in the fused image. Its value should always be high. So, that image contains more detailed information. The formula is given by
$MG=\frac{1}{(M-1)(N-1)}\sum\limits_{x=1}^{M-1}{\sum\limits_{y=1}^{N-1}{\sqrt{G}}}$ (20)
$G=\frac{{{[I(x,y)-I(x-1,y)]}^{2}}+{{[I(x,y)-I(x,y-1)]}^{2}}}{2}$ (21)
Spatial frequency: It is particularly used for reflecting the overall activity information of the fused image in the spatial domain. Its value should always be high. So, that the visual clarity of image looks better. The formula is given by
$SF=\sqrt{{{(RF)}^{2}}+{{(CF)}^{2}}}$ (22)
$RF=\sqrt{\frac{1}{M\times N}\sum\limits_{x=0}^{M-1}{\sum\limits_{y=1}^{N-1}{{{[I(x,y)-I(x,y-1)]}^{2}}}}}$ (23)
$CF=\sqrt{\frac{1}{M\times N}\sum\limits_{x=0}^{M-1}{\sum\limits_{y=1}^{N-1}{{{[I(x,y)-I(x-1,y)]}^{2}}}}}$ (24)
4.6 Objective analysis
The objective analysis gives accurate information for evaluating the proposed method performance. Here proposed method has compared mainly with sharpen filters fusion method and is represented as M1, Spatial domain multi-modality fusion method and is represented as M2, and DWT based unsharp masking fusion method and is represented as M3 using various performance metrics such as mean and is indicated as M, standard deviation and is indicated as SD, information entropy and is indicated as IE, mean gradient and is indicated as MG and spatial frequency and is indicated as SF.
Table 1. "Soldier image" objective assessment results
|
Method |
Metrics |
||||
|
Mean |
SD |
IE |
MG |
SF |
|
|
M1 |
124.0698 |
40.5652 |
7.2105 |
16.9310 |
31.4599 |
|
M2 |
43.2393 |
34.1662 |
6.5312 |
18.3565 |
36.8269 |
|
M3 |
125.3929 |
44.2200 |
7.3553 |
16.5040 |
33.8773 |
|
Proposed |
135.8813 |
61.3695 |
7.7746 |
22.8902 |
41.1098 |
Table 2. "Single person image" objective assessment results
|
Method |
Metrics |
||||
|
Mean |
SD |
IE |
MG |
SF |
|
|
M1 |
147.1593 |
39.9328 |
7.1003 |
18.7731 |
38.6861 |
|
M2 |
71.6086 |
43.0949 |
6.8065 |
19.8960 |
45.3770 |
|
M3 |
148.3919 |
47.2521 |
7.2757 |
20.7399 |
45.1552 |
|
Proposed |
148.6469 |
61.6626 |
7.5167 |
25.4124 |
49.3721 |
Table 3. "Two person image" objective assessment results
|
Method |
Metrics |
||||
|
Mean |
SD |
IE |
MG |
SF |
|
|
M1 |
134.9493 |
33.4370 |
6.7858 |
15.4056 |
31.7258 |
|
M2 |
66.7068 |
36.1359 |
6.6406 |
16.5647 |
37.0675 |
|
M3 |
135.7702 |
39.9744 |
6.9771 |
15.6680 |
35.8205 |
|
Proposed |
137.6011 |
50.4508 |
7.2703 |
19.4005 |
39.3325 |
Table 4. "Soldier in trench image" objective assessment results
|
Method |
Metrics |
||||
|
Mean |
SD |
IE |
MG |
SF |
|
|
M1 |
147.9086 |
31.2237 |
6.7472 |
9.9293 |
26.4840 |
|
M2 |
69.4152 |
30.6458 |
6.0319 |
10.6731 |
28.8537 |
|
M3 |
147.9915 |
33.4422 |
6.8864 |
10.8619 |
26.5583 |
|
Proposed |
150.8121 |
41.1177 |
7.2268 |
14.3626 |
33.2842 |
Table 5. "Traffic image" objective assessment results
|
Method |
Metrics |
||||
|
Mean |
SD |
IE |
MG |
SF |
|
|
M1 |
59.5920 |
31.3472 |
6.4518 |
10.5824 |
24.4383 |
|
M2 |
43.0666 |
30.4120 |
6.3542 |
11.1434 |
25.3689 |
|
M3 |
53.5542 |
34.4583 |
6.4867 |
10.0918 |
28.7333 |
|
Proposed |
68.1124 |
43.8726 |
6.8573 |
14.7427 |
34.1779 |
Tables 1-5, shows different images objective assessment results. Where Table 1 shows "Soldier image" objective assessment results, Table 2 shows "Single person image" objective assessment results, Table 3 shows "Two-person image" objective assessment results, Table 4 shows "Soldier in trench image" objective assessment results, and Table 5 shows "Traffic image" objective assessment results. Highlighted values using bold in Tables 1-5 represent better values.
The mean and standard deviation metrics are used for assessing brightness as well as contrast details of resultant fused image.
From Tables 1-5, we can see that the proposed method got better values of a mean and standard deviation compared to other methods. It means, proposed method has shown improved performance in achieving good brightness and high contrast.
Information entropy and mean gradient are quality metrics mainly used for assessing the amount of information and edge preserving details present in the resultant fused image.
From Tables 1-5, it clearly shows that the proposed method has got better values of information entropy and mean gradient compared to other methods. This clearly indicates that the proposed method fused image contains more edge preserving information.
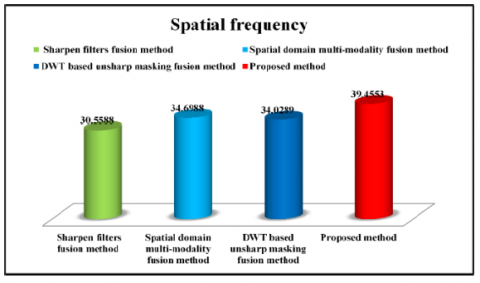
Finally, spatial frequency metric is used for assessing the overall activity level present in the fused image. From Tables 1-5, we can observe clearly that the proposed method got much better values of spatial frequency compared to other methods. This shows that information of source images has mostly transferred to the proposed method fused image.
Table 6 shows average results comparison of objective assessment of various methods. Here in this table values highlighted using bold represent better values. Table 6 clearly shows that the proposed method got better results than the existing method results. So, these results give clear indication that the proposed method has generated high quality resultant fused image with high contrast and more detailed information.
Figures 14-18, shows average results comparison of various methods using various metrics such as mean, standard deviation, information entropy, mean gradient, and spatial frequency.
From Figures 14-18, it can be clearly seen that the proposed method has shown better performance than the existing methods.
Table 6. Average results comparison of objective assessment of various methods
|
Method |
Metrics |
||||
|
Mean |
SD |
IE |
MG |
SF |
|
|
M1 |
122.7358 |
35.3011 |
6.8591 |
14.3243 |
30.5588 |
|
M2 |
58.8073 |
34.8909 |
6.4728 |
15.3267 |
34.6988 |
|
M3 |
122.2201 |
39.8694 |
6.9962 |
14.7731 |
34.0289 |
|
Proposed |
128.2107 |
51.6946 |
7.3291 |
19.3617 |
39.4553 |
Figure 14. Average results comparison of various methods using Mean
Figure 15. Average results comparison of various methods using standard deviation
Figure 16. Average results comparison of various methods using information entropy
Figure 17. Average results comparison of various methods using mean gradient
Figure 18. Average results comparison of various methods using spatial frequency
This paper presents a DWT based novel multimodal image fused method. Primarly source images are resized to 256 x 256 images. For edge enhancement and contrast improvement, the 3 x 3 sharpen filter and morphology hat transform are applied separately on resized IR image and VI image. The fusion method is developed with using single level decomposition of DWT multi-scale transform. Mainly two new fusion rules are introduced in this algorithm.
"Filters based mean-weighted fusion rule" has been used for combining "low frequency" sub-bands in order to improve brightness and sharpness information of fused result.
"Filters based max-weighted fusion rule" has been used for combining “high frequency" sub-bands mainly for improving edge information of final result.
The reconstruction of fused result is done with IDWT. Five pairs of IR and VI images have been used for testing the proposed method performance. Three similar existing methods are implemented and have been used in this paper for evaluating performance of proposed method.
The overall conclusion of the paper is that proposed algorithm has produced superior and much better results than similar existing techniques in both ways that is subjective manner and objectively wise.
[1] Jin, X., Jiang, Q., Yao, S., Zhou, D., Nie, R., Hai, J., He, K. (2017). A survey of infrared and visual image fusion methods. Infrared Physics & Technology, 85: 478-501. https://doi.org/10.1016/j.infrared.2017.07.010
[2] Ma, J., Ma, Y., Li, C. (2019). Infrared and visible image fusion methods and applications: A survey. Information Fusion, 45: 153-178. https://doi.org/10.1016/j.inffus.2018.02.004
[3] Muller, A.C., Narayanan, S. (2009). Cognitively-engineered multisensor image fusion for military applications. Information Fusion, 10(2): 137-149. https://doi.org/10.1016/j.inffus.2008.08.008
[4] Naidu, V.P.S. (2011). Image fusion technique using multi-resolution singular value decomposition. Defence Science Journal, 61(5): 479. https://doi.org/10.14429/dsj.61.705
[5] Paramanandham, N., Rajendiran, K. (2018). Multi sensor image fusion for surveillance applications using hybrid image fusion algorithm. Multimedia Tools and Applications, 77(10): 12405-12436. https://doi:10.1007/s11042-017-4895-3
[6] Bhatnagar, G., Liu, Z. (2015). A novel image fusion framework for night-vision navigation and surveillance. Signal, Image and Video Processing, 9(1): 165-175. https://doi:10.1007/S11760-014-0740-6
[7] Li, H., Ding, W., Cao, X., Liu, C. (2017). Image registration and fusion of visible and infrared integrated camera for medium-altitude unmanned aerial vehicle remote sensing. Remote Sensing, 9(5): 441. https://doi.org/10.3390/rs9050441
[8] Chang, X., Jiao, L., Liu, F., Xin, F. (2010). Multicontourlet-based adaptive fusion of infrared and visible remote sensing images. IEEE Geoscience and Remote Sensing Letters, 7(3): 549-553. https://doi.org/10.1109/LGRS.2010.2041323
[9] Li, X., Qin, S.Y. (2011). Efficient fusion for infrared and visible images based on compressive sensing principle. IET Image Processing, 5(2): 141-147. https://doi.org/10.1049/iet-ipr.2010.0084
[10] Li, H., Liu, L., Huang, W., Yue, C. (2016). An improved fusion algorithm for infrared and visible images based on multi-scale transform. Infrared Physics & Technology, 74: 28-37. https://doi.org/10.1016/j.infrared.2015.11.002
[11] Vanmali, A.V., Gadre, V.M. (2017). Visible and NIR image fusion using weight-map-guided Laplacian–Gaussian pyramid for improving scene visibility. Sādhanā, 42(7): 1063-1082. https://doi.org/10.1007/s12046-017-0673-1
[12] Bulanon, D.M., Burks, T.F., Alchanatis, V. (2009). Image fusion of visible and thermal images for fruit detection. Biosystems Engineering, 103(1): 12-22. https://doi.org/10.1016/j.biosystemseng.2009.02.009
[13] Niu, Y., Xu, S., Wu, L., Hu, W. (2012). Airborne infrared and visible image fusion for target perception based on target region segmentation and discrete wavelet transform. Mathematical Problems in Engineering, 2012. https://doi.org/10.1155/2012/275138
[14] Li, H., Manjunath, B.S., Mitra, S.K. (1995). Multisensor image fusion using the wavelet transforms. Graphical Models and Image Processing, 57(3): 235-245. https://doi.org/10.1006/gmip.1995.1022
[15] Aishwarya, N., Thangammal, C.B. (2018). Visible and infrared image fusion using DTCWT and adaptive combined clustered dictionary. Infrared Physics & Technology, 93: 300-309. https://doi.org/10.1016/j.infrared.2018.08.013
[16] Saeedi, J., Faez, K. (2012). Infrared and visible image fusion using fuzzy logic and population-based optimization. Applied Soft Computing, 12(3): 1041-1054. https://doi.org/10.1016/j.asoc.2011.11.020
[17] Liu, H.X., Zhu, T.H., Zhao, J.J. (2013). Infrared and visible image fusion based on region of interest detection and nonsubsampled contourlet transform. Journal of Shanghai Jiaotong University (Science), 18(5): 526-534. https://doi.org/10.1007/s12204-013-1437-7
[18] Cai, J., Cheng, Q., Peng, M., Song, Y. (2017). Fusion of infrared and visible images based on nonsubsampled contourlet transform and sparse K-SVD dictionary learning. Infrared Physics & Technology, 82: 85-95. https://doi.org/10.1016/j.infrared.2017.01.026
[19] Shah, P., Merchant, S.N., Desai, U.B. (2010). Fusion of surveillance images in infrared and visible band using curvelet, wavelet and wavelet packet transform. International Journal of Wavelets, Multiresolution and Information Processing, 8(02): 271-292. https://doi.org/10.1142/S0219691310003444
[20] Han, X., Zhang, L., Du, L., Huan, K., Shi, X. (2015). Fusion of infrared and visible images based on discrete wavelet transform. In Selected Papers of the Photoelectronic Technology Committee Conferences held June–July 2015, 9795, 97951O. https://doi.org/10.1117/12.2216054
[21] Zhan, L., Zhuang, Y. (2016). Infrared and visible image fusion method based on three stages of discrete wavelet transform. International Journal of Hybrid Information Technology, 9(5): 407-418. http://doi.org/10.14257/ijhit.2016.9.5.35
[22] Zhan, L., Zhuang, Y., Huang, L. (2017). Infrared and visible images fusion method based on discrete wavelet transform. J. Comput, 28(2): 57-71. https://doi.org/10.3966/199115592017042802005
[23] Habeeb, N.J., Omran, S.H., Radih, D.A. (2018). Contrast enhancement for visible-infrared image using image fusion and sharpen filters. In 2018 International Conference on Advanced Science and Engineering (ICOASE), pp. 64-69. https://doi.org/10.1109/ICOASE.2018.8548898
[24] Panguluri, S.K., Mohan, L. (2020). Discrete wavelet transform based image fusion using unsharp masking. Periodica Polytechnica Electrical Engineering and Computer Science, 64(2): 211-220. https://doi.org/10.3311/PPee.14702
[25] Toet, A. (2014). TNO image fusion dataset. figshare. Dataset. https://doi.org/10.6084/m9.figshare.1008029.v1
[26] Habeeb, N.J., Al-Taei, A., Fadhil-Ibrahim, M. (2018). Contrast enhancement for multi-modality image fusion in spatial domain. Journal of Theoretical and Applied Information Technology, 96(20): 6926-6936.