Nagadevi Darapureddy* | Nagaprakash Karatapu | Tirumala Krishna Battula
© 2021 IIETA. This article is published by IIETA and is licensed under the CC BY 4.0 license (http://creativecommons.org/licenses/by/4.0/).
OPEN ACCESS
Breast cancer is a cancerous tumor that arrives within the tissues of the breast. Women are mostly attacked than men. To detect early cancer medical specialists, suggest mammography for screening. Algorithms in Machine learning were executed on mammogram images to classify whether the tissues are deleterious or not. An analysis is done based on the texture feature extraction using different techniques like Frequency decoded local binary pattern (FDLBP), Local Bit-plane Decoded Pattern (LBDP), Local Diagonal Extrema Pattern (LDEP), Local Directional Order Pattern (LDOP), Local Wavelet Pattern (LWP). The features extracted are tested on 322 images from MIA’s database of three different classes. The algorithms in Machine learning like K-Nearest Neighbor classifier (KNN), Support vector classifier (SVC), Decision Tree classifier (DTC), Random Forest classifier (RFC), AdaBoost classifier (AC), Gradient Boosting classifier (GBC), Gaussian Naive Bayes classifier (GNB), Linear Discriminant Analysis classifier (LDA), Quadratic Discriminant Analysis classifier (QDA) were used to evaluate the accuracy of classification. This paper examines the comparison of accuracy using different texture features. KNN algorithm with LDEP for texture feature extraction gives classification accuracy of 64.61%, SVC with all the texture patterns mentioned gives classification accuracy of 63.07%, DTC with FDLBP, LBDP gives classification accuracy of 47.69, RFC with LBDP and AC with LDOP and GBC with FDLBP gives 61.53% classification accuracy, GNB and LDA with FDLBP gives 60% and 63.07% classification accuracy respectively, QDA with LBDP gives 64.61 classification accuracy. Of all the Algorithms support vector classifier gives good accuracy results with all the texture patterns mentioned.
texture patterns, classification, machine learning algorithms, accuracy, local binary pattern variants, mammograms, local directional order pattern, local wavelet pattern
The quick advancement of lifestyle, hormonal, environmental circumstances there is an uptrend in breast cancer cells [1] in the body grow, double and change the shape. In women, the 2nd most common cancer [2] is breast cancer annually about 16 lakh women are identified. Detection and medication in the early stage improve survival rates.
Though manual screening is used for the detection of cancer tissues, Computer-aided examination [3] has been used in today’s medicinal practices. In computer vision, the effective active area of research is feature detection and description from medical images. There are multiple feature extraction techniques based on shape, colour, edges, color histograms, texture [4-9], etc. Texture characteristics of images are more important than color and shape as it contains the core in identifying the tissues. Features are extracted by using texture properties for image classification. Image classification is a task to categorize different situations in breast cancer. The efficiency of analysis and classification relies on describing features from the images.
Local Binary Pattern (LBP) proposed by Ojala became well-liked due to its reduced difficulty for extracting features. Later on several variants of LBP like Local derivative pattern [4], Local Tetra Pattern [5], Local Mesh pattern [6], Local Line binary pattern [7], Random Sampling LBP [8], Quantised FLBP [9], Elongated quinary pattern [10] and many more came into existence. These patterns are used to improve the classification rate.
This article presents the comparison of different texture patterns like FDLBP, LBDP, LDEP, LDOP, and LWP were executed on mammogram images to predict accuracy with the help of different machine learning algorithms.
Most of the existing local descriptors are generated over the raw input images to increase the discriminative power of the local descriptors by converting the raw image into multiple images with high and low pass frequency filters. The local descriptors from filtered image output are concatenated into a single descriptor. This approach does not utilize the inter frequency relationship which causes less improvement in the discriminative power of the descriptor. This disadvantage can be solved by using FDLBP which uses two decoders. Each decoder works with one low frequency pattern and two high frequency patterns. At last, the descriptors from both decoders are concatenated to form a single descriptor. LBDP transforms the local neighbourhood in bit planes and then encodes the relationship between the centre pixel intensity value and transformed value to generate the LBDP binary pattern. This method depends on the bit depth of the image and also it is also invariant to the number of local neighbours under consideration. LDEP finds the values and indexes of the local diagonal extrema’s to exploit the relationship among the diagonal neighbours of any center pixel of the image using first order local diagonal derivatives. The descriptor is formed on the basis of the indexes and comparison of central pixel and local diagonal extrema’s. LDOP is calculated by finding the relationship between the center pixel and local directional order indexes.
In local binary pattern it considers the relationship between centre pixel and its neighbour pixels where as in LWP it first utilizes the relationship among the neighbouring pixel using local wavelet decomposition.
The subsequent sections of this article are arranged as follows: Section 2 introduces the methodology. Section 3 provides an experiment and analysis of results. Section 4 is assigned for conclusions and the possible extension of this work, followed by a bibliography referred to in this article.
Figure 1 shows the workflow of the proposed classification algorithm.
2.1 Image database
For the investigation of textures, the MIAS mammogram dataset is used. This data set consists of 63 benign images, 208 normal images and 51 malignant images. Figure 2 shows a sample of Benign, Normal and Malignant images in MIAS dataset. Texture features are extracted using different descriptors. Of this data, 70 percent is used for training and 30 percent is used for testing which is used for finding accuracy for classification.
2.2 Pre-processing
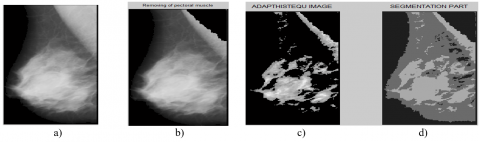
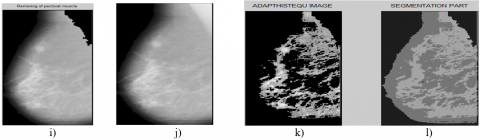
To extract the main region for processing, pectoral muscle and other artifacts like labels, annotations present in mammogram images are removed using pre-processing techniques. The methods used are median filtering to remove noise, adaptive histogram equalization to enhance the contrast, a boundary is extracted and then segmented to see the region of interest. The ROI obtained of each image is employed for analysing the mammogram images. Figure 3 shows results of preprocessing.
Figure 1. Proposed work flow for classification of Mammogram images
Figure 2. Dataset of MIAS a) Benign image b) Normal image c) Malignant image
Figure 3. Results of pre-processing a) Benign mammogram cropped image b) Pectoral muscle removed image c) Adaptive histogram Equalised Image d) Segmented part of Benign image e) Normal mammogram cropped image f) Pectoral muscle removed image g) Adaptive histogram equalised image h) Segmented part of normal image i) Malignant mammogram cropped image j) Pectoral muscle removed image k) Adaptive histogram equalised image l) Segmented part of malignant image
2.3 Feature extraction
Texture features are extracted from the ROI extracted images using descriptors like FDLBP, LBDP, LDEP, LDOP, and LWP. The Histogram is performed on these images to form the feature vectors. Each descriptor gives different sizes of feature vectors.
2.3.1 Frequency decoded local binary pattern (FDLBP)
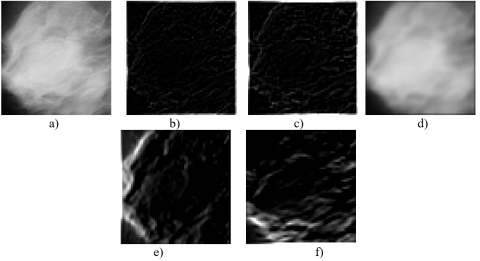
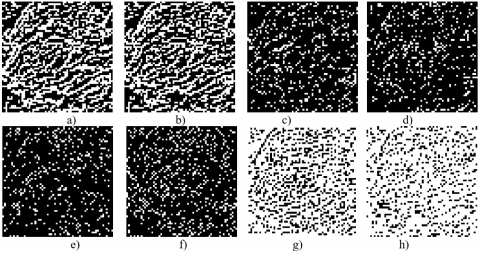
Figure 4 shows flow of FDLBP. In this method [11] one low pass filter i.e. an average filter that produces the coarse information and four high pass filters horizontal-vertical difference filter, diagonal difference filter, Sobel vertical edge filter, Sobel horizontal edge filter which produces the detailed information. Figure 5 shows the low pass and high pass filtered mammogram images. For these frequency filtered domain images, the local binary pattern is generated for each image. To realize the relationship between different frequencies filtered images, decoders are used. In this paper, two decoders are used each with 3 inputs and 8 outputs. For the first decoder horizontal-vertical filter, diagonal filter, average filter are inputs and for the second decoder average filter, Sobel-vertical filter and Sobel-horizontal filter are inputs. Figure 5 shows the filtered output images from the low and high pass filters. Figure 6 shows the decoder i.e. first and second decoder output images. Histogram of these images is taken, and then a feature vector is formed from the histogram. The low pass and high pass filters can be defined as:
Average filter as:
$\begin{array}{lll}1 / 9 & 1 / 9 & 1 / 9 \\ 1 / 9 & 1 / 9 & 1 / 9 \\ 1 / 9 & 1 / 9 & 1 / 9\end{array}$
Horizontal-Vertical filter as:
$\begin{array}{ccc}0 & -1 & 0 \\ -1 & 4 & -1 \\ 0 & -1 & 0\end{array}$
Diagonal filter as:
$\begin{array}{ccc}-1 & 0 & -1 \\ 0 & 4 & 0 \\ -1 & 0 & -1\end{array}$
Sobel-Vertical filter as:
$\begin{array}{ccc}1 & 2 & 1 \\ 0 & 0 & 0 \\ -1 & -2 & -1\end{array}$
Sobel-Horizontal filter as:
$\begin{array}{rrr}1 & 0 & -1 \\ 2 & 0 & -2 \\ 1 & 0 & -1\end{array}$
2.3.2 Local Bit-plane Decoded Pattern (LBDP)
In this technique [12], the eight neighbour’s intensities of the centre pixel are decoded to eight-bit planes. Each bit plane weighted values are added to get local bit plane transformed values which are called local bit plane transformation. A Higher bit plane provides coarse details and a lower bit plane provides fine details. Local bit plane decoded pattern is formed by subtracting centre pixel from local bit plane transformed values. Figure 7 shows the images of each bit plane.
2.3.3 Local Diagonal Extrema pattern (LDEP)
In this technique [13], diagonal neighbours are used as it contains local information which decreases the dimension of the descriptor. First-order local diagonal derivatives are derived in three directions which were compared with local diagonal maxima and minima concerning center pixel to generate the local diagonal extrema pattern which are shown in Figure 8.
Figure 4. Flow for FDLBP
Figure 5. Low pass and High pass filtered mammogram images (a) Original image (b) Image after horizontal–vertical filter (c) Image after diagonal filter (d) Image after average filter (e) Image after sobel-vertical filter (f) Image after sobel-horizontal filter
Figure 6. Decoder output images:(a), (b), (c), (d), (e), (f), (g), (h) are Images after first decoder (i), (j), (k), (l), (m), (n), (o), (p) are images after second decoder
Figure 7. Each bit plane local bit plane transformed value maps. (a), (b), (c), (d), (e), (f), (g), (h) Images for each bit plane
Figure 8. First order local diagonal derivatives
Figure 9. Local directional order maps in (a) 0o (b) 45o (c) 90o (d) 135o (e) 180o (f) 225o (g) 270o (h) 315o
Figure 10. Final local wavelet map of input image
2.3.4 Local Directional Order Pattern (LDOP)
In this technique local directional orders [14], are calculated in 8-directions i.e., 0o, 45o, 90o, 135o, 180o, 225o, 270o, 315o and the corresponding images are shown in Figure 9. Then centre pixel transformation is done to relate with the local directional orders. Then Histogram is performed to form the local directional order pattern feature vector.
2.3.5 Local Wavelet pattern (LWP)
In this technique [15] local wavelet decomposition is done using 1-D Haar wavelet on local neighbours. These wavelets transformed values are related with centre pixel value then converted to a binary form for local wavelet pattern. Figure 10 shows the final local wavelet map of the input image.
2.4 Feature scaling
The feature vectors obtained from the above texture methods will have a broad range of values. Machine learning algorithms will work properly when these broad range of values are normalized. In this article, it is done by using min-max scaler.
2.5 Machine learning algorithms
The feature vectors after scaling are applied to different machine learning algorithms like KNN, SVC, DTC, RFC, AC, GBC, GNB, LDA, QDA and accuracy is compared for all the texture methods.
Table 1 shows accuracy using different machine learning algorithms with different texture patterns. It can be observed that accuracy is the same using SVM for all the texture patterns. Accuracy is high using LDEP texture pattern with KNN when compared with other algorithms. Accuracy is the same for FDLBP, LBDP using DTC. The algorithms RFC, AC, GBC are showing the same accuracy but with different texture patterns. For LDA accuracy rate is same for FDLBP and LDEP. Other texture patterns can be implemented like local directional ternary pattern [16] etc.
Table 1. Accuracy using different texture patterns
|
Algorithm |
FDLBP |
LBDP |
LDEP |
LDOP |
LWP |
|
KNN |
55.38 |
58.46 |
64.61 |
53.84 |
53.84 |
|
SVC |
63.07 |
63.07 |
63.07 |
63.07 |
63.07 |
|
DTC |
47.69 |
47.69 |
43.07 |
41.53 |
36.92 |
|
RFC |
55.38 |
61.53 |
56.92 |
56.92 |
53.84 |
|
AC |
58.46 |
58.46 |
46.15 |
61.53 |
53.84 |
|
GBC |
61.53 |
58.46 |
60.00 |
53.84 |
55.38 |
|
GNB |
60.00 |
47.69 |
40.00 |
52.30 |
40.00 |
|
LDA |
63.07 |
26.15 |
63.07 |
49.23 |
36.92 |
|
QDA |
44.16 |
64.61 |
55.38 |
33.84 |
58.46 |
The accuracy for classification [17] of Mammograms can be improved using k-Fold cross validation [18]. Here the k value is 5. Table 2 shows improved accuracy by using k -Fold cross validation and time required to execute in sec.
Table 2. Accuracy improvement using k-fold cross validation
|
Model |
Accuracy |
Run Time (in sec) |
|
KNN |
89.63 |
0.02 |
|
SVC |
90.15 |
0.17 |
|
DTC |
90.70 |
0.07 |
|
RFC |
88.12 |
0.03 |
|
AC |
89.51 |
0.02 |
|
GBC |
87.76 |
0.27 |
|
GNB |
86.12 |
0.27 |
|
LDA |
88.57 |
0.19 |
|
QDA |
82.13 |
0.24 |
Image retrieval can be done by using hybrid image descriptor [19, 20] i.e. combining two or more texture patterns. These texture patterns can be used for feature matching [21], for shape analysis of mammograms for mammographic calcification [22]. Learning various local feature descriptors [23] and using optimization techniques [24] classification and retrievel of medical images can be achieved with high accuracy.
This paper has presented the classification of Mammograms using different machine learning algorithms by considering different texture patterns as their features. Using the only extraction of texture patterns as feature extraction, KNN algorithm has achieved 64.6 as the highest accuracy. While considering all texture extraction methods Support vector Classifier gives better result. Of all the texture extraction methods Frequency decoded local binary pattern (FDLBP) gives better texture feature patterns. The classification can be improved by extracting and considering more features like statistical properties, shape properties, etc. By using K-Fold cross validation the accuracy can be increased. Decision Tree classifier gives 90.70% accuracy when compared with other classifiers.
|
FDLBP |
Frequency Decoded Local Binary Pattern |
|
LBDP |
Local Bit-Plane Decoded Pattern |
|
LDEP LDOP |
Local Diagonal Extrema Pattern Local Directional Order Pattern |
|
LWP |
Local Wavelet Pattern |
|
KNN |
K-Nearest Neighbour Classifier |
|
SVC |
Support Vector Classifier |
|
DTC |
Decision Tree Classifier |
|
RFC |
Random forest Classifier |
|
AC |
AdaBoost Classifier |
|
GBC |
Gradient Boosting Classifier |
|
GNB |
Gaussian Naïve Bayes |
|
LDA |
Linear Discriminant Analysis |
[1] Akay, M.F. (2009). Support vector machines combined with feature selection for breast cancer diagnosis. Expert Systems with Application, 36(2): 3240-3247. https://doi.org/10.1016/j.eswa.2008.01.009
[2] Asri, H., Mousannif, H., Al Moatassime, H., Noel, T. (2016). Using machine learning algorithms for breast cancer risk prediction and diagnosis. Procedia Computer Science, 83: 1064-1069. https://doi.org/10.1016/j.procs.2016.04.224
[3] Bosch, A., Muñoz, X., Oliver, A., Martí, J. (2006). Modeling and classifying breast tissue density in mammograms. 2006 IEEE Computer Society Conference on Computer Vision and Pattern Recognition (CVPR'06), New York, USA, pp. 1552-1558. https://doi.org/10.1109/CVPR.2006.188
[4] Zhang, B., Gao, Y., Zhao, S., Liu, J. (2010). Local derivative pattern versus local binary pattern: Face recognition with high-order local pattern descriptor. IEEE Transactions on Image Processing, 19(2): 533-544. https://doi.org/10.1109/TIP.2009.2035882
[5] Murala, S., Maheshwari, R.P., Balasubramanian, R. (2012). Local tetra patterns: A new feature descriptor for content-based image retrieval. IEEE Transactions on Image Processing, 21(5): 2874-2886. https://doi.org/10.1109/TIP.2012.2188809
[6] Murala, S., Wu, Q.M.J. (2014). Local mesh patterns versus local binary patterns: biomedical image indexing and retrieval. IEEE Journal of Biomedical and Health Informatics, 18(3): 929-938. https://doi.org/10.1109/JBHI.2013.2288522
[7] Petpon, A., Srisuk. S. (2009). Face recognition with local line binary pattern. 2009 Fifth International Conference on Image and Graphics, Xi'an, China, pp. 533-539. https://doi.org/10.1109/ICIG.2009.123
[8] Wang, Q., Li, B., Chen, X., Luo, J., Hou, Y. (2017). Random sampling local binary pattern encoding based on gaussian distribution. IEEE Signal Processing Letters, 24(9): 1358-1362. https://doi.org/10.1109/LSP.2017.2728122
[9] Ren, J., Jiang, X., Yuan, J. (2015). Quantized fuzzy LBP for face recognition. 2015 IEEE International Conference on Acoustics, Speech and Signal Processing (ICASSP), South Brisbane, QLD, Australia, pp. 1503-1507. https://doi.org/10.1109/ICASSP.2015.7178221
[10] Al-Sumaidaee, S.A.M., Abdullah, M.A.M., Al-Nima, R.R.O., Dlay, S.S., Chambers, J.A. (2017). Multi-gradient features and elongated quinary pattern encoding for image-based facial expression recognition. Pattern Recognition, 71: 249-263. https://doi.org/10.1016/j.patcog.2017.06.007
[11] Dubey, S.R. (2019). Face retrieval using frequency decoded local descriptor. Multimedia Tools and Applications, 78: 16411-16431. https://doi.org/10.1007/s11042-018-7028-8
[12] Dubey, S.R., Singh, S.K., Singh, R.K. (2016). Local bit-plane decoded pattern: A novel feature descriptor for biomedical image retrieval. IEEE Journal of Biomedical and Health Informatics, 20(4): 1139-1147. https://doi.org/10.1109/JBHI.2015.2437396
[13] Ryu, B., Rivera, A.R., Kim, J., Chae, O. (2017). Local directional ternary pattern for facial expression recognition. IEEE Transactions on Image Processing, 26(12): 6006-6018. https://doi.org/10.1109/TIP.2017.2726010
[14] Dubey, S.R., Mukherjee, S. (2020). LDOP: Local directional order pattern for robust face retrieval. Multimedia Tools and Applications, 79: 6363-6382. https://doi.org/10.1007/s11042-019-08370-x
[15] Dubey, S.R., Singh, S.K., Singh, R.K. (2015). Local wavelet pattern: A new feature descriptor for image retrieval in medical CT databases. IEEE Transactions on Image Processing, 24(12): 5892-5903. https://doi.org/10.1109/TIP.2015.2493446
[16] Ryu, B., Rivera, A.R., Kim, J., Chae, O. (2017). Local directional ternary pattern for facial expression recognition. IEEE Transactions on Image Processing, 26(12): 6006-6018. https://doi.org/10.1109/TIP.2017.2726010
[17] Dubey, S.R., Jalal, A.S. (2016). Apple disease classification using color, texture and shape features from images. Signal, Image and Video Processing, 10: 819-826. https://doi.org/10.1007/s11760-015-0821-1
[18] Darapureddy, N., Karatapu, N., Battula, T.K. (2019). Research on machine learning using k-fold cross validation.Internation Journal of Engineering and Advanced Technology, 8(6s): 215-218 https://doi.org/10.35940/ijeat.F1043.0886S19
[19] Dubey, S.R., Singh, S.K., Singh, R.K. (2015). Rotation and scale invariant hybrid image descriptor and retrieval. Computers & Electrical Engineering, 46: 288-302. https://doi.org/10.1016/j.compeleceng.2015.04.011
[20] Maji, S. (2006). A comparison of feature descriptors. Univ. California, Berkeley.
[21] Miksik, O., Mikolajczyk, K. (2012). Evaluation of local detectors and descriptors for fast feature matching. Proceedings - International Conference on Pattern Recognition, Tsukuba, Japan.
[22] Shen, L., Rangayyan, R.M., Leo Desautels, J.E. (1994). Application of shape analysis to mammographic calcifications. IEEE Trans. Med. Imaging, 13(2): 263-74. https://doi.org/10.1109/42.293919
[23] Simonyan, K., Vedaldi, A., Zisserman, A. (2016). Learning local feature descriptors using convex optimisation. IEEE Transactions on Pattern Analysis and Machine Intelligence, 36(8): 1573-1585. https://doi.org/10.1109/TPAMI.2014.2301163
[24] Darapureddy, N., Karatapu, N., Battula, T.K. (2021). Optimal weighted hybrid pattern for content based medical image retrievel using modified spider monkey optimisation. Imternational Journal of Imaging System. https://doi.org/10.1002/ima.22475