Ahmed Bouida* | Mustapha Khelifi | Mohammed Beladgham | Fatima-Zohra Hamlili
© 2021 IIETA. This article is published by IIETA and is licensed under the CC BY 4.0 license (http://creativecommons.org/licenses/by/4.0/).
OPEN ACCESS
In image processing, using compression is very important in various applications, especially those using data quantities in transmission and storing. This importance becomes most required with the evolution of image quantities and the big data systems explosion. The image compression allows reducing the required binary volume of image data by encoding the image for transmission goal or database saving. The principal problem with image compression when reducing its size is the degradation that enters the image. This degradation can affect the quality of use of the compressed image. To evaluate and qualify this quality, we investigate the use of textural combined image quality metrics (TCQ) based on the fusion of full reference structural, textural, and edge evaluation metrics. To optimize this metric, we use the Monte Carlo optimization method. This approach allows us to qualify our compressed images and propose the best metric that evaluates compressed images according to several textural quality aspects.
image quality assessment, combined FR-IQA, texture analysis, edge evaluation, image wavelet compression
In any imaging system, that uses storage or transmission, the compression process becomes an indispensable tool to reduce the required binary capacity to store and transmit these images. The importance of compression algorithms on the compression rates and processing times presents a significant challenge, especially with the increase in day-to-day big data concepts [1]. The compression process role represents an image using a few bits, which increases the compression ratio while keeping an acceptable quality of the image [2]. Unless the JPEG standards that use the discrete cosine transform and the JPEG2000 operate with the wavelet transform, most techniques proposed in the literature attempt to present and use other combinations of algorithms to optimize and minimize compression-induced degradation by having high compression ratios. Most of these techniques use Wavelet transforms of one kind or another [3, 4]. The compression algorithms that reduce the image size induce a modification and a distortion in the present data in these images. This process generates a degradation of the textural image quality, making them unusable [5].
To perform these algorithms and proceed to an evaluation of the obtained quality in compressed images, two approaches are usable; subjective methods and objective methods [6]. In the subjective context that involves the human observer for assigning a note to a degraded image, several measures are developed. These measurements respect especially the recommendations of the ISO 3664-2000 standard by the International Organization for Standardization, specifying the viewing conditions for images and the ITU-BT.500-13 standard, normalized by the International Telecommunication Union, that provides methodologies for the assessment of image quality including general methods of test, the grading scales, and the viewing conditions.
In the context of objective methods, scientists have developed numerical image quality assessment (IQA) methods to qualify various image-processing applications such as image compression methods. According to the use of a reference image, the most used objective quality indices are called full reference methods (FR-IQA) because these techniques use the total original image as a reference to compare modification in the compressed image [7]. Resumed from extensive literature sources, hundreds of full-reference image quality assessment, we can categorize the most proposed techniques into seven groups depending on how images are compared [8, 9]:
We can note that each metric presented in the literature tends to respond specifically to certain distortion types. To scan and evaluate all distortion types in a single process, some authors proposed a new idea that combines several metrics into an optimized one [10, 11]. So complementary to the seven groups cited above, we can add another category of measures that fusion some elementary quality metrics to produce a new combined parameter that evaluates the image quality over different ways at one time. The most used examples and the basic concept are discussed in the next sections of this paper.
This work proposes another combined image quality that uses three image evaluation concepts; structural, textural, and edge analyses. To find the best form of image quality evaluation, we will try to optimize this combination and calculate the best weights combination by exploiting the Monte Carlo optimization method. For this aim, we organize this paper into three parts. The first one, resume some works that use the same concept for the combined metrics. In the second part, we present our methodology proposing three ways combined metrics and their optimization by the Monte Carlo method. Finally, in the simulation results part, we discuss obtained results in evaluating some chosen images to qualify their quality.
The first idea that uses a combined approach in the quality evaluation was used in the SSIM parameter [12]. It combined three separate comparison functions; luminance, contrast, and structure, using a weighted multiplicative combination of located parameters. Another work uses the same concept to present a variant of the SSIM called IWSSIM [13] based on the Minkowski summation combination of local quality/distortion measurements. Using the same idea, Ishiyama et al. proposed a genetic algorithm optimization of the combination of a modified MS-SSIM index using a power weighted summation [14]. Another concept used the fusion of image quality metrics using the canonical correlation analysis (CCA) to present a new image quality by a decision fusion-based approach with VIF, SSIM, VSNR, and PSNR [15].
The successful attempt using a full real combined metrics is the idea named CQM and presented by Okarma [10], where the proposed combination uses three metrics MS-SSIM, VIF, and R-SVD. Another modified version of the combined metric, based on the VIF and two similarity-based image quality metrics (MS-SSIM and FSIM), has been proposed in another work [16] and named Combined Image Similarity Metric (CISI). In 2013, Okarma defined and used an Extended Hybrid Image Similarity (EHIS) combined metric combining the MS-SSIM, VIF, WFSIM, and RFSIM [17]. Isono and Shimamura [18] presented an exponentiated combination of two image quality assessment scores using PSNR and VGS. There are also some proposed variants of the combined metrics (CM) using two, three, and four possible combinations of quality indices [19].
Lukin et al. [20] proposed combining full-reference image visual quality metrics by neural network using FSIMc, PSNR-HMA, PSNR-HVS, SFF, SR-SIM, and VIF. In 2016, Oszust proposed the additive multi-metrics combination using four IQA measures, namely Linearly Combined Similarity Measures (LCSIM) [21] and the Evolutionary based Similarity Measures or ESIM [22]. In the same context, we have mentioned the work presented by Ieremeiev et al., which gives various combined full-reference image visual quality metrics called (MCOM) [11] and robust linearized combined metrics of visual image quality presenting some optimized examples [23]. Merzougui and Djerou use a genetic algorithm to propose a multi-metric fusion quality index named Multi-measures Fusion based on Multi-Objective Genetic Programming MFMOG [24]. In another paper [25], the authors combined the MAD index with the other two indices, MS-SSIM and FSIM, by applying the particle swarm optimization (PSO) algorithm.
All these development of combined full-reference quality measures exploited different combination strategies. The main objective of these approaches is to present good evaluation results. Still, the main concern is to find a combination that evaluation in practice all distortions present in image processing.
These works proposed methods to find the best quality combination coefficients and determine the weighting coefficients' optimal values. In some works [10, 14], the proposed approach uses an experimental computation to find the best correlation scores. Others [21, 22, 24] have opted for the genetic algorithm-based approach for optimizing the correlation scores. On the other hand, Lukin et al. [20] and Jiang et al. [26] used a neural network approach. In terms of optimized methods, Liu et al. compared the use of the sequential forward method selection (SFMS) and the most significant index ranking difference (BIRD) methods to optimize the multi-metric fusion [27].
To transform this idea into a mathematically valid problem, we define a cost function relating to the performance criteria of quality, as being a minimization goal. As a statistical approach, we deal with the problem of determining the optimal variables capable of maximizing or minimizing the performance function associated with a certain probability distribution. The Monte Carlo optimization method is one of the most methods that have been developed to overcome the multiple-minima problem [28, 29].
3.1 Metric fusion concept
The objective of combined metric IQA is to produce objective scores consistent with human ones and provide better results to contribute to the multi-measure approach. Several ways and concepts combining image quality metrics have been proposed presenting different models in metrics combination [10, 11, 21]. These models use mathematic functions approach, rules decision techniques, clustering, neural networks, or other learning techniques. With the mathematic model, there are two forms for this combination:
The weighted additive approach that takes the global measure as an average of all used Qi metrics using a weighted sum like in Eq. (1):
$Q=\sum_{i=1}^{n} p_{i} \cdot Q_{i}=p_{1} \cdot Q_{1}+p_{2} \cdot Q_{2}+\cdots+p_{n} \cdot Q_{n}$ (1)
The weighted multiplicative approach that calculates the multiplication of different Qi metrics of which is associated with a combined weight, Eq. (2):
$Q=\prod_{i=1}^{n} Q_{i}^{p_{i}}=Q_{1}^{p_{1}} \times Q_{2}^{p_{2}} \times \ldots \times Q_{n}^{p_{n}}$ (2)
where, p={p_1,p_2,p_3,…,p_n } is the vector of weights combination that is optimized to have a better form of combination and Q_i.represents the quality metrics.
In our study, we focus the choice a combined three ways to evaluate the quality in the compressed images; (1) the structural-based evaluation with the (MS-SSIM) metric, (2) the textural-based evaluation using an image texture quality metric (ITQ), and (3) the edge-based quality evaluation by exploiting an edge image quality metric (EdgeIQA).
The most important quality metric in image quality assessment that evaluates the structural quality is the Multiscale Structural Similarity (MS-SSIM) proposed by Wang et al. [30]. This metric is an ameliorate case of the SSIM exploiting the brightness, contrast, and structure. Based on SSIM, it repeats iteratively repeated to M scales by applying a low-pass filter and a down-sampling by a factor of 2. This metric is presented by the following formula [30]:
$M S-\operatorname{SSIM}\left(X_{0}, X_{c}\right)=\frac{1}{M} \sum_{k=1}^{M} \operatorname{SSIM}\left(X_{0}^{(k)}, X_{c}^{(k)}\right)$ (3)
With $X_{0}^{(k)}$ and $X_{c}^{(k)}$ are respectively the original and the compressed images in a considered (k) scale.
The SSIM parameter is a single scale similarity index calculated by a combined comparison of the properties of brightness, contrast, and structure information between pair of vectors x and y of compared images:
SSIM(x,y)=l(x,y)×c(x,y)×s(x,y) (4)
In a second way, and to understand the compressed image textural quality, we use a proposed image quality that uses the Gray Level Co-Occurrence Matrix (GLCM) textural features [31]. This parameter estimates properties of images relating to second-order statistics measuring the probability of appearance of pairs of pixel values located at a distance in the image using Contrast, Correlation, Energy, Entropy, and Homogeneity. The following equation defines the final image texture quality (ITQ) for five features with the feature index i={Cont,Corr,Ener,Homo,Entr}:
$I T Q=\sum_{i} a_{i} \times I T Q_{F(i)}$ (5)
With $\sum_{i} a_{i}=1$ and the value of the $I T Q_{F(i)}$ parameter calculates the feature quality by:
$I T Q_{F(i)}=1-\frac{\left|F(i)_{X_{0}}-F(i)_{X_{c}}\right|}{F(i)_{X_{0}}}$ (6)
where, $F(i)_{X_{0}}$ represents the ith textural feature for the original image and $F(i)_{X_{C}}$ for the compressed image.
In a third way and to improve the compression algorithm's efficiency, we evaluate the edge degradation in a compressed image by using another proposed texture-based quality. This parameter compares the obtained binary edge images $E_{\text {org }}^{(t h)}$ and $E_{\text {comp }}^{(\text {th })}$ corresponding respectively to the original and compressed images. These edges are determined by a Canny detection technique [32] with an optimal calculation of the threshold by the grayscale histogram of the image's gradient [33].
This quality calculate the normalized common edges between $E_{\text {org }}^{(t h)} \text { and } E_{\text {comp }}^{(\text {th })}$ with the following formula using the sum of the edge points preserved in the compressed image compared to the edge points in the original image:
$E d g e I Q A=\frac{\sum\left(E_{\text {comp }} \cap E_{\text {org }}\right)}{\sum E_{\text {org }}}$ (7)
With these selected indices and conform to the combination concepts, we propose a combined metric by mathematical Eq. (1) applied on images chosen as shown in the next section. With this model, our proposed textural combined quality form is in the following equation:
$T C Q=\alpha \times M S_{-} S S I M+\beta \times I T Q+\gamma \times E d g e I Q A$ (8)
With α, β and γ<1 are weighted coefficients for the summed combination and as a condition α+β+γ=1.
According to the previous formulas, we obtain the combined quality scores that should return quality scores that are consistent with the human subjective evaluation and evaluate image quality in structural similarity, textural evaluation, and edge conservation. To find the best combination weights, we consider this problem as an optimization approach allowing us to find the weights coefficients to give the best correlation between the calculated objective scores and subjective scores. We use specific benchmark database images that contain reference images and some corresponding distorted equivalents with subjective human scores provided by mean opinion scores values (MOS or DMOS), according to the recommendation of the ITU Video Quality Experts Group (VQEG) [34]. These scores are calculated after a non-linear mapping between the vector of objective scores S ̂, and MOS or DMOS, denoted by S representing the subjective scores.
To do this, the Root Mean Square Error (RMSE) between the objective and subjective vectors is calculated by the following formula:
$R M S E\left(\hat{S}_{m}, S\right)=\sqrt{\frac{\left(\hat{S}_{m}-S\right)^{T}\left(\hat{S}_{m}-S\right)}{m}}$ (9)
With $\hat{S}_{m}$ is the non-linearly mapped S ̂.
Considering $d_{i}$ is the difference between the $i^{t h}$ image in S ̂ and S, in a total number of m images, the Spearman rank-order correlation coefficient (SROOC) is a normalized coefficient [-1,1], defined as:
$\operatorname{SROOC}(\hat{S}, S)=1-\frac{6 \sum_{i=1}^{N} d_{i}^{2}}{m\left(m^{2}-1\right)}$ (10)
The other used coefficient called Kendall’s rank correlation coefficient (KRCC) [-1,1], is defined as:
$\operatorname{KRCC}(\hat{S}, S)=\frac{n_{c}-n_{d}}{(n-1) \times \frac{n}{2}}$ (11)
With nc and nd represent respectively the number of concordant and discordant pairs of the n observations between the S ̂ and S vectors.
Table 1. The used public IQA databases in this study
|
Dataset |
Year |
Ref. images |
Test images |
Res. |
Dist. Types |
Dist. levels |
|
TID2008 |
2008 |
25 |
1700 |
512×384 |
17 |
4 |
|
CSIQ |
2010 |
30 |
866 |
512×512 |
6 |
4-5 |
|
TID2013 |
2013 |
25 |
3000 |
512×384 |
24 |
5 |
|
KADID-10k |
2019 |
81 |
10,125 |
512×384 |
25 |
5 |
|
All Dataset |
/ |
161 |
15,691 |
/ |
6-25 |
4-5 |
Besides, another normalized coefficient called Pearson linear correlation coefficient (PLCC) values is as:
$\operatorname{PLCC}\left(\hat{S}_{m}, S\right)=\frac{\overline{\hat{S}}_{m}^{T} \bar{S}}{\sqrt{\hat{S}_{m}^{T} \bar{S}_{m} \bar{S}^{T} \bar{S}}}$ (12)
However, we note that the basic problem concerns the optimization approach by finding the best combination coefficients (in our case α, β, and γ), The objective of the optimization algorithms is to find the best weights combination able to minimize the RMSE and maximize the SROOC, the KRCC, and the PLCC correlation values. Some studies compared the evaluation of the efficacy of correlation methods PLCC, SROOC, and KRCC. Based on these works, we choose the use of the Pearson linear correlation coefficient (PLCC) as the best approach for the optimization problem [35-37].
3.2 Our optimized fusion model
In our optimization case, we opt for two computation approaches. The first one uses an experimental approach by recursive calculation of all possible coefficient combinations and find the optimal weighting values for the quality correlation factor. Each coefficient is varied from 0 to 1 with a step equal to 0.01, to take all possible combinations satisfying the condition α+β+γ=1. With this recursive method, we can calculate the values of $T C Q_{B F}$ corresponding to Eq. (8). This technique, called the brute force method, presents a critical problem that scales exponentially with the number of scores.
Our second case uses the Monte Carlo (MC) optimization method [28, 29] with an oriented approach to finding the best weight coefficients. This method approximates the weighted fusion of the quality by considering the problem as follows:
$\max _{\alpha, \beta, \gamma} P L C C\left(\hat{S}_{m}, S\right)$ (13)
With the oriented constraint conditions expressed as:
$\left\{\begin{array}{l}\alpha+\beta+\gamma=1 \\\alpha, \beta, \gamma<1\end{array}\right.$ (14)
The basic concept of this algorithm, as shown in Figure 1, is generating random vectors α and β in a considered interval and calculate the γ value conforming to Eq. (12). The next step is the calculation of the objective quality values using vectors (α,β,γ) and determining the correlation vector between subjective and objective qualities. Finally, we determinate the weight coefficients that satisfy the maximum of the PLCC correlation. To enable calculus of the weight coefficients, we propose the use of four benchmark IQA databases, Table 1; Categorical Subjective Image Quality database (CSIQ) [38], Tampere Image Database 2008 and 2013 (TID2008) [39], (TID2013) [40], and the Konstanz Artificially Distorted Image quality Database (KADID-10k) [41].
The TID2008 database that contains 1700 distorted images generated from 25 reference images, with 4 level distortions from 17 distortion types [39]. In the TID2013 database, an ameliorate version of TID2008, containing 24 distortion types to produce 3000 test images from 25 reference images [40]. The CSIQ database with a total of 866 distorted images compared to 30 reference ones generated by 6 distortion types [38]. Finally, the KADID-10k database contains 10125 test images generated from 81 reference images, within a total of 25 types of distortions, grouped into 8 distortions classes, namely blurs, compression, noise-related, brightness changes, spatial distortions, sharpness, and contrast [41].
Figure 1. The Monte Carlo optimization algorithm
As a first proposition, we can opt for the choice of a mean combination by the use of weights $\alpha=\beta=\gamma=1 / 3$ to calculate the $T C Q_{M N}$ quality. When using the brute force algorithms, we find the best correlation with $\alpha=0.13, \beta=0.10 \text { and } \gamma=0.77$. Finally and when we use the Monte Carlo optimization with N=50000 points, the optimal weight coefficients are $\alpha=0.45, \beta=0.15 \text { and } \gamma=0.4$. Table 2 shows the obtained coefficients $\alpha, \beta, \text { and } \gamma$ .
The following Table 3 presents the results of our proposed metric's efficiency compared to some classical image quality metrics presenting acceptable results. We observe clearly the acceptable correlation with the combined metric $T C Q_{O P T}$, calculated by Monte Carlo method, compared to $T C Q_{M N}$ and $T C Q_{B F}$, calculated respectively by mean summation coefficients and the brute force algorithm.
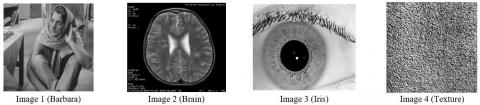
To apply and use our proposed combined metric compared to the elementary chosen qualities, we present an experiments investigation to give a numerical evaluation of the compression effect on four kinds of images. These images show different textural structures, Figure 2. So we use the most used natural image called Barbara test image (named Image 1), a medical image (named Image 2) representing a Brain axial slice MRI [42], a biometric Iris image (named Image 3) taken from the ITTD iris database [43] and a Brodatz textural image (named Image 4) from the multiband texture (MBT) database [44].
To study the compression degradation on these images, we chose three wavelet-based compression algorithms. The lifting Wavelet transforms with the SPIHT encoder (LWT-SPIHT), the quincunx wavelet transforms with the SPIHT encoder (QWT-SPIHT), and the JPEG2000 standard image compression that uses Wavelet transform with EBCOT encoder.
Table 2. The obtained weight coefficients
|
|
Dataset |
$\alpha$ |
$\boldsymbol{\beta}$ |
$\gamma$ |
|
$T C Q_{M N}$ |
All Dataset |
0.3333 |
0.3333 |
0.3333 |
|
$T C Q_{B F}$ |
All Dataset |
0.4300 |
0.1500 |
0.4200 |
|
$\text { TCQ }_{O P T}$ |
TID2008 |
0.8934 |
0.0012 |
0.1054 |
|
CSIQ |
0.6869 |
0.0014 |
0.3117 |
|
|
TID2013 |
0.9683 |
0.0014 |
0.0303 |
|
|
KADID-10k |
0.9332 |
0.0011 |
0.0656 |
|
|
All Dataset |
0.5474 |
0.1350 |
0.3172 |
Figure 2. The original used images
Table 3. Correlation comparisons for our calculated combined quality
|
Dataset |
Coef. |
PSNR |
MS-SSIM |
ITQ |
EdgeIQA |
TCQMN |
TCQBF |
TCQOPT |
|
TID2008 |
PLCC |
0.5734 |
0.8451 |
0.7287 |
0.7575 |
0.6412 |
0.7436 |
0.7504 |
|
SROOC |
0.5531 |
0.8542 |
0.4925 |
0.6968 |
0.6201 |
0.7170 |
0.7319 |
|
|
KRCC |
0.4027 |
0.6568 |
0.4656 |
0.5174 |
0.4416 |
0.5289 |
0.5400 |
|
|
RMSE |
1.0994 |
0.7173 |
1.1124 |
0.8761 |
1.0296 |
0.8972 |
0.8868 |
|
|
CSIQ |
PLCC |
0.7956 |
0.8991 |
0.6353 |
0.8553 |
0.8230 |
0.8829 |
0.8828 |
|
SROOC |
0.8085 |
0.9133 |
0.6569 |
0.8197 |
0.8362 |
0.8953 |
0.8953 |
|
|
KRCC |
0.6084 |
0.7393 |
0.5591 |
0.6335 |
0.6340 |
0.7102 |
0.7101 |
|
|
RMSE |
0.1575 |
0.1149 |
0.2028 |
0.1360 |
0.1490 |
0.1232 |
0.1233 |
|
|
TID2013 |
PLCC |
0.7602 |
0.8329 |
0.5223 |
0.7204 |
0.6929 |
0.7526 |
0.7598 |
|
SROOC |
0.6865 |
0.7860 |
0.5409 |
0.6099 |
0.6168 |
0.6689 |
0.6839 |
|
|
KRCC |
0.5043 |
0.6049 |
0.5012 |
0.4444 |
0.4435 |
0.4924 |
0.5042 |
|
|
RMSE |
0.8976 |
0.6861 |
1.0071 |
0.8598 |
0.8937 |
0.8161 |
0.8059 |
|
|
KADID-10k |
PLCC |
0.6401 |
0.8286 |
0.6467 |
0.6724 |
0.6473 |
0.7158 |
0.7319 |
|
SROOC |
0.6319 |
0.8308 |
0.6563 |
0.6640 |
0.6483 |
0.7149 |
0.7322 |
|
|
KRCC |
0.4555 |
0.6409 |
0.5145 |
0.4876 |
0.4694 |
0.5309 |
0.5463 |
|
|
RMSE |
0.1663 |
0.1212 |
0.1937 |
0.1603 |
0.1650 |
0.1511 |
0.1475 |
|
|
All Dataset |
PLCC |
0.6482 |
0.7555 |
0.6861 |
0.6429 |
0.6853 |
0.7405 |
0.7473 |
|
SROOC |
0.5352 |
0.6526 |
0.5817 |
0.5937 |
0.4901 |
0.6865 |
0.6599 |
|
|
KRCC |
0.5000 |
0.5188 |
0.5389 |
0.4963 |
0.5096 |
0.6838 |
0.6072 |
|
|
RMSE |
2.5830 |
1.9041 |
1.7277 |
1.7152 |
1.7233 |
0.8673 |
0.7063 |
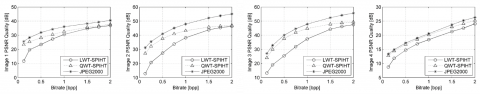
Figure 3. Evaluation of PSNR of the compressed images
Figure 4. Evaluation of MS-SSIM of the compressed images
Figure 5. Evaluation of textural quality of the compressed images
Figure 6. Evaluation of the edge conservation in the compressed images
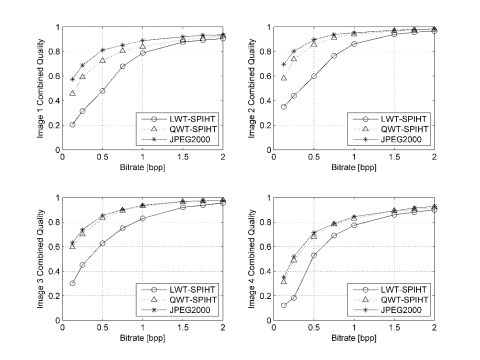
Figure 7. Combined quality evaluation of the compressed images
A first analysis of the structural degradation can be shown in Figure 3 by the use of the PSNR quality. We can observe an acceptable quality for the JPEG200 and the QWT-SPIHT compression compared to the LWT-SPIHT, especially in low bitrates (< 1.0 bpp). In image 4 (texture image), a high degradation is caused by all compression algorithms, including an energy degradation in pixels structure caused by the high texture composition of this image.
The same ascertainment is observed with the MS-SSIM evaluation, in Figure 4, with a conserved structural similarity for all images with JPEG2000 and QWT-SPIHT (> 0.25 bpp) and with LWT-SPIHT (> 0.75 bpp). This means that the brightness, the contrast, and the structure composition are generally conserved in the compressed images.
When using a textural and edge quality analysis, we can observe that in texture conservation properties, Figure 5, image 1 (Barbara), image 2 (Brain), and image 3 (Iris) preserve their textural quality with the JPEG2000 and QWT-SPIHT algorithms, but with the LWT-SPIHT, these qualities are conserved when the bitrate is > 0.5 bpp. In image 4 (Texture), the textural qualities are affected with all compression algorithms. The edge structure for all images, in Figure 6, is conserved with bitrates > 0.5 bpp with the best conservation in JPEG2000 compared to the others.
Finally, when we us Figure 7e our proposed quality, as in Figure 7, we can observe that the JPEG2000 and the QWT-SPIHT present good quality in images 1, 2, and 3 for all bitrates. But in image 4, the quality is acceptable only when the bitrate is > 0.5 bpp. The LWT-SPIHT presents an acceptable quality with bitrates > 0.75 for all images.
These remarks confirm our proposed combined quality metric's good coherence to evaluate compressed images in three ways; structural analysis, textural evaluation, and edge performance. The accepted quality values are observed, especially for the JPEG2000 and the QWT-SPIHT compression techniques for the four kinds of images compared to the LWT-SPIHT technique.
In this work, we proposed a new form of quality analyzing degradation in compressed images. It's based on the fusion of three quality forms; (1) the structural quality based on the structure similarity (MS-SSIM), (2) the texture-based quality based on the use of a GLCM textural image evaluation metric named (ITQ), and (3) the edge-based quality that use an edge image evaluation metric named EdgeIQA based on Canny edge conservation. This fusion is based on the weighted linear combination model. This proposed metric presents a good evaluation with four chosen databases (TID2008, CSIQ, TID2013, and KADID-10k).
The numerical experiment results investigate some wavelet-based compression algorithms coupled with SPIHT compared to the JPEG2000 standard compression. These results confirmed that the JPEG2000 and the Quincunx-based algorithm associated with SPIHT (QWT-SPIHT) related to the lifting Wavelet transform with SPIHT (LWT-SPIHT). We have also used four kinds of images to perform our study; a natural image, a medical image, a biometric image, and a texture image.
As a future perspective, we propose to analyze and study the efficiency of our combined metric according to the types of degradation through benchmark image databases to understand the textural deterioration according to these types of degradations. We suggest also adding a multiscale wavelet approach to allow a deep concept quality evaluation in the spectral-based quality.
This work is funded by the DGRSDT of the Algerian Ministry of Higher Education and Research and it is partly supported by the University Research-Training Projects (PRFU) agreement N° A25N01UN080120180002. Finally, the authors of this work thank the anonymous reviewers for their careful reading and their insightful comments and suggestions.
[1] Jayasankar, U., Thirumal, V., Ponnurangam, D. (2018). A survey on data compression techniques: From the perspective of data quality, coding schemes, data type, and applications. Journal of King Saud University - Computer and Information Sciences, 33(2): 119-140. https://doi.org/10.1016/j.jksuci.2018.05.006
[2] Asthana, S., Goyal, D., Pandit, A., Bhujade, R. (2018). An extensive survey on compression algorithm for effective image compression. Proceedings of 3rd International Conference on Internet of Things and Connected Technologies (ICIoTCT), 2018 held at Malaviya National Institute of Technology, Jaipur (India). https://doi.org/10.2139/ssrn.3170761
[3] Setyaningsih, E., Harjoko, A. (2017). Survey of hybrid image compression techniques. International Journal of Electrical and Computer Engineering (IJECE), 7(4): 2206-2214. https://doi.org/10.11591/ijece.v7i4.pp2206-2214
[4] Boujelbene, R., Jemaa, Y.B., Zribi, M. (2019). A comparative study of recent improvements in wavelet-based image coding schemes. Multimedia Tools and Applications, 78(2): 1649-1683. https://doi.org/10.1007/s11042-018-6262-4
[5] Sakuldee, R., Udomhunsakul, S. (2007). Objective performance of compressed image quality assessments. International Journal of Computer and Information Engineering, 1(11): 3423-3432. https://doi.org/10.5281/zenodo.1074731
[6] Mohammadi, P., Ebrahimi-Moghadam, A., Shirani, S. (2014). Subjective and objective quality assessment of image: A survey. arXiv:1406.7799 [cs]. Retrieved from http://arxiv.org/abs/1406.7799
[7] Khosravy, M., Patel, N., Gupta, N., Sethi, I.K. (2019). Image quality assessment: A review to full reference indexes. In Khare, A., Tiwary, U.S., Sethi, I.K., Singh, N., (Eds.), Recent Trends in Communication, Computing, and Electronics, 524: 279-288. https://doi.org/10.1007/978-981-13-2685-1_27
[8] Anju, V.A., Priya, S. (2017). A study on different types of FR IQA classification. International Journal of Innovative Research in Science, Engineering and Technology, 6(5): 46-51.
[9] Phadikar, B.S., Maity, G.K., Phadikar, A. (2018). Full reference image quality assessment: A survey. In Bhattacharyya, S., Sen, S., Dutta, M., Biswas, P., Chattopadhyay, H. (Eds.), Industry Interactive Innovations in Science, Engineering and Technology, 11: 197-208. https://doi.org/10.1007/978-981-10-3953-9_19
[10] Okarma, K. (2010). Combined full-reference image quality metric linearly correlated with subjective assessment. In Rutkowski, L., Scherer, R., Tadeusiewicz, R., Zadeh, L.A., Zurada, J.M. (Eds.), Artificial Intelligence and Soft Computing, 6113: 539-546. https://doi.org/10.1007/978-3-642-13208-7_67
[11] Ieremeiev, O.I., Lukin, V.V., Ponomarenko, N.N., Egiazarian, K.O., Astola, J. (2016). Combined full-reference image visual quality metrics. Electronic Imaging, 2016(15): 1-10. https://doi.org/10.2352/ISSN.2470-1173.2016.15.IPAS-180
[12] Wang, Z., Bovik, A.C., Sheikh, H.R., Simoncelli, E.P. (2004). Image quality assessment: from error visibility to structural similarity. IEEE Transactions on Image Processing, 13(4): 600-612. https://doi.org/10.1109/TIP.2003.819861
[13] Wang, Z., Li, Q. (2011). Information content weighting for perceptual image quality assessment. IEEE Transactions on Image Processing, 20(5): 1185-1198. https://doi.org/10.1109/TIP.2010.2092435
[14] Ishiyama, K., Sugiura, Y., Shimamura, T. (2016). Optimized three scores combination for image quality assessment. 2016 IEEE Asia Pacific Conference on Circuits and Systems (APCCAS), pp. 5-8. https://doi.org/10.1109/APCCAS.2016.7803881
[15] Liu, M., Yang, X. (2008). A new image quality approach based on decision fusion. 2008 Fifth International Conference on Fuzzy Systems and Knowledge Discovery, pp. 10-14. https://doi.org/10.1109/FSKD.2008.469
[16] Okarma, K. (2012). Combined image similarity index. Optical Review, 19(5): 349-354. https://doi.org/10.1007/s10043-012-0055-1
[17] Okarma, K. (2013). Extended hybrid image similarity – combined full-reference image quality metric linearly correlated with subjective scores. Electronics and Electrical Engineering, 19(10): 129-132. https://doi.org/10.5755/j01.eee.19.10.5908
[18] Isono, K., Shimamura, T. (2013). Exponentiated combination of two scores for image quality assessment. 2013 IEEE International Conference of IEEE Region 10 (TENCON 2013), pp. 1-4. https://doi.org/10.1109/TENCON.2013.6719032
[19] Okarma, K. (2014). Mobile video quality assessment: A current challenge for combined metrics. In Silhavy, R., Senkerik, R., Oplatkova, Z.K., Silhavy, P., Prokopova, Z. (Eds.), Modern Trends and Techniques in Computer Science, 285: 485-494. https://doi.org/10.1007/978-3-319-06740-7_41
[20] Lukin, V.V., Ponomarenko, N.N., Ieremeiev, O.I., Egiazarian, K.O., Astola, J. (2015). Combining full-reference image visual quality metrics by neural network. In Rogowitz, B.E., Pappas, T.N., de Ridder, H. (Eds.), (p. 93940K). Presented at the IS&T/SPIE Electronic Imaging, San Francisco, California, United States. https://doi.org/10.1117/12.2085465
[21] Oszust, M. (2016). Decision fusion for image quality assessment using an optimization approach. IEEE Signal Processing Letters, 23(1): 65-69. https://doi.org/10.1109/LSP.2015.2500819
[22] Oszust, M. (2016). Full-reference image quality assessment with linear combination of genetically selected quality measures. PLOS ONE, 11(6): e0158333. https://doi.org/10.1371/journal.pone.0158333
[23] Ieremeiev, O., Lukin, V., Ponomarenko, N., Egiazarian, K. (2018). Robust linearized combined metrics of image visual quality. Electronic Imaging, 2018(13): 260-1-260-6. https://doi.org/10.2352/ISSN.2470-1173.2018.13.IPAS-260
[24] Merzougui, N., Djerou, L. (2017). Multi-measures fusion based on multi-objective genetic programming for full-reference image quality assessment. arXiv:1801.06030 [cs]. Retrieved from https://arxiv.org/ftp/arxiv/papers/1801/1801.06030.pdf.
[25] Khaing, Y., Sugiura, Y., Shimamura, T. (2019). Combination of dissimilar feature scores for image quality assessment using particle swarm optimization algorithm. Journal of Signal Processing, 23(5): 205-214. https://doi.org/10.2299/jsp.23.205
[26] Jiang, X., Shen, L., Feng, G., Yu, L., An, P. (2019). Deep optimization model for screen content image quality assessment using neural networks. arXiv:1903.00705 [cs]. Retrieved from http://arxiv.org/abs/1903.00705
[27] Liu, T.J., Lin, W., Kuo, C.C.J. (2013). Image quality assessment using multi-method fusion. IEEE Transactions on Image Processing, 22(5): 1793-1807. https://doi.org/10.1109/TIP.2012.2236343
[28] Chou, C.I., Han, R.S., Lee, T.K., Li, S.P. (2003). A guided Monte Carlo approach to optimization problems. in intelligent data engineering and automated learning. Presented at the International Conference on Intelligent Data Engineering and Automated Learning, Springer, Berlin, Heidelberg, pp. 447-451. https://doi.org/10.1007/978-3-540-45080-1_60
[29] Robert, C.P., Casella, G. (2011). Optimisation par les méthodes de Monte-Carlo. In Méthodes de Monte-Carlo avec R. Paris: Springer Paris, pp. 99-139. https://doi.org/10.1007/978-2-8178-0181-0_5
[30] Wang, Z., Simoncelli, E.P., Bovik, A.C. (2003). Multiscale structural similarity for image quality assessment. In the Thirty-Seventh Asilomar Conference on Signals, Systems & Computers, pp. 1398-1402. https://doi.org/10.1109/ACSSC.2003.1292216
[31] Bouida, A., Beladgham, M., Bassou, A., Benyahia, I. (2020). Quality and texture analysis of biometric images compressed with second-generation wavelet transforms and SPIHT-Z encoder. Indonesian Journal of Electrical Engineering and Computer Science, 19(3): 1325-1339. https://doi.org/10.11591/ijeecs.v19.i3.pp1325-1339
[32] Canny, J. (1986). A computational approach to edge detection. IEEE Transactions on Pattern Analysis and Machine Intelligence, PAMI-8(6): 679-698. https://doi.org/10.1109/TPAMI.1986.4767851
[33] Jiang, W., Li, F., Xu, D. (2019). An improved canny operator in the application of medical image segmentation. In Proceedings of the 3rd International Conference on Computer Science and Application Engineering, Sanya, China: Association for Computing Machinery, pp. 1-5. https://doi.org/10.1145/3331453.3360978
[34] Video Quality Expert Group (VQEG). (2003). Final Report from the Video Quality Experts Group on the Validation of Objective Models of Video Quality Assessment II. Retrieved from http://www.vqeg.org, accessed on 22 Jan. 2020.
[35] Chok, N.S. (2010). Pearson’s versus Spearman’s and Kendall’s correlation coefficients for continuous data. PhD Thesis. University of Pittsburgh.
[36] Hauke, J., Kossowski, T. (2011). Comparison of values of Pearson’s and Spearman’s correlation coefficients on the same sets of data. Quaestiones Geographicae, 30(2): 87-93.
[37] Puth, M.T., Neuhäuser, M., Ruxton, G.D. (2015). Effective use of Spearman’s and Kendall’s correlation coefficients for association between two measured traits. Animal Behaviour, 102: 77-84. https://doi.org/10.1016/j.anbehav.2015.01.010
[38] Chandler, D.M. (2010). Most apparent distortion: Full-reference image quality assessment and the role of strategy. Journal of Electronic Imaging, 19(1): 011006. https://doi.org/10.1117/1.3267105
[39] Ponomarenko, N., Lukin, V., Zelensky, A., Egiazarian, K., Carli, M., Battisti, F. (2009). TID2008 - A database for evaluation of full-reference visual quality assessment metrics. Advances of Modern Radioelectronics, 10: 30-45.
[40] Ponomarenko, N., Ieremeiev, O., Lukin, V., Jin, L., Egiazarian, K., Astola, J., Vozel, B., Chehdi K., Carli, M., Battisti, F., Kuo, C.C.J. (2013). A new color image database TID2013: Innovations and results. In Blanc-Talon, J., Kasinski, A., Philips, W., Popescu, D., Scheunders, P. (Eds.), Advanced Concepts for Intelligent Vision Systems (pp. 402–413). Cham: Springer International Publishing. https://doi.org/10.1007/978-3-319-02895-8_36
[41] Lin, H., Hosu, V., Saupe, D. (2019). KADID-10k: A large-scale artificially distorted IQA database. In 2019 Eleventh International Conference on Quality of Multimedia Experience (QoMEX), pp. 1-3. https://doi.org/10.1109/QoMEX.2019.8743252
[42] Medical Images Databases. (n.d.). Retrieved from https://www.gehealthcare.com/, accessed on 22 Jan. 2020.
[43] Kumar, A., Passi, A. (2010). Comparison and combination of iris matchers for reliable personal authentication. Pattern Recognition, 43(3): 1016-1026. https://doi.org/10.1016/j.patcog.2009.08.016
[44] Abdelmounaime, S., He, D.C. (2013). New Brodatz-based image databases for grayscale color and multiband texture analysis. ISRN Machine Vision, 2013: 1-14. https://doi.org/10.1155/2013/876386