Süleyman Burçin Şüyun* | Şakir Taşdemir | Serkan Biliş | Alexandru Milea
© 2021 IIETA. This article is published by IIETA and is licensed under the CC BY 4.0 license (http://creativecommons.org/licenses/by/4.0/).
OPEN ACCESS
Range throughout Turkey in this paper, the author trained the continuous neural networks, and used a total of 4,000 fundus images, including images with different degrees of fundus disorders and images without disorders, so that CNN can detect whether the patient has hypertension and arteriosclerosis according to macular degeneration in the fundus images. In order to obtain more effective results from the deep learning structure using convolutional neural network, this paper prepared more data sets on the basis of Turkey, combined with the local data sets to educate the deep learning model, so as to integrate the data globally, which can help standardize the results and improve the accuracy. The system is used to diagnose retinal vascular degeneration, such as fundus vascular disease and macular edema disease. Based on this basic understanding, the research has been used for the detection and classification of hypertensive retinopathy that has similar causes. The author also points out the limitations of the system. Among them, the most important limitation is the need for long-term financial sustainability.
hypertensive retinopathy, convolutional neural networks, deep learning, fundus images, eye diseases, macular degeneration
In previous studies, the analyses were conducted with data sets which were prepared using the data of individual participants. For example, many studies based on retina diagnosis were conducted on the basis of the images of diabetic or non-diabetic patients among the general population [1, 2]. A systematic literature survey was conducted for this and similar studies. In the studies, deep learning algorithms on problems such as vascular disorders, diabetic retina, and macular edema disorders were encountered [1-9].
The most efficient deep learning algorithms were developed with the data sets obtained in these studies. Deep learning enables the calculation models consisting of multiple process layers to learn the representations of the data having multiple generalization levels. These methods significantly improved the state-of-the-art technology in various fields such as speech recognition, visual object recognition, object detection, drug discovery, and genomics. Deep learning discovers the complex structure of the large data sets by using the back-propagation algorithm in order to define how a machine should replace its intrinsic parameters, which are used to calculate the representation on each layer, with the representation on the previous layer. While deep neural networks lead to a breakthrough in image, video, speech, and sound processing, recurrent networks shed light on the sequential data such as text and speech [9].
Convolutional neural networks (CNNs) consist of multi-layered sensor variants inspired by flexible and biological facts which proved to be extremely suitable for discriminatory vision functions. Moreover, various studies on bringing suitable transformations that utilize the general data of target classes and on the possibility of making them more efficient and more accurate are going on. We display this functionality through pre-classification with the fast and solid, but loose segmentation of the input images in order to get a series of candidate objects. These objects then spatially transform to a reduced space, but preserve a compact high-level representation of their images. Additional features can be abstracted as the raw features which are included after the convolution process of the network. Lastly, we compare the performance to the existing approaches in the challenging problem in detecting the lesions on retinal images [10].
A specific type of neural network, named as convolutional neural network and optimized for image classification, was educated by using a retrospective development data set of the retinal image, graded for 3-7 times, for the image grading of diabetic retinopathy and diabetic macular edema [11].
Despite being one of the leading causes of blindness, some of the eye disorders can be prevented globally. Performing a retina screening examination in all diabetic patients is an unmet need, and there are many vision disorder cases that have not been diagnosed and treated [12]. The purpose of this study is to develop a solid diagnosis technology in order to automatize the screening of Hypertensive Angiopathy; to screen the disorder in the images of every patient regardless of the existence or non-existence of Hypertensive Angiopathy problem thanks to the architecture Deep Learning System; to educate the deep learning data set for identify if there is angiopathic eye disease that threatens the vision and classifying it; and as a result, to verify the system through prognosis with new samples. A data set, classified by collecting and arranging the fundus images obtained from the patients, who were examined in the hospital on that date, regardless of their age, gender, complaint, etc. data, was created.
This study was approved by the corporate institution in which it was conducted. The Fundus Images, which were classified to be recognized by the deep learning algorithms, were subjected to a performance through a system and the data on race/ethnicity were collected for review purpose. Images obtained from the patients are random retina images. This study uses the data of all patients with or without any complaints of Hypertensive Angiopathy.
2.1 Preparing the data set for training the deep learning system
After the Deep Learning System was built, the system was educated by using the fundus images of the patients with or without Hypertensive Angiopathy. For the data set to be created for training the system, the HD-OCT imaging device, which is used for Optic Tomography imaging in a private eye clinic that has been in service in Izmir since 2004, was utilized. The data set was created by the qualified personnel by generating and storing the images of patients who visited the hospital due to any vision disorders.
This team consisting of educated professionals captured 2 retina images (for right and left eyes) or 1 retina image, if just one eye was problematic, of each patient regardless of age and gender during their own working hours. Then, each retina image was analyzed by 4 specialized physicians, and asked to be distributed based on 4 classification categories. During the classification process, no consensus was reached for 267 images out of 4,000 images, therefore, the physicians were asked to replace the images with the new ones. However, the physicians requested to reanalyze the remaining images instead of generating new eye images; thus, data set folders with very close ranges could be created. For classification process, online applications where the doctors could work in teams were used.
Based on the images in similar studies, especially diabetic vision disorders, Macula Degeneration, and other retina disorders, the systems were educated with the support of clinical studies to observe the results [13-30].
2.2 Deep learning architecture
Deep learning architecture consists of a coevolutionary neural network. In order to build a model designation or machine learning system through traditional machine learning techniques, first, the feature vector must be issued. Acknowledged experts are needed to issue the feature vector. These processes take much time and keep the expert very busy.
The developed techniques cannot process a raw data without any pre-treatment as well as the help of an expert. Deep Learning made a significant progress by eliminating this problem which those who work in the field of machine learning have dealt with for long years. Because deep networks process learning on raw data unlike the traditional machine learning and image processing techniques. When processing the raw data, it obtains the necessary information through the representations on different layers. Convolution, Pooling, ReLu, DropOut, Fully Connected and Classification Layer, which are the layers of Convolutional Neural Network (CNN) architecture, were explained. Moreover, AlexNet, ZFNet, GoogLeNet, Microsoft RestNet, and R-CNN architectures, which can be acknowledged as the fundamental architectures of Deep Learning, were mentioned [31].
The architectures created through suitable methods for deep learning are utilized in cancer diagnosis, gene selection and classification, gene variety, drug design, compound protein interaction, RNA-protein relationship, and bioinformatics applications such as DNA methylation [32].
Deep learning is a sub-set of machine learning. Deep learning models are built by using artificial neural networks.
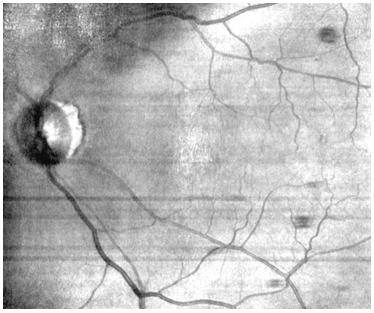
A neural network gets input values to be educated with the weight values set during the training on hidden layers. One of the inputs obtained in the developed application is shown in Figure 1.
Figure 1. Fundus image used for input process
After the training is complete, it makes a prediction from the new input value to be entered in the model. The weights in the hidden layer are renewed through training back propagation method in order to make a better prognosis and to improve the success of the model.
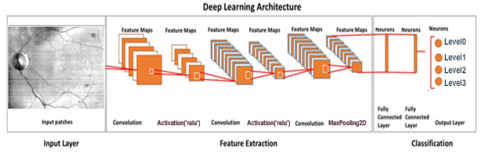
The type of model which we will use is “sequential”. In sequential type, models are one of the easiest ways of building an architecture. It allows for building a model with sequential layers. Some of the sequential layers used for building the model are shown in Table 1 and Figure 2.
Table 1. Layers and size in deep learning architecture in the study
|
Layers |
Output Size |
|
Convolution |
48 × 48 |
|
Batch Normalization |
48 × 48 |
|
ReLU |
48 × 48 |
|
Convolution |
48 × 48 |
|
Batch Normalization |
48 × 48 |
|
ReLU |
48 × 48 |
|
Max Pooling |
24 x 24 |
|
Convolution |
24 x 24 |
|
Batch Normalization |
24 x 24 |
|
ReLU |
24 x 24 |
|
Max Pooling |
12 × 12 |
|
Max Unpooling |
24 × 24 |
|
Convolution |
24 × 24 |
|
Batch Normalization |
24 × 24 |
|
ReLU |
24 × 24 |
|
Convolution |
24 × 24 |
|
Batch Normalization |
24 × 24 |
|
ReLU |
24 × 24 |
|
Max Unpooling |
48 × 48 |
|
Batch Normalization |
48 × 48 |
|
ReLU |
48 × 48 |
|
Softmax |
48 × 48 |
|
Classification |
48 × 48 |
Figure 2. Layers in deep learning architecture in the study
When it is required to add two hidden layers and one output layer after an input, ‘Dense’ layer type is used. Dense is a standard type of layer that works in most situations. In a dense layer, all the nodes from the previous layer are tied to the nodes in the current layer. The images of some layers are shown in Figure 3.
Figure 3. Images of some layers
There may be hundreds or thousands of neurons in a layer. Increasing the number of nodes in each layer also increases the model capacity as well as the training duration and disc footprint of the model, and this is an unfavorable situation. Therefore, optimum number of neurons and hidden layers should be found. It is not possible to give an exact information on how many hidden layers there will be.
The activation function which we will use is ReLU or Rectified Linear Activation. The function of this activation takes the negative values as zero, and the positive values as they are. The model also includes functions such as MaxPooling, Batch normalization and Dropout.
The convolution layer convolves either an input image or the outputs of the previous activation maps. The weights learn the local features by scanning throughout the width and height of an image. Let $x^{l-1}(m)$ be the m th input activation map at the layer $l-1, W^{l}(m, n)$ be the weights of filter connects n th activation of the output layer to mth activation of the input layer and $b^{l}(n)$ be regarded as the trainable bias parameter. The activation $x^{l}(n)$ in the lth convolution layer is expressed by Eqns. (1) and (2):
$x^{l}(n)=f\left(\sum_{m}\left(x^{l-1}(m) * W^{l}(m, n)+b^{l}(n)\right)\right)$ (1)
$f(x)=\frac{1}{1+e^{-x}}$ (2)
where, * is the two-dimensional discrete convolution operator and f is the non-linear sigmoid function. The weights are initialized randomly and then updated with a back propagation algorithm in each iteration, insofar as the learning rate. The batch normalization layer normalizes the distribution of activations considering zero mean and standard deviation in each hidden layer for the current mini-batch during the training procedure. The forward propagation of batch normalization is calculated as follows:
$\mu_{B=} \frac{1}{m} \sum_{i=1}^{m} x(i)$ (3)
$\sigma_{B}^{2}=\frac{1}{m} \sum_{l=1}^{m}\left(\mathrm{x}(\mathrm{i})-\mu_{B}\right)^{2}$ (4)
$\hat{x}(l)=\frac{x(i)-\mu_{B}}{\sqrt{\sigma_{B}^{2}-\epsilon}}$ (5)
$y(l)=y \hat{x}(l)+\beta$ (6)
where, $\mu_{B}$ and $\sigma_{B}^{2}$ are the mean and standard deviation of mini-batch x(l), respectively. ^ is the normalized activation. γ and β, named as offset and scale factor, are also learnable parameters that are updated during the network training.
The rectified linear unit (ReLU) layer performs thresholding for each element of the activation input, where any value below zero is set to zero and is defined as follows:
$f(x)=\left\{\begin{array}{lll}x, & \text { for } & x \geq 0 \\ 0, & \text { for } & x<0\end{array}\right.$ (7)
The output of the max-pooling layer gives the maximum activation on non-overlapping rectangular regions to reduce the spatial size of the input activation. It allows the network to have a faster convergence rate by selecting superior invariant features that improve general performance. The max-unpooling layer also unpools the activation maps. A softmax layer produces the probability map from the output of the last ReLU layer using softmax function as follows:
Probability $(\mathrm{y}=1 \mid \mathrm{x} ; \mathrm{W})=\frac{1}{1+e^{-W^{T} X}}$ (8)
where, y and W express the class label and weight. Finally, the pixel classification layer transforms the classification results to the binary image for the pixels in the region of interest (ROI) [33-38].
2.3 Verification of data sets
Data sets are explained in detail in Table 2. The data set prepared for the diagnosis of Hypertensive Angiopathy problem must conduct validation. In other words, the method in use must continuously give what is expected in an accurate and exact way, and the results must be proven and consistent for each observer. Validation process involves all the processes that must be conducted for consistency.
Since the private clinic, from which the data were taken, has other branches in Europe, Asia, and mainly Central Asia, and since some operations could be performed only in Izmir, not all the patients, whose data were obtained, are from Turkey. Therefore, when generating the data, an ethnic spectrum was created even if low percentages.
The data of the patients were obtained and arranged based on the hospital visiting order regardless of the age, gender, and problem. Since some patients had a problem with only one eye, the image of a single eye was taken and classified.
Table 2. Details of data set
|
Race/ Ethnicity |
Image Taken by |
Reviewed by |
Number of Images |
Number of Eyes |
Number of Patients |
|
%100 Turkey |
A |
W,X,Y,Z |
400 |
200 |
193 |
|
%96 Turkey, %2 Iraq, %2 Iran |
B |
W,X,Y,Z |
386 |
193 |
189 |
|
%98 Turkey, %2 Iran |
A |
W,X,Y,Z |
400 |
200 |
194 |
|
%98 Turkey, %2 Ukraine |
B |
W,X,Y,Z |
360 |
180 |
181 |
|
%96 Turkey, %4 Germany |
A |
W,X,Y,Z |
382 |
191 |
186 |
|
%96 Turkey, %2 Iraq, %2 Syria |
A |
W,X,Y,Z |
380 |
190 |
186 |
|
%100 Turkey |
B |
W,X,Y,Z |
390 |
195 |
188 |
|
%96 Turkey, %4 Germany |
A |
W,X,Y,Z |
386 |
193 |
189 |
|
%98 Turkey, %2 Iraq |
B |
W,X,Y,Z |
400 |
200 |
190 |
|
%100 Turkey |
A |
W,X,Y,Z |
404 |
202 |
191 |
|
%98 Turkey, %2 Iraq |
B |
W,X,Y,Z |
122 |
61 |
145 |
|
%100 Turkey |
A |
W,X,Y,Z |
400 |
200 |
192 |
Those who are specified as A and B in Table 2 are healthcare providers. Both employees are nurses who have been working in this industry for more than 15 years. They are specialized and competent individuals.
All the retinal images are in 937x781 dimensions and compressed JPEG format. The image size varies under 100Kb and the images are greyscale.
With the decision number 2020/361, Selçuk University Local Ethics Board has permitted to use the data which were obtained from Batı Göz Hospital, in this study for the engineering approaches.
2.4 Training, experience, and ways of working of classification team
The W, X, Y, Z specialized physicians mentioned in the classification section in Table 2. are the physicians who majored on vision disorders after receiving medical education in Turkey. Specialized physicians with minimum 8-year experience on Eye Health & Diseases also work abroad. The physicians reviewed the classification of the images by creating sub-folders for themselves in a restricted area on the Internet. They generally observed the decisions of the other physicians after making a decision, thus, this led to a whole data set created with consensus and which is more average.
3.1 Classification of hypertensive retinopathy
There is a strong correlation between hypertension and arteriosclerosis. Hypertension is an important factor for the occurrence and development of arteriosclerosis. If it is a pre-existing arteriosclerosis, it gets worse with hypertension. And sometimes, a severe arteriosclerosis may lead to hypertension. Thus, it is not exactly possible to consider these two incidents separately [33]. This relationship must be always considered when classifying the hypertensive or arteriolosclerotic changes [33-38]. There is no universally acknowledged classification for possible fundus changes in hypertension. The first classification was done by Keith-Wagener and Barker in 1939 [33-36, 38]. In this classification, arteriolosclerotic and hypertensive retina findings were gathered in 4 groups.
Grade0: Normal
Grade1: Light reflex of arterioles expands. Arteriovenous pressure is minimal or non-existent.
Grade2: Changes in the light reflex of arterioles and crossing symptoms are more obvious.
Grade3: Arterioles look like “copper wire”, and arteriovenous crossing symptoms are more obvious.
Grade4: Arterioles look like “silver wire”, and arteriovenous crossing symptoms are much more severe.
Scheie classified the hypertensive retina changes as follows [33-35]:
In addition to the abovementioned findings, papilledema is observed. Hypertensive retinopathy findings in some patients may not exactly involve this classification. For example, if the person had involutional sclerosis or arteriosclerotic changes before, this may prevent generalized or focal arteriolar construction [34]. In addition, sclerotic changes are not observed in young patients with toxemia of pregnancy or essential hypertension. Because sclerotic changes are the symptoms of a long-term hypertension.
Inspired by these approaches, while the images of eyes with no problems were collected in Level 0, the images of end stage eyes were collected in Level 3. A total of 4 classifications were created.
The Level 0 set. Level 0 is the data set for eyes without any problems. Level 1 data set images show the expansion of the light reflex of arterioles. However, arteriovenous pressure is minimal in most of the images. Level 2 has images in which the generalized arteriolar stenosis is more obvious. These images have focal arteriolar construction. Level 3 has all images for weak macular capillary perfusion, macular hemorrhage, retina edema, lipid exudations, branch retinal artery, vein occlusion, and less often, serous macula.
The W, X, Y, Z specialized physicians mentioned in the classification section in Table 2. are the physicians who majored on vision disorders after receiving medical education in Turkey. These experts carried out the classification carefully.
3.2 Data set
DRIVE data set contains a total of 4,000 fundus images collected from 2,224 individuals between 12-86 ages in Turkey. All the retinal images are in 937x781 dimensions and compressed JPEG format. The image size varies under 100Kb and the images are greyscale. The images in DRIVE data set consists of the images of patients with or without different levels of Hypertensive Angiopathy problem.
This team consisting of educated professionals captured 2 retina images (for right and left eyes) or 1 retina image, if just one eye was problematic, of each patient regardless of age and gender during their own working hours. Then, each retina image was analyzed by 4 specialized physicians, and asked to be distributed and created based on 4 classification categories.
STARE data set contains 200 fundus images captured by the experts. A fundus camera, which can capture high-definition images, was used. Fundus images were generated by digitalizing the data obtained from the imaging device that enabled the vessel segmentation of the patient. In this way, it was possible to determine if each pixel on the image was a vessel. Then, as in the DRIVE data set, each retina image was analyzed by 4 specialized physicians, and asked to be distributed based on 4 classification categories. During the generation process, equal number of images were taken from each grade of the disease.
The gray patches as a training set were generated from the training images by using the patch-based data augmentation strategy in Algorithm and the dimension of the patches was 48 × 48. A total of 4,000 images from the DRIVE dataset and 200 randomly selected images from the STARE dataset were used in the raining, and the remaining images from both datasets were used in testing the proposed method.
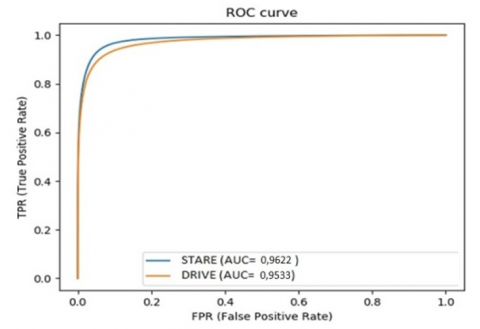
Five evaluation metrics are employed to evaluate the performance of the proposed method: sensitivity (Se), specificity (Sp), accuracy (Acc), dice and area under the receiver operating characteristic (ROC) curve. The mathematical expressions of these metrics are as follows:
Sensitivity (Se)= TP/TP+FN
Specificity (Sp)= TN/TN+FP
Accuracy (Acc)=TP+TN / TP+TN+FP+FN
Dice=2xTP / 2 x TP + FP + FN
where, TP, TN, FP, and FN indicate True Positive (correctly identified vessel pixels), True Negative (correctly identified background pixels), False Positive (incorrectly identified vessel pixels), and False Negative (incorrectly identified background pixels), respectively. The accuracy represents the overall success of the model on the detection of both vessel and background pixels, while sensitivity and specificity represent.
The overlapping ratios with the correctly segmented vessel and background pixels, respectively. Dice and AUC are also quite effective indicators for assessing the classification performance of the unbalanced database, where positive and negative samples are not equally distributed. Training is carried out by considering the various batch sizes and the obtained performance results.
ROC curve results generated in the suggested system are demonstrated in Figure 4.
Figure 4. Demonstration of ROC curve on DRIVE and STARE sets
3.3 Diagnostic performance of deep learning system
For prognosis, 25 images were taken from each folder in the data set, and expected to output data from the previously educated data set. 95 out of a total of 100 images used for prognosis belong to the correct classification. The results of the remaining 5 images belong to the upper or sub-class; despite this, the best second prognosis with usually high percentage belongs to its own classification.
The suggested system, supported by deep learning algorithms, detecting the Hypertensive Angiopathic Retinopathy, compared to the other approaches built in a clinical environment based on multi-racial population, was created with more limited data sources unlike the diabetic retinopathy evaluations in which half a million images were used. Therefore, the studies conducted for similar problems have higher precision.
Deep Learning Algorithms were scaled to the current model and transformed into a clinically acceptable version in order to identify Hypertensive Angiopathic Retinopathy or macular degeneration related to angiopathy, which possibly refers to the relevant eye diseases. Although Hypertensive Angiopathy observations were collected by non-specialist personnel, they were compiled by educated specialists, and graded by professional experts specialized on Hypertensive Angiopathy. In this way, a “semi-automated” model was built in which the deep learning algorithms will be included in a virtual platform where Hypertensive Angiopathy screening programs are already available.
Medical devices for optional optic coherence tomography (OCT) can be used in a way to be instantly triggered when any optic tomography image is generated inside. Similar studies were conducted with automated software on retinopathy screening.
Based on a study by Gulshan et al., the image pool consisting of approximately 10,000 images obtained from public databases (EyePAC-1 and Messidor-2) can be referred. With this pool, deep learning system with high precision and specificity (>90%) for diabetic retinopathy was reported. Similarly, Gargeya and Len utilized optimum deep learning diagnostic performance to identify any diabetic retinopathy by using the other two public data pools (Messidor-2 and E-Ophtha) [1].
To be precise, deep learning systems, which screen through the retinopathy images prepared in clinical environments by using different images in different qualities and from different cameras, were developed and the system was tested based on the data to compare the results. For these reasons, the current study may contribute to the other studies with similar and different qualities.
4.1 Limitations
This study has some limitations. First, the training set was developed by only the specialized ophthalmologists based on the grading of all images. Even though the reference standard in the primary verification used grading by a retina specialist, only the specialized ophthalmologists were asked for help instead of retina specialists, general ophthalmologists, educated graders, or optometrists when creating the reference standards since there were no external data sets.
In the suggested deep learning system, the training and verification data sets were created by using the data of people from other countries (Table 2) reviewed by specialized ophthalmologists. In this way, while the data pool was preferred to be enriched, a very small part of the entire data pool was built with different ethnic groups.
Another limitation in the suggested system is that all the classified images were taken from only one imaging device. The fact that different imaging devices were not used during the training of the system causes a significant restrictive effect as part of the expansion of the system.
In this study, a system which can diagnose the Hypertensive Angiopathy from fundus images was developed. The system is an architecture built by sequentially using the convolutional neural network layers. In this system, based on an image given for the prognosis process, it is expected to determine whether there is a disorder and, if there is, to classify.
In classification process, the word “Grade” is used, and Hypertensive Retinopathy problem is encountered at every stage of most classifications. However, in the suggested system, as the first classification consists of the eye images without any disorder, the name of the classification is “Level”.
The Deep Learning Algorithm was educated with a total of 4,000 fundus images. Among them, the first 1,000 images constitute the Level 0 set. Level 0 is the data set for eyes without any problems. Level 1 data set images show the expansion of the light reflex of arterioles. However, arteriovenous pressure is minimal in most of the images. Level 2 has images in which the generalized arteriolar stenosis is more obvious. These images have focal arteriolar construction. Level 3 has all images for weak macular capillary perfusion, macular haemorrhage, retina edema, lipid exudations, branch retinal artery, vein occlusion, and less often, serous macula. The data (number of images) in the data sets are very close. All images were completed and classified before December 2020.
Out of 4,000 images in the training data set, 25% (Level 0) were used in healthy eye classifications, and 75% were used in sick eye classifications (Level 1, Level 2, Level 3).
The results proved that each component of the data set could provide the expected level of performance, and that the overall data set outperforms the existing methods in terms of accuracy and AUC scores.
I would like to express my heartfelt thanks to managers and employees of Batı Göz Hospital, who helped me in the evaluation of data.
[1] Ting, D.S.W., Cheung, C.Y.L., Lim, G., Tan, G.S.W., Quang, N.D., Gan, A. (2017). Development and validation of a deep learning system for diabetic retinopathy and related eye diseases using retinal images from multiethnic populations with diabetes. Jama, 318(22): 2211-2223. Htttps://doi.org/10.1001/jama.2017.18152
[2] Yau, J.W., Rogers, S.L., Kawasaki, R., Lamoureux, E.L., Kowalski, J.W., Bek, T. (2012). Meta-Analysis for Eye Disease [META-EYE] Study Group. Global prevalence and major risk factors of diabetic retinopathy. Diabetes Care, 35(3): 556-564.
[3] Ting, D.S.W., Cheung, G.C.M., Wong, T.Y. (2016). Diabetic retinopathy: Global prevalence, major risk factors, screening practices and public health challenges: A review. Clinical & Experimental Ophthalmology, 44(4): 260-277. https://doi.org/10.1111/ceo.12696
[4] Cheung, N., Mitchell, P., Wong, T.Y. (2010). Diabetic retinopathy. Lancet, 376(9735): 124-136. https://doi.org/10.1007/s00125-002-0990-7
[5] Wang, L.Z., Cheung, C.Y., Tapp, R.J., Hamzah, H., Tan, G., Ting, D. (2017). Availability and variability in guidelines on diabetic retinopathy screening in Asian countries. British Journal of Ophthalmology, 101(10): 1352-1360. http://dx.doi.org/10.1136/bjophthalmol-2016-310002
[6] Burgess, P.I., Msukwa, G., Beare, N.A. (2013). Diabetic retinopathy in sub-Saharan Africa: Meeting the challenges of an emerging epidemic. BMC Medicine, 11(1): 1-7. https://doi.org/10.1186/1741-7015-11-157
[7] Hazin, R., Colyer, M., Lum, F., Barazi, M.K. (2011). Revisiting diabetes 2000: Challenges in establishing nationwide diabetic retinopathy prevention programs. American Journal of Ophthalmology, 152(5): 723-729. https://doi.org/10.1016/j.ajo.2011.06.022
[8] Ting, D.S., Ng, J.Q., Morlet, N., Yuen, J., Clark, A., Taylor, H.R. (2011). Diabetic retinopathy management by Australian optometrists. Clinical & Experimental Ophthalmology, 39(3): 230-235. https://doi.org/10.1111/j.1442-9071.2010.02446.x
[9] LeCun, Y., Bengio, Y., Hinton, G. (2015). Deep learning. Nature, 521(7553): 436-444. https://doi.org/10.1038/nature14539
[10] Lim, G., Lee, M.L., Hsu, W., Wong, T.Y. (2014). Transformed representations for convolutional neural networks in diabetic retinopathy screening. In Workshops at the Twenty-Eighth AAAI Conference on Artificial Intelligence.
[11] Gulshan, V., Peng, L., Coram, M., Stumpe, M.C., Wu, D., Narayanaswamy, A. (2016). Development and validation of a deep learning algorithm for detection of diabetic retinopathy in retinal fundus photographs. Jama, 316(22): 2402-2410. https://doi.org/10.1001/jama.2016.17216
[12] Gargeya, R., Leng, T. (2017). Automated identification of diabetic retinopathy using deep learning. Ophthalmology, 124(7): 962-969. https://doi.org/10.1016/j.ophtha.2017.02.008
[13] Abràmoff, M.D., Lou, Y., Erginay, A., Clarida, W., Amelon, R., Folk, J.C., Niemeijer, M. (2016). Improved automated detection of diabetic retinopathy on a publicly available dataset through integration of deep learning. Investigative Ophthalmology & Visual Science, 57(13): 5200-5206. https://doi.org/10.1167/iovs.16-19964
[14] Wong, T.Y., Bressler, N.M. (2016). Artificial intelligence with deep learning technology looks into diabetic retinopathy screening. Jama, 316(22): 2366-2367. https://doi.org/10.1001/jama.2016.17563
[15] Abramoff, M.D., Niemeijer, M., Russell, S.R. (2010). Automated detection of diabetic retinopathy: Research Original Investigation Machine Learning Screen for Diabetic Retinopathy and Other Eye Diseases 2222 JAMA December 12, 2017 Volume 318, Number 22 (Reprinted) jama.com © 2017 American Medical Association. All rights reserved. Downloaded From: https://jamanetwork.com/ on 03/25/2020 barriers to translation into clinical practice. Expert Rev Med Devices, 7(2): 287-296.
[16] Chew, E.Y., Schachat, A.P. (2015). Should we add screening of age-related macular degeneration to current screening programs for diabetic retinopathy? Ophthalmology, 122(11): 2155-2156. https://doi.org/10.1016/j.ophtha.2015.08.007
[17] Nguyen, H.V., Tan, G.S.W., Tapp, R.J., Mital, S., Ting, D.S.W., Wong, H.T. (2016). Cost-effectiveness of a national telemedicine diabetic retinopathy screening program in Singapore. Ophthalmology, 123(12): 2571-2580. https://doi.org/10.1016/j.ophtha.2016.08.021
[18] Huang, O.S., Tay, W.T., Ong, P.G., Sabanayagam, C., Cheng, C.Y., Tan, G.S. (2015). Prevalence and determinants of undiagnosed diabetic retinopathy and vision-threatening retinopathy in a multiethnic Asian cohort: the Singapore Epidemiology of Eye Diseases (SEED) study. British Journal of Ophthalmology, 99(12): 1614-1621. http://dx.doi.org/10.1136/bjophthalmol-2014-306492
[19] Wong, T.Y., Cheung, N., Tay, W.T., Wang, J.J., Aung, T., Saw, S.M., (2008). Prevalence and risk factors for diabetic retinopathy: The Singapore Malay Eye Study. Ophthalmology, 115(11): 1869-1875. https://doi.org/10.1016/j.ophtha.2008.05.014
[20] Shi, Y., Tham, Y.C., Cheung, N., Chua, J., Tan, G., Mitchell, P. (2017). Is aspirin associated with diabetic retinopathy? The Singapore Epidemiology of Eye Disease (SEED) study. PloS One, 12(4): e0175966. https://doi.org/10.1371/journal.pone.0175966
[21] Chong, Y.H., Fan, Q., Tham, Y.C., Gan, A., Tan, S.P., Tan, G. (2017). Type 2 diabetes genetic variants and risk of diabetic retinopathy. Ophthalmology, 124(3): 336-342. https://doi.org/10.1016/j.ophtha.2016.11.016
[22] Jonas, J.B., Xu, L., Wang, Y.X. (2009). The Beijing Eye Study. Acta Ophthalmol, 87(3): 247-261.
[23] Varma, R. (2017). African American eye disease study. National Institutes of Health website. http://grantome.com/grant/NIH/U10-EY023575-03.
[24] Lamoureux, E.L., Fenwick, E., Xie, J., Mcauley, A., Nicolaou, T., Larizza, M. (2012). Methodology and early findings of the Diabetes Management Project: A cohort study investigating the barriers to optimal diabetes care in diabetic patients with and without diabetic retinopathy. Clinical & Experimental Ophthalmology, 40(1): 73-82. https://doi.org/10.1111/j.1442-9071.2011.02697.x
[25] Tang, F.Y., Ng, D.S., Lam, A., Luk, F., Wong, R., Chan, C. (2017). Determinants of quantitative optical coherence tomography angiography metrics in patients with diabetes. Scientific Reports, 7(1): 1-10. https://doi.org/10.1038/s41598-017-02767-0
[26] Chua, J., Baskaran, M., Ong, P.G., Zheng, Y., Wong, T.Y., Aung, T., Cheng, C.Y. (2015). Prevalence, risk factors, and visual features of undiagnosed glaucoma: The Singapore Epidemiology of Eye Diseases Study. JAMA Ophthalmology, 133(8): 938-946. https://doi.org/10.1001/jamaophthalmol.2015.1478
[27] Cheung, C.M.G., Li, X., Cheng, C.Y., Zheng, Y., Mitchell, P., Wang, J.J., Wong, T.Y. (2014). Prevalence, racial variations, and risk factors of age-related macular degeneration in Singaporean Chinese, Indians, and Malays. Ophthalmology, 121(8): 1598-1603. https://doi.org/10.1016/j.ophtha.2014.02.004
[28] Cheung, C.M.G., Bhargava, M., Laude, A., Koh, A.C., Xiang, L., Wong, D. (2012). Asian age‐related macular degeneration phenotyping study: Rationale, design and protocol of a prospective cohort study. Clinical & Experimental Ophthalmology, 40(7): 727-735. https://doi.org/10.1111/j.1442-9071.2012.02765.x
[29] Ting, D.S.W., Yanagi, Y., Agrawal, R., Teo, H.Y., Seen, S., San Yeo, I.Y. (2017). Choroidal remodeling in age-related macular degeneration and polypoidal choroidal vasculopathy: A 12-month prospective study. Scientific Reports, 7(1): 1-7. https://doi.org/10.1038/s41598-017-08276-4
[30] Ting, D.S.W., Ng, W.Y., Ng, S.R., Tan, S.P., San Yeo, I.Y., Mathur, R. (2016). Choroidal thickness changes in age-related macular degeneration and polypoidal choroidal vasculopathy: A 12-month prospective study. American Journal of Ophthalmology, 164: 128-136. https://doi.org/10.1016/j.ajo.2015.12.024
[31] Özkan, İ.N.İ.K., Ülker, E. (2017). Derin öğrenme ve görüntü analizinde kullanılan derin öğrenme modelleri. Gaziosmanpaşa Bilimsel Araştırma Dergisi, 6(3): 85-104.
[32] Umut, K.A.Y.A., Yilmaz, A., Dikmen, Y. (2019). Sağlık alanında kullanılan derin öğrenme yöntemleri. Avrupa Bilim ve Teknoloji Dergisi, (16): 792-808. https://doi.org/10.31590/ejosat.573248
[33] Murphy, H.P., Chew, E.Y. (1989). Hypertension: In: Ryan SJ, Schachat AP, Murphy RP, Pätz A, ed. Retina. St Louis: The Mosby Company, 2(78): 449-455.
[34] Jampol, L.M. (1980). Ocular manifestations of selected systemic diseases. Principles and Practice of Ophthalmology, 3: 1633-71.
[35] American Academy of Ophthalmology. (1988). Retina and vitreous. San Francisco, 13: 1-3.
[36] Walsh, J.B. (1982). Hypertensive retinopathy: Description, classification, and prognosis. Ophthalmology, 89(10): 1127-1131. https://doi.org/10.1016/S0161-6420(82)34664-3
[37] Allen, H.F. (1970). Laser photocoagulation and retinal angiography. Archives of Ophthalmology, 83(6): 795-795. https://doi.org/10.1001/archopht.1970.00990030795020
[38] Budak, Ü., Cömert, Z., Çıbuk, M., Şengür, A. (2020). DCCMED-Net: Densely connected and concatenated multi Encoder-Decoder CNNs for retinal vessel extraction from fundus images. Medical Hypotheses, 134: 109426. https://doi.org/10.1016/j.mehy.2019.109426