Yunfang Xie | Su Zhang | Yingdi Liu*
© 2021 IIETA. This article is published by IIETA and is licensed under the CC BY 4.0 license (http://creativecommons.org/licenses/by/4.0/).
OPEN ACCESS
Artificial intelligence and fifth generation (5G) technology are widely adopted to evaluate the classroom poses of college students, with the help of campus video surveillance equipment. To ensure the effective learning in class, it is important to detect and intervene in abnormal behaviors like sleeping and using cellphones in time. Based on spatiotemporal representation learning, this paper presents a deep learning algorithm to evaluate classroom poses of college students. Firstly, feature engineering was adopted to mine the moving trajectories of college students, which were used to determine student distribution and establish a classroom prewarning system. Then, k-means clustering (KMC) was employed for cluster analysis on different student groups, and identify the features of each group. For a specific student group, the classroom surveillance video was decomposed into several frames; the edge of each frame was extracted by edge detection algorithm, and imported to the proposed convolutional neural network (CNN). Experimental results show that our algorithm is 5% more accurate than the benchmark three-dimensional CNN (C3D), making it an effective tool to recognize abnormal behaviors of college students in class.
artificial intelligence, college students, pose estimation, spatiotemporal representation learning, k-means clustering (KMC), convolutional neural network (CNN)
In recent years, computer vision has developed rapidly, under the driving of data, computing power and algorithms. As the main objects of computer vision, image recognition and video recognition are similar in many aspects. However, far more scholars have explored videos than images. The video research not only involves detection and recognition [1], style conversion, and retrieval, but also covers target detection and tracking, personal behavior recognition, action prediction, and determining the nature of behaviors. Besides saving manpower, detecting student poses in surveillance videos [2] can alert students to abnormal poses, help them to cultivate a good learning habit, and prevent hunchback and myopia caused by improper poses, heralding the realization of unattended classroom.
Many conventional methods can identify student behaviors in class. The most common methods of behavior recognition include feature extraction, feature processing, and feature classification [3]. In the HMDB51 dataset, the improved dense trajectory (IDT) algorithm [4] has the highest recognition rate, reaching 57.2%. Xiao et al. [5] and Lu [6] were the first to apply deep learning extensively in video recognition [7]. Comparing the influence of four single-flow neural network structures on behavior recognition, it is found that a single frame of video contains lots of behavior features. Simonyan and Zisserman [8] divided the monitoring mode into a time flow and a space flow, regarded optical flow as the input of time flow, and conducted behavior recognition with dual-flow convolutional neural network (CNN), revealing that the time flow has better input performance than the original frame input. Many deep learning studies on student behavior recognition [9, 10] are based on single-flow or dual-flow neural network. In traditional empirical research, the necessary pre-test hypotheses ignore some potentially useful functions. Fortunately, the emerging technology of feature engineering helps to discover some subtle influencing factors. The intrinsic development logic of these factors can associate student trajectories outside the classroom, and greatly promote the monitoring of student behaviors.
In video teaching, both time and space information should be considered to recognize the classroom behaviors of students. How to balance the relationship between the two dimensions is the key to identifying good behaviors in time and space. Our work is unfolded based on the key information needed to recognize human behaviors in videos, that is, the edge trajectories of human body. Firstly, feature engineering was implemented to generate a series of features to describe the lifestyles, income patterns, and Internet use patterns of students. Then, the features of different student groups were identified through K-means clustering (KMC) [11]. On classroom performance, the edge features of video frames were taken as the basis for the spatial dimension of behavior recognition, and the three-dimensional CNN (C3D) was adopted to fuse the spatiotemporal information of continuous frames. On this basis, repeated experiments were conducted, and a robust abnormal behavior recognition algorithm was designed to timely detect and prewarn abnormal student poses.
So far, various schemes have been adopted to analyze or monitor student behaviors in class. For example, Buniyamin et al. [12] classified and predicted student scores based on the data of campus information system. Wu et al. [13] intuitively demonstrated the spatiotemporal features of student scores with the data on campus activities and consumption. Zhou and Xiao [14] predicted the information that interests college students according to the inspection data on students. Li et al. [15] explored the scholarships and grants of colleges against the data on campus information system. Drawing on some ideas and methods in these studies, this paper discusses the factors affecting the scores of college students. The relevant trajectory data record the body information of students, and also reflect their habits and opinions to a certain extent.
Some scholars evaluated the similarities between participants through the mining of global positioning system (GPS) trajectories [16]. Considering the difficulty in acquiring the GPS information of college students, this paper creates an activity sequence for each student from the campus behavior data. The two focuses of our research include: identifying the factors affecting student scores based on behavior data, and cluster analysis, which has been applied in many other fields.
The distribution of feature weights is very important in cluster analysis, because only a few features are truly valuable. Chen et al. [17] proposed the W-k-means algorithm, without sacrificing the efficiency of the K-means algorithm, under the inspiration of the fuzzy C-means algorithm [18]. Hung et al. [19] suggested improving the performance of the K-means algorithm by initializing the weights as per the coefficient of variation. In addition, retroactive learning is a good framework of machine learning and logical reasoning. It can effectively explain the observed facts and hypotheses based on the known background knowledge. On this basis, this paper decides to determine the feature weights of the clustering algorithm from both objective and subjective aspects.
3.1 Problem definition
When a college student makes a payment with his/her campus card, his/her personal information is recorded. If he/she uses his/her identity to access the Internet or rent a house, his/her personal information will be added to some data records. These records will continue to increase with the elapse of time. The recorded data can accurately reflect the daily behaviors of the college student.
The scores of college students are closely correlated with self-discipline and time management. Good students generally have different behavior patterns from average students [20]. Therefore, the scores of college students can be reflected in daily life activities, such as smart card usage, Internet access, and cellphone/computer interactions.
3.2 Preparatory work
The functional areas are distributed in different places on campus. For example, the dormitories might scatter across the college, and have different names. Let Sγ be the campus of the target college; Fη be the functional areas on campus, including dormitories, canteens, classrooms, libraries, yards, bathrooms, etc.; (p.lo,p.fu) be the λ-th position p(γ, λ) on campus, where p.lo is the position of physical position p, p.fu is the functional area of p; c(·) be the function to transform p.lo into functional area p.fu. The time and position information are primarily extracted from consumption data, network service data, and access control data.
The activity of a student A can be labeled by his/her time tag tA, functional area pÎFη, activity area bÎBφ, as well as other relevant attributes. The activity sequence of A can be vectorized as b. In addition, the consumption behavior consists of such attributes as consumption amount, and card balance. A charging behavior at least covers information like “maximum amount”. After being extracted from the consumption data, network service data, and access control data, the time and position of each student in every activity can be sorted in that period, without changing the spatiotemporal sequence of students.
The activity sequence of student A contains both spatial order and time order. Here, the activity sequence is defined as Aseq={(t1, q1),…,(tk, qk)}, where ti<tj (i<j) is time, qiÎqϕ is the i-th item in the sequence, and qi could be equal to qj.
For the given activity sequence Aseq={(t1,p1),…,(tk, pk)} and parameter ξ, if (ti, Pi) and (ti+1,Pi+1) satisfy Pi=Pi+1 and if |ti-ti+1|<ξ, then (ti, pi) and (ti+1, Pi+1) belong to the same position.
The trajectory Tra of student A is a subset of Aseq: TraÎAseq.
Using the node information in behavioral data, the original data were converted to semantic trajectories. Following the time-based trajectory segmentation method, this paper correctly extracts the trajectory from the activities of each student on a day [21-23]. Note that the day refers to the “day” for the student to complete a set of activities, rather than a natural day (from 00:00 to 00:00). For example, the “daily” trajectories of a student could cover {(10pm, November 3, classroom)-(11pm, November 3, bedroom)…(0am, November 4, bedroom)}. Although the trajectories cover two days, all the activities are clearly completed within the same day. Thus, the daily journey of each student can be defined as follows.
Here, the behavior trajectory is defined as Tra={(t1, q1),…,(tk, qk)}, and the daily behavior trajectories as DTra={(t1,q1),…,(ts,qs)}. The daily trajectories are organized into a trajectory set (DTraÎTra). In the Tra, there must exist a unique (tj, qj) such that (t1, q1)=(tj, qj), and "nÎ{1,2,…,S-1},(t1+n,q1+n)=(tj+n, qj+n).
The same activity recorded by the campus information system may contain multiple data that needs to be checked. The trajectory of such an activity can be expressed as $\operatorname{Tr} a P=q_{1}^{\prime} \stackrel{\Delta t_{1}^{\prime}}{\longrightarrow} q_{2}^{\prime} \stackrel{\Delta t_{2}^{\prime}}{\longrightarrow} \cdots \stackrel{\Delta t_{u-1}^{\prime}}{\longrightarrow} q_{u}^{\prime}$, where $q_{i}^{\prime} \in\left\{q_{j}\right\}$. If (tj, qj) corresponds to (ti, qi), and $q_{i+1}^{\prime}$ corresponds to (tj, qj), then $\Delta t_{i}^{\prime}=t_{j}-t_{i}$.
3.3 Cluster analysis
For the given ∂={∂1, ∂2,…, ∂N} and β={β1, β2,…, βK}, if ∂ is the n-th instance of ∂n, then βK is the k-th cluster in β. Then, ∂n={∂n1, ∂n2,…, ∂nM}, where ∂ nm is the m-th eigenvalue. Moreover, β1Èβ2È…ÈβK=∂, and β1Çβ2Ç…ÇβK=ϕ.
For the given ∂={∂1,∂2,…,∂IV} and β={β1, β2,…, βk}, if S∂ is the n-th ∂, then βk is the k-th cluster in β. βk={βk1, βk2,…, βkM}, k=1,2,...,K.
The K-means algorithm aims to maximize the intra-cluster similarity and minimize inter-cluster similarity. Therefore, the constraint function is the sum of the distance between the intra-cluster instances and the cluster head:
$P(\mathbf{U},\beta )=\sum\limits_{k=1}^{K}{\sum\limits_{n=1}^{N}{{{u}_{nk}}}}\sum\limits_{m=1}^{M}{d}\left( {{x}_{n~\text{m}}},{{\beta }_{k~\text{m}}} \right)$ (1)
where, U is an N´K matrix; unkÎ{0,1} (If unk=1, then the n-th instance belongs to the k-th cluster); $\sum_{k=1}^{K} u_{n k}=1, n=1,2, \cdots, N ; \beta$ consists of K clusters, i.e., β={β1,β2,…,βk}; d(xnm,βkm) is the distance between an intra-cluster instance and cluster head. The constraint function can be rewritten by Euclidean distance:
$P(\mathbf{U},\beta )=\sum\limits_{k=1}^{K}{\sum\limits_{n=1}^{N}{{{u}_{nk}}}}\sum\limits_{m=1}^{M}{{{\left( {{x}_{n~\text{m}}}-{{\beta }_{k~\text{m}}} \right)}^{2}}}$ (2)
Obviously, each function is equal in formula (2). In fact, only some special functions are useful. Thus, functional selection was adopted to remove redundant, noisy functions [24]. In addition, feature weighting is a generalization technology, which assigns a weight to each feature within the range of [0, 1] rather than delete that feature [25]. Therefore, some scholars held that, before applying the K-means algorithm, each feature should be given a weighted tag, and the weights of M features should be defined as W=(ω1, ω2,…, ωM) Then, formula (2) can be rewritten as:
$P(\mathbf{U},\beta )=\sum\limits_{k=1}^{K}{\sum\limits_{n=1}^{N}{{{u}_{nk}}}}\sum\limits_{m=1}^{M}{w_{m}^{\beta }}{{\left( {{x}_{n~\text{m}}}-{{\beta }_{k~\text{m}}} \right)}^{2}}$ (3)
where, WÎ[0,1]; $\sum_{m=1}^{M} \omega_{m}=1$; β is a user defined parameter. Under the constraint that the sum of all weights equals 1, the feasible approach is to express the minimum value of formula (3) as:
${{w}_{m}}=\frac{1}{\sum\limits_{t\in F}{{{\left[ {{D}_{m}}/{{D}_{t}} \right]}^{1/(\beta -1)}}}}$ (4)
where, $D_{m}=\sum_{k=1}^{K} \sum_{n=1}^{N} u_{n k}\left(x_{n m}-c_{k m}\right)^{2}$ is the sum of variances of each cluster.
By modifying the basic K-means algorithm, this paper solves the weight difference between features. Drawing on subjective weight V and objective weight W, an integrated weight can be defined as γ=(γ1, γ2,…, γM) with $\gamma_{m}=\frac{w_{m} v_{m}}{\sum_{m=1}^{M} w_{m} v_{m}}$. Whereas A=(al, a2,⋯, an) and B=(bl, b2,⋯, bm), n≤m, if there exists a sequence satisfying 1≤j1≤j2≤···≤jn≤m, a1Îbj1, a2Îbj2 then, A is the subsequence of B, and B is the hyper sequence of Yu [26]. The subsequences satisfy the following assumptions: (1) the items in every subsequence exist in the hyper sequence; (2) the items in every subsequence follow the same order as they are in the hyper sequence. For example, S=<a(abc)(ac)d(cf)>, <a(abc)> is a subsequence of S. For sequences A=(al,a2,⋯,an) and B=(bl,b2,⋯,bm), n≤m, if al=bl, a2=b2,…, an-1=bn-1 and anÍbn, then A is the prefix of B.
4.1 Edge extraction
Boundary extraction aims to detect the contour of objects in the target image, which usually exists at places with high grayscale changes. Edge detection algorithms are often adopted to preserve the contour, while hiding the pixels. This paper chooses the Canny edge detection algorithm, in view of its good effect on edge extraction [27]. The specific steps of this algorithm are as follows:
First, a two-dimensional (2D) Gaussian function [28] was adopted to filter and denoise the image pixel by pixel:
$G(x,y)=\frac{1}{2\pi {{\sigma }^{2}}}\exp \left( -\frac{{{x}^{2}}+{{y}^{2}}}{2{{\sigma }^{2}}} \right)$ (5)
where, x and y are the abscissa and ordinate, respectively; σ is the standard deviation.
In fact, Gaussian convolution was adopted to verify the convolutional effect of the image. As shown in Figure 2, the Gaussian convolution kernel is a regularized kernel with the size of 3´3 and the variance of σ=1.5:
$G=\left[ \begin{matrix} 0.0947 & 0.1183 & 0.0947 \\ 0.1183 & 0.1477 & 0.1183 \\ 0.0947 & 0.1183 & 0.0947 \\\end{matrix} \right]$ (6)
The Gaussian convolution kernel was adopted to convolute the image to remove noise points and smooth the image.
The Sobel operator in formulas (3) and (4) was used to calculate the image gradient during the convolution. It can be divided into a horizontal operator Sx for calculating horizontal gradient and a vertical operator Sy for calculating vertical gradient:
${{S}_{x}}=\left[ \begin{matrix} -1 & 0 & 1 \\ -2 & 0 & 2 \\ -1 & 0 & 1 \\\end{matrix} \right]$ (7)
${{S}_{y}}=\left[ \begin{matrix} -1 & -2 & -1 \\ 0 & 0 & 0 \\ 1 & 2 & 1 \\\end{matrix} \right]$ (8)
The image gradient can be expressed as:
${{d}_{x}}=f(x,y).{{S}_{x}}$ (9)
${{d}_{y}}=f(x,y).{{S}_{y}}$ (10)
Then, the amplitude M and direction θM of image gradient can be respectively computed by:
$M=\sqrt{d_{x}^{2}+d_{y}^{2}}$ (11)
${{\theta }_{M}}=\arctan \left( {{d}_{y}}/{{d}_{x}} \right)$ (12)
Through the above calculation, two images were obtained, including a gradient map and an angle map. Then, the gradient image was binarized by non-maximum suppression (NMS) [29, 30], which finds the local extreme edges and labels edges/non-edges with 1/0. The binarization could reveal the edge of a single pixel. The non-maximum points in the gradient direction were filtered to refine the edges.
4.2 Model structure
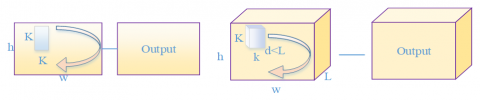
2D CNN has been successfully applied to the detection of abnormal behaviors in videos [31], and the classification of images. However, 2D CNN cannot be directly implemented to classify video frames. Because the classroom surveillance video contains time information, every action by the students has its own trajectory. Therefore, this paper expands 2D kernel with 3D CNN into a 3D kernel: the kernel size was changed from wavelength × W into wavelength × D, with D being the number of continuous frames in the 3D kernel. The 3D kernel can effectively capture the time information in video.
Figure 1 compares the 2D convolution with 3D convolution. The left subgraph illustrates how 2D convolution processes an image; the right subgraph explains the 3D convolution of video frames, which generates an additional dimension to save the time information in video.
The C3D [32, 33] is an early 3D CNN that has been successfully applied in behavior recognition. This original model consists of seven parts. The first five parts mainly includes convolutional layers and pooling layers; the sixth part contains two fully-connected layers; the seventh part is a Softmax layer. The original C3D structure is shown in the upper subgraph of Figure 2.
Figure 1. Comparison between 2D and 3D convolutions
Figure 2. Structure of 3D CNNs
The C3D contains lots of parameters, as it was designed to classify a massive number of videos. The parameters mainly exist in the form of 3D kernels, with many channels in each layer. As shown in Figure 2, 512 channels can be outputted by convolutional layers 4 and 5. Because abnormal behaviors do not need to be recognized in convolutions, the number of convolution kernels in each layer can be reduced by half. Experimental results show that the C3D could shorten more than half of the training time and the reasoning time. The reduction of kernel number did not lower the precision, but slightly improves the accuracy. A possible reason is that the original model is so large as to cause overfitting. To further improve the recognition accuracy, this paper adds two similar convolutional layers and a pooling layer to the C3D. The improved C3D for abnormal pose detection is presented in the lower subgraph of Figure 2.
5.1 Experimental environment
The experimental environment is as follows: the central processing unit (CPU) is Intel hexacore i7-8750h; the graphics card is Gigabyte GeForce RTX 3080 EAGLE OC 10G; the memory is 16G; the operating system is Ubuntu 18.04; the programming language is Python; the deep learning framework is TensorFlow 2.0 (GPU version).
5.2 Dataset
Our dataset comes from the opensource code dataset of Sun et al. [34]. It covers the student behaviors identified, detected, and labeled in class. In total, there are videos on 11 subjects taught in 128 classes. The dataset was split into a detection dataset, two recognition datasets, and a title dataset. The detection dataset contains 4,542 samples for time detection and 3,343 samples for action detection; the two recognition datasets respectively contain 4,276 samples and 4,296 samples. The datasets are representative and authentic, because all the actions in them are spontaneous actions by students in actual classrooms. The datasets were uploaded to https://github.com/BNU-Wu/Student-Class-Behavior-Dataset.
5.3 Training results analysis
(1) Video segmentation
Each video was divided into several frames. Following the edge extraction method in Section 2, the single-pixel, 3-pixel, and 5-pixel edges were extracted from the video frames. Then, the data were split into a training set and a test set by the ratio of 7:3. Our model was trained on the training set and evaluated on the test set.
(2) Model training
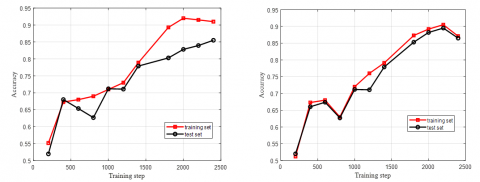
In each iteration, 8 samples were randomly selected, and 16 continuous frames were extracted by random from each sample. Then, the spatiotemporal data acquired by KMC from the students were fused by the scheme of Lu [6], Wu et al. [13]. To evaluate the recognition effect, each model was trained and evaluated by the training and test sets. The improved C3D model was compared with the original C3D in terms of accuracy. Figure 3 compares the two models with 3-pixel edges as the input. It can be seen that the improved C3D is much more accurate than the original model; through the improvement, the number of parameters was reduced by half, and the training speed and reasoning speed were almost doubled.
(3) Model comparison with different inputs
Next, the generalization ability of our model was compared with four different inputs: original video frames (Figure 4(a)), single-pixel edges (Figure 4(b)), 3-pixel edges (Figure 4(c)), and 5-pixel edges (Figure 4(d)). It is generally believed that the model generalization ability is positively correlated with the precision of the training set and the size of the test set.
As shown in Figure 4, our model reached an accuracy as high as 95% on the training set, with the inputs of original video frames and single-pixel edges, but its accuracy on the test set with these inputs was 10% lower. Therefore, the two types of inputs are not good for the generalization ability of our model. When 3-pixel edges were inputted, the accuracy on test set gradually approximated that on training set, with the growing training steps, after 2,400 iterations, the accuracy on test set rose to around 93%.
Finally, the model accuracies on four different inputs were compared on the test set. It can be seen from Figure 5 that, after 800 training steps, the accuracy with the input of 3-pixel edges was much higher than that with another input; after 2,400 training steps, the accuracy with the input of 3-pixel edges increased to 93%, way higher than that (85%) with other types of inputs. Hence, 3-pixl edges are the best input features for video behavior recognition. In Figure 5, the four curves had basically the same trend. The behavior recognition rates with edges as inputs were comparable and even better than the rate with original video frames as inputs. As a result, our assumption is verified that the key information of human behaviors in videos is contained on the body contour.
Figure 3. Accuracies of original and improved C3Ds
Figure 4. Comparison between accuracies on training set and test set
Figure 5. Test set accuracies with four different types of inputs
5.4 Recognition effect
Despite limitations on some behavior features, some behaviors are visually similar, which poses a challenge to pose identification and detection. Our method could distinguish between two different poses, in spite of their visual similarity, whether in singe person recognition or multi-person recognition.
As shown in the upper subgraph of Figure 6, our method accurately judged whether the student is learning or using cellphone, with an accuracy of 0.96. This is because our method incorporates external spatiotemporal representation data into the 3D convolution.
As shown in the lower subgraph of Figure 6, although multiple students sat in different places in the classroom and their images were of different sizes in the video, our method could accurately recognize their pzoses, for our model has a certain prior knowledge through the KMC of their common behaviors on campus.
Figure 6. Recognition effect
Assuming that the key information needed to recognize human behaviors exists on body contour, this paper presents a classroom pose estimation method based on spatiotemporal representation learning. Firstly, the authors mined the trajectories of college students, and then determined student distribution and established a classroom prewarning system. Next, the classroom surveillance video was decomposed into several frames; the edge of each frame was extracted by edge detection algorithm, and imported to iteratively train the CNN model. The trained model was used to detect the abnormal poses of students in class, alert students to abnormal poses, and help them to correct such poses. Experimental results show that our method has good real-time performance and robustness.
[1] Barbedo, J.G.A., Koenigkan, L.V., Halfeld-Vieira, B.A., Costa, R.V., Nechet, K.L., Godoy, C.V., Angelotti, F. (2018). Annotated plant pathology databases for image-based detection and recognition of diseases. IEEE Latin America Transactions, 16(6): 1749-1757. https://doi.org/10.1109/TLA.2018.8444395
[2] Khenissi, M.A., Essalmi, F., Jemni, M. (2015). Learner modeling using educational games: A review of the literature. Smart Learning Environments, 2(1): 1-16. https://doi.org/10.1186/s40561-015-0014-y
[3] Yildiz, K. (2017). Dimensionality reduction-based feature extraction and classification on fleece fabric images. Signal, Image and Video Processing, 11(2): 317-323. https://doi.org/10.1007/s11760-016-0939-9
[4] Yi, Y., Wang, H. (2018). Motion keypoint trajectory and covariance descriptor for human action recognition. The Visual Computer, 34(3): 391-403. https://doi.org/10.1007/s00371-016-1345-6
[5] Xiao, X., Xu, D., Wan, W. (2016). Overview: Video recognition from handcrafted method to deep learning method. In 2016 International Conference on Audio, Language and Image Processing (ICALIP), pp. 646-651. https://doi.org/10.1109/ICALIP.2016.7846652
[6] Lu, S. (2019). Deep learning for object detection in video. Journal of Physics Conference Series, 1176. https://doi.org/10.1088/1742-6596/1176/4/042080
[7] Schmidhuber, J. (2015). Deep learning in neural networks: An overview. Neural networks, 61: 85-117. https://doi.org/10.1016/j.neunet.2014.09.003
[8] Simonyan, K., Zisserman, A. (2014). Two-stream convolutional networks for action recognition in videos. arXiv preprint arXiv:1406.2199.
[9] Jiang, M., Rao, Y., Zhang, J., Shen, Y. (2020). Automatic behavior recognition of group-housed goats using deep learning. Computers and Electronics in Agriculture, 177: 105706. https://doi.org/10.1016/j.compag.2020.105706
[10] Zheng, S., Li, G.S., Polytechnic, J. (2019). Design of Classroom Human Behavior Recognition Model Based on Deep Learning.
[11] Kasuga, H., Yamamoto, H., Okamoto, M. (2000). Color quantization using the fast K-means algorithm. Systems and Computers in Japan, 31(8): 33-40. https://doi.org/10.1002/1520-684X(200007)31:8<33::AID-SCJ4>3.0.CO;2-C
[12] Buniyamin, N., Bin Mat, U., Arshad, P.M. (2015). Educational data mining for prediction and classification of engineering students achievement. In 2015 IEEE 7th International Conference on Engineering Education (ICEED), pp. 49-53. https://doi.org/10.1109/ICEED.2015.7451491
[13] Wu, Y., Gong, R., Cao, Y., Wen, C., Teng, Z., Pu, J. (2016). EduCircle: Visualizing spatial temporal features of student performance from campus activity and consumption data. In International Conference on Cooperative Design, Visualization and Engineering, pp. 313-321. https://doi.org/10.1007/978-3-319-46771-9_41
[14] Zhou, Q., Xiao, Y. (2018). Analysis and Precaution of College Students' Academic Record based on Data Mining Technology. China Educational Technology & Equipment, 06.
[15] Li, F.L., Xiang, H., Liu, X. (2015). Effects of Scholarships and Grants on College Students' Academic Achievement: Taking Tsinghua University as an Example. Tsinghua Journal of Education.
[16] Zhao, J., Wang, H., Tang, B., Yang, Z. (2016). Research of GPS track generation and location based on mobile robot. Industry and Mine Automation, 01.
[17] Chen, G.P., Wang, W.P., Huang, J. (2012). Improved initial clustering center selection method for K-means algorithm. Journal of Chinese Computer Systems, 33(6): 1320-1323.
[18] Bouyer, A., Hatamlou, A., Masdari, M. (2015). A new approach for decreasing energy in wireless sensor networks with hybrid LEACH protocol and fuzzy C-means algorithm. International Journal of Communication Networks and Distributed Systems, 14(4): 400-412. https://doi.org/10.1504/IJCNDS.2015.069675
[19] Hung, W.L., Chang, Y.C., Lee, E.S. (2011). Weight selection in WK-means algorithm with an application in color image segmentation. Computers & Mathematics with Applications, 62(2): 668-676. https://doi.org/10.1016/j.camwa.2011.05.048
[20] Kickert, R., Meeuwisse, M., Stegers-Jager, K.M., Koppenol-Gonzalez, G.V., Arends, L.R., Prinzie, P. (2019). Assessment policies and academic performance within a single course: the role of motivation and self-regulation. Assessment & Evaluation in Higher Education, 44(8): 1177-1190. https://doi.org/10.1080/02602938.2019.1580674
[21] Ham, S., Lee, G. (2017). Time-based joining method for generating phylogenetic trees of architectural plans. Journal of Computing in Civil Engineering, 31(2): 04016055. https://doi.org/10.1061/(ASCE)CP.1943-5487.0000626
[22] Sasubilli, S.M., Kumar, A., Dutt, V. (2020). Machine learning implementation on medical domain to identify disease insights using TMS. In 2020 International Conference on Advances in Computing and Communication Engineering (ICACCE), pp, 1-4. https://doi.org/10.1109/ICACCE49060.2020.9154960
[23] Ji, H.B, Wang, J.H. (2016). Research on Improved PrefixSpan Algorithm and its Application in Web User Behavior Patterns Mining. Computer Science.
[24] Wang, Z. (2015). Removal of noise and radial lens distortion during calibration of computer vision systems. Optics Express, 23(9): 11341-11356. https://doi.org/10.1364/OE.23.011341
[25] Alshomrani, S., Bawakid, A., Shim, S.O., Fernández, A., Herrera, F. (2015). A proposal for evolutionary fuzzy systems using feature weighting: dealing with overlapping in imbalanced datasets. Knowledge-Based Systems, 73: 1-17. https://doi.org/10.1016/j.knosys.2014.09.002
[26] Yu, X. (2015). Hyper-sequence-graph mining. The University of Texas at San Antonio.
[27] Nikolic, M., Tuba, E., Tuba, M. (2016). Edge detection in medical ultrasound images using adjusted Canny edge detection algorithm. In 2016 24th Telecommunications Forum (TELFOR), 1-4. https://doi.org/10.1109/TELFOR.2016.7818878
[28] Chen, Z., Zhou, Z., Adnan, S. (2021). Joint low-rank prior and difference of Gaussian filter for magnetic resonance image denoising. Medical & Biological Engineering & Computing, 1-14. https://doi.org/10.1007/s11517-020-02312-8
[29] Hou, Z.Q., Liu, X.Y., Yu, W.S., Ma, S.G. (2019). Improved algorithm of Faster R-CNN based on double threshold-non-maximum suppression. Opto-Electronic Engineering, 2019.
[30] Forcado, M., Estrada, J.E. (2019). Model development of marble quality identification using thresholding, Sobel edge detection and Gabor Filter in a mobile platform. IEEE, 2019. https://doi.org/10.1109/HNICEM.2018.8666359
[31] Nicolaou, M.A., Zafeiriou, S., Kotsia, I., Zhao, G. (2019). Editorial of Special Issue on Human Behaviour Analysis "In-the-Wild". IEEE Transactions on Affective Computing, 10(1): 4-6. https://doi.org/10.1109/TAFFC.2019.2895141
[32] Li, Y., Miao, Q.G., Tian, K., Fan, Y.Y., Xu, X., Ma, Z.X., Song, J.F. (2017). Large-scale Gesture Recognition with a Fusion of RGB-D Data Based on Saliency Theory and C3D model. IEEE Transactions on Circuits and Systems for Video Technology, 119: 187-194. https://doi.org/10.1016/j.patrec.2017.12.003
[33] Cecen, A, Dai, H.J., Yabansu, Y.C., Kalidindi, S.R., Song, L. (2017). Material structure-property linkages using three-dimensional convolutional neural networks. Acta Materialia, 146: 76-84. https://doi.org/10.1016/j.actamat.2017.11.053
[34] Sun, B., Wu, Y., Zhao, K.J., Yu, L.J., Yan, H.Q., Luo, A. (2021). Student Class Behavior Dataset: a video dataset for recognizing, detecting, and captioning students' behaviors in classroom scenes. Neural Computing and Applications, 1-20. https://doi.org/10.1007/s00521-020-05587-y