Omer Akgun
© 2020 IIETA. This article is published by IIETA and is licensed under the CC BY 4.0 license (http://creativecommons.org/licenses/by/4.0/).
OPEN ACCESS
Alcoholism is one of the major health problems in the world. The organ most affected by alcohol is the brain. It has been shown that alcohol causes neuronal loss in the brain and reduces brain blood flow and oxygen use. Electroencephalography is a method that measures the instantaneous electrical activity of the brain. It is known that valuable information can be obtained by observing the biological effects of alcohol through EEG. As their methods of signal processing and analysis have evolved, Electroencephalography signals have attracted the attention of researchers in this field. In this study, methods of the time-frequency analysis were applied to Electroencephalography signals obtained from normal and alcoholic subjects. For this purpose, the Cohen’s class distribution was examined. Ambiguity function analysis, which was in the structure of the distribution, was applied to the signals. Then, from the kernel structure inside the distribution, the Wigner-Ville distribution, which was very common, was reached and this distribution was examined. The inadequacy of the distribution resolution was seen and analysis of the new time-frequency distributions, which were obtained by making convolution with 4 types of kernel functions (nonseparable, separable, Doppler independent, lag independent), was performed. As a result, it was shown that the resolution of time-frequency distributions could be improved with proper kernel functions. Thus, at the end of these analyses, changes that alcohol caused in brain functions were revealed.
alcoholic, EEG, ambiguity function, Wigner Ville distribution, nonseparable kernel, separable kernel, Doppler independent kernel, lag independent kernel
One of the most common abnormalities seen in alcoholics is the shrinkage of the brain. Drinking alcohol causes a significant reduction in brain weight. In cortical neuron counts, neuron loss has been shown to be significant, especially in the frontal cortex [1, 2].
Studies conducted on chronic alcoholics have shown that the frontal cortex is one of the regions where blood flow and oxygen use decrease and the regional decrease in brain blood flow is the greatest [1, 3].
In alcoholics, when the amount of thiamine in the brain decreases, the transketolase enzyme cannot complete its task and the glucose citric acid cycle is broken down into lactic acid. Therefore, enough energy cannot be obtained from glucose, which is the most important energy source of the brain.
GABA (Gamma-Aminobutyric acid) is the most important inhibitory neurotransmitter of the central nervous system and performs hyperpolarization by increasing the passage of chlorine into neurons. Alcohol depresses neurons by stimulating GABA, forming a complex with the GABA receptor, and inhibiting the release of noradrenaline from the locus coeruleus. This event can explain the depressing effect of alcohol by GABA mechanism [1, 4, 5].
Electroencephalography (EEG) is considered valuable as a non-invasive electrophysiological method in the investigation of the biological aspect of alcoholism [6]. EEG is an examination method in which spontaneous electrical activity of the brain is recorded through electrodes. This review reflects the functional state of the brain at the time rather than its structural features. Therefore, despite improvements in structural imaging methods (CT, MRI), it still maintains its importance. In particular, in clinical tables where there is no pathological evidence reflected in structural examination methods, the importance of the EEG increases even more [7].
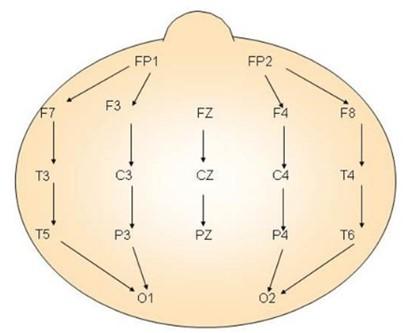
The postsynaptic potentials that constitute the source of the EEG are collected in the cortex, spread through the structures surrounding the brain to the scalp with hair and recorded from the scalp via metal electrodes. The location of each electrode covered with a conductive material is determined by standard measurements performed on nasion, inion, right and left preauricular points and they are placed according to the international 10-20 system (Figure 1) [7-9].
Figure 1. Layout of electrodes in EEG
The EEG enables the examination of changes in cognitive activity in millisecond-level. While neurons are processing information and integrating their communication between each other, they generate electrical discharges at a time-resolution of milliseconds. When considered in terms of the oscillative approach, these electrical discharges that recur over time are called EEG frequencies. Traditionally, between 0.5-3.5 Hz is called as delta (δ), between 3.5-7 Hz as theta (θ), between 8-14 Hz as Alpha, between 15-30 Hz as beta (β), and between 30-48 Hz as gamma (γ). The traditional approach states that delta occurs during sleep, theta occurs during superficial sleep, alpha occurs when eyes are closed but not sleeping, a beta occurs when eyes are open, awake, and during a cognitive task or muscle activity. The oscillative approach also examines these frequencies according to the lower frequencies. According to the oscillative approach, various sensory and cognitive functions are associated with these frequencies. For example, the delta is associated with memory, theta is associated with attention, alpha is associated with memory and attention, beta is associated with cortical arousal, and gamma is associated with the processing of sensory and cognitive information [10, 11].
The most common findings obtained from alcoholics are the increase in theta and beta activity in EEG. The findings on alpha activity are not consistent. Changes in beta activity amplitude have also been observed frequently in the intimates of alcoholics. These pieces of information indicate that some biological factors play a role in the development of alcoholism [6]. The conducted studies mention a relationship between alcohol dependence and low-voltage EEG. In another study, in alcohol addicts, delta and theta decelerations, which were not observed in normal EEG individuals and were or were not accompanied by Alpha deceleration, were identified. It was said that delta and theta decelerations might be a specific indicator of a disorder in brain function. It is still not clear whether the decreased alpha activity seen in alcohol addicts develops as a result of the alcohol addiction, or whether it is a risk factor in the development of alcohol addiction [12-14].
As the techniques in the signal analysis have developed, EEG signals have attracted the attention of experts in this field and begun to be the subject of a variety of research. In order to infer detailed information from signals whose frequency changes over time, it is necessary to examine these signals at the same time in both regions, not just in the time or frequency region. Criteria such as how the frequency of signals changes over time, speed of change and time-frequency bandwidths give us detailed information about the characteristic of the signal. Examining both regions at the same time (that is, time-frequency signal processing), which allows us to learn more about the signal, is a fundamental research topic for all these application areas [15, 16]. In such analyses, the Short-Time Fourier Transform (STFT) and Wigner-Ville Distribution (WVD) are generally used. STFT is a linear and relatively easy transformation. However, in STFT, a good resolution requires an appropriate window selection, and high resolution cannot be achieved on both the time and frequency axis at the same time. On the other hand, WVD is a distribution that provides fairly high resolution in addition to its many other good features. However, due to its quadratic structure, it contains cross-terms alongside the main signal components that we want to identify [17, 18]. These cross-terms disrupt the identifiability of the signal. For this reason, the distribution, which is called the Cohen class and is a generalization of WVD, is used. The goal in such distributions is to destroy cross-terms by designing the kernel of the Cohen class distribution and to obtain a time-frequency distribution whose resolution is high [17, 19]. Cohen class distributions, such as Wigner Ville and Choi Williams, are defined in the weighted integral form. Cohen class distributions, such as Wigner Ville and Choi Williams, are defined in the weighted integral form and these weighting functions are called kernel [20]. In this study, using WVD, the effect of 4 types of kernels (nonseparable, separable, Doppler independent, lag independent) on cross-terms was observed.
The data used in the study was taken from the UCI KDD Archive. 1-second recordings at 256 Hz sampling frequency were obtained from 64 electrodes placed on the scalp of healthy and sick individuals. The control and alcoholic subjects were subjected to a stimulus (showing themselves a picture) and recordings were taken [21]. In the study, the signals obtained from the C4 electrode (Figure 1) were analyzed.
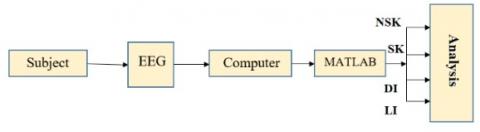
In Figure 2, the basic approach used in the study is given as a block diagram. The signs taken from the subjects via EEG are transferred to the computer environment. Later, with the MATLAB program, the distributions of NSK (Nonseparable Kernel), SK (Separable Kernel), DI (Doppler-independent kernel) and LI (Lag-independent kernel) were obtained and these distribution gaps were analyzed.
Figure 2. Block diagram of the study
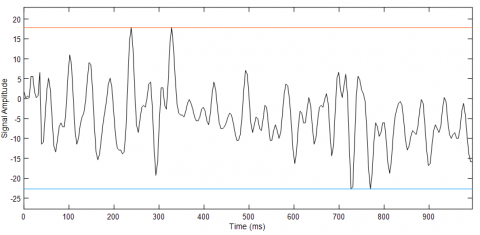
2.1 EEG signal with running minimum and maximum
(a) Control subject
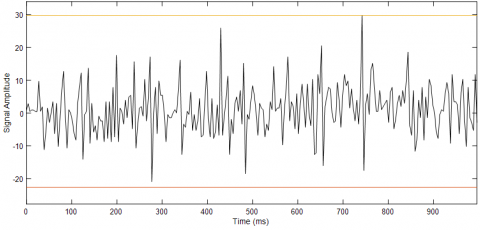
(b) Alcoholic subject
Figure 3. EEG graphs with running Min and Max
The EEG graph for the control subject oscillates in the range of minimum and maximum (18, -22). Compare to the control subject, the EEG graph of the alcoholic subject shows oscillations that have a higher amplitude and in the range of 30 and -20. The most noticeable distinguishing issue compared to the normal is the excess increase in the number of peaks. In other words, it is observed that the period of alcoholic subjects gets smaller (Figure 3).
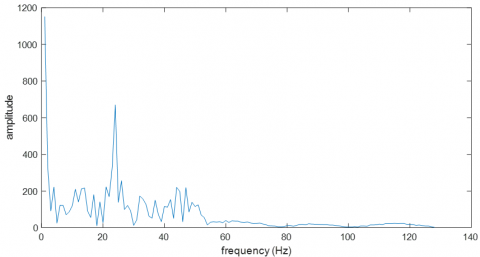
2.2 Spectral amplitudes of the EEG signal
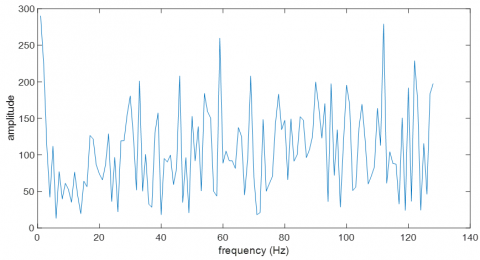
In the EEG amplitude spectrum of the control subject, two main components at origin and 25 Hz take place with their high amplitudes (approximately 1180 and 650 units). The components terminate at around 55 Hz. The most notable feature in the EEG amplitude spectrum of the alcoholic subject is the spreading of the components to the entire frequency plane in large numbers. In addition, the amplitudes of the components are much lower than that of normal (maximum 280 units). Briefly, the normal sign is a regular sign with a bandwidth of about 50 Hz, while the alcoholic sign is a complex spectrum that spreads to the whole plane (Figure 4).
(a) Control subject
(b) Alcoholic subject
Figure 4. EEG amplitude spectrums
2.3 Cohen distribution, ambiguity function and WVD
The most useful time-frequency distributions (TFD) are TFDs called as quadratic or bilinear (QTFD). The main member of this class is WVD, and all other TFDs (such as Choi-Williams, Zhao-Atlas-Marks, Born-Jordan) are smoothed versions of WVD. Again, all these TFDs are members of Cohen's bilinear class. A Cohen-class distribution is a two-dimensional Fourier transform (Eq. (1)) of the weighted version of the symmetric ambiguity function (AF) of the signal to be analyzed.
$C(t, f)=\iint_{-\infty}^{\infty} A(v, \tau) \Phi(v, \tau) e^{-j 2 \pi \theta t-j 2 \pi f t} d v d \tau$ (1)
The AF is identified as follows.
$A(v, \tau)=\int_{-\infty}^{\infty} x\left(u+\frac{\tau}{2}\right) x^{*}\left(u-\frac{\tau}{2}\right) e^{j v u} d u$ (2)
In Eq. (1) and (2), t is time, f is frequency, τ is time lag, v is frequency lag, and u is the additional integral time variable. The weight function Φ(v,τ) is called the kernel of the distribution.
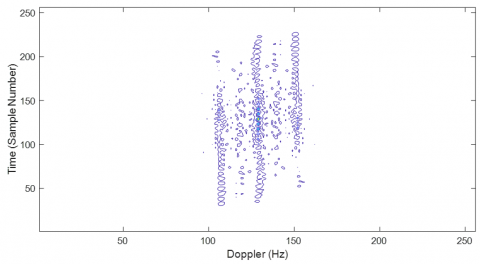
(a) Control subject
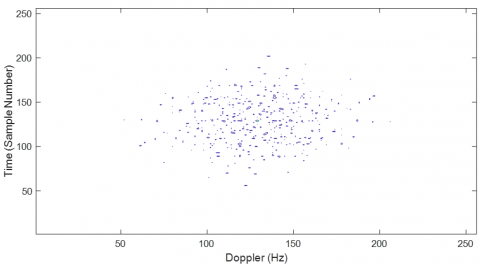
(b) Alcoholic subject
Figure 5. Ambiguity functions of the EEG signals
In AF of the control subject, there are 3 Bar formations extending along the time axis in the range of 100-160 Hz. The AF of the alcoholic subject, on the other hand, draws attention by small multi-part formations. Here, normal subject AF shows the uniform distribution, while alcoholic AF is spreading as distorted distribution (Figure 5.a, b). AFs are symmetric functions.
The properties of a bilinear TFD are determined by its kernel function. Because AF is a bilinear function of the signal, unintended cross-terms occur. This causes the resolution of the TFD to decrease and the interpretation of it to become difficult. To prevent this and suppress unwanted signals, a kernel is selected for weighting AF.
The kernel of WVD, which is the simplest and most important of the Cohen class bilinear TFDs, is Φ(v,τ)=1 and is expressed as in Eq. (3) [22-24].
$W V D(t, f)=\int_{-\infty}^{\infty} x\left(t+\frac{\tau}{2}\right) x^{*}\left(t-\frac{\tau}{2}\right) e^{-j 2 \pi f \tau} d \tau$ (3)
WVD does not form a cross-term when the sign x(t) in Eq. (3) is single-component, whereas when there is a multi-component sign like x(t)=s1(t)+s2(t), the expression WVD becomes as follows due to its quadratic structure.
$W V D_{x}(t, f)=W V D_{s_{1}}(t, f)+W V D_{s_{2}}(t, f)+$$2 \operatorname{Re}\left\{W V D_{s_{1}, s_{2}}(t, f)\right\}$ (4)
The $2 \operatorname{Re}\left\{W V D_{s_{1}, s_{2}}(t, f)\right\}$ component in Eq. (4) distorts the intelligibility of the distribution by producing cross-term [15, 25, 26].
(a) Control subject
(b) Alcoholic subject
Figure 6. WVD of the EEG signals
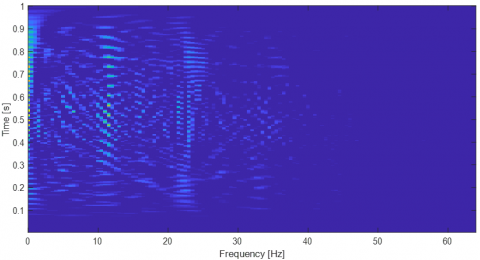
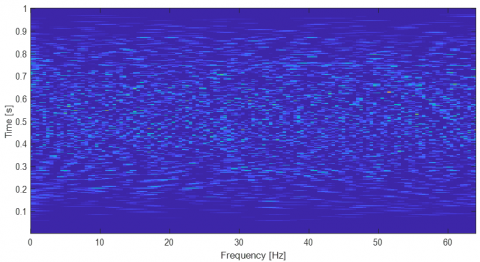
In the WVD of the control subject, 3 illuminated regions are extending along the time axis in the region of 0.10 and 22 Hz. In the WVD of the alcoholic subject, on the other hand, there are multi-part illuminated regions that spread to the entire plane. It appears that the cross-terms mentioned above distort the resolution of the WVD and mask the main components. Although it shows itself in the distribution in AF, which is in the structure of WVD, the resolution of the main components is bad (Figure 6).
2.4 TFDs with kernel structure
To suppress cross-terms, a new time-frequency distribution is created by convoluting WVD with a kernel function (Eq. (5)).
$\rho_{x}(t, f)=W V D_{x}(t, f) * * \gamma(t, f)$ (5)
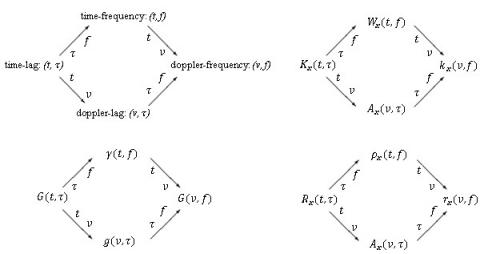
In Eq. (5), γ(t,f) is the kernel function of WVD and ** is convolution [27-29]. In addition, Equation 5 can be expressed by one of three dimensions (time-lag (t, τ), Doppler-frequency (v, f), and Doppler-lag (v, τ) (Figure 7)) [30].
The kernel structures used in quadratic TFDs are shown in Figure 8 [30].
$g(t, \tau)$ are nonseparable kernels known as the most general state of kernel structures. They are filter structures showing exponential distribution (Eq. (6)) [31]. In this study, the function of $\frac{\sqrt{\pi \sigma}}{|\tau|} e^{-\pi^{2} \sigma t^{2} / \tau^{2}}$ was used as a nonseparable kernel.
Figure 7. The transition of time-frequency presentation with other dimensions
Figure 8. Kernel types used in QTFDs
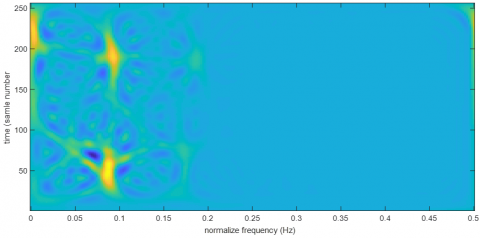
(a) Control subject
(b) Alcoholic subject
Figure 9. EEG signals’ TFD with nonseparable kernel
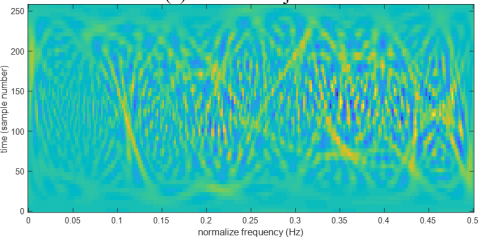
In the control subject TFD with the nonseparable kernel, 3 main components, masked in the WVD (Figure 6(a)), have become observable. In the alcoholic subject's TFD, some high-frequency components masked completely in WVD have become perceivable although they are very inadequate (Figure 9).
A simple way to design kernel filters for QTFDs is to consider the special state of a separable kernel (Eqns. (6)-(9)) [30]. In practice, in a separable kernel design, its positivity property is neglected for higher resolution and for the fact that TFD can be interpreted as a (t, f) gradient of energy. A nonconstant separable kernel can be designed as a LI and DI kernel (a TFD without WVD; and with or without amplitude scaling), whereas a separable kernel can be designed as neither a LI nor a DI [32].
In this study, the function of $|\tau|^{\beta} \cosh ^{-2 \beta} t$ was used as a separable kernel.
$g(v, \tau)=G_{1}(v) g_{2}(\tau)$ (6)
$G_{1}(v)=\mathcal{F}\left\{g_{1}(t)\right\}$ (7)
$G_{2}(f)=\mathcal{F}\left\{g_{2}(\tau)\right\}$ (8)
$\rho_{x}(t, f)=g_{1}(t) * W V D_{x}(t, f) * G_{2}(f)$ (9)
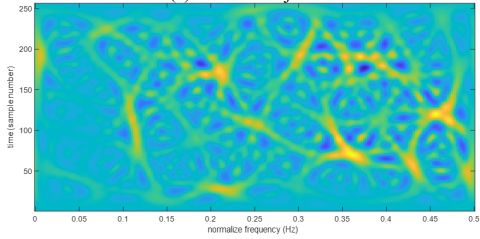
(a) Control subject
(b) Alcoholic subject
Figure 10. EEG signals’ TFD with separable kernel
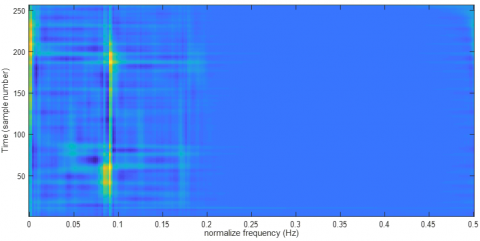
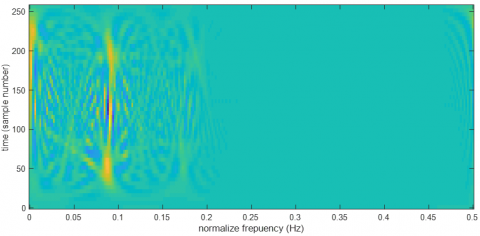
The three main components at low frequencies were observed very clearly in the control subject’s TFD with the separable kernel. The main components that spread across the entire plane in the TFD of the alcoholic subject and emerged especially at high frequencies were able to be monitored with high resolution (Figure 10).
The Doppler-independent kernel (DI) is a special state of the separable kernel obtained using the constant $G_{1}(v)$ (Eqns. (10)-(13)) [30]. A TFD with DI kernels provides realness, time marginal, time support and IF features. However, the DI kernel does not display frequency marginal, frequency support, or spectral delay characteristics despite a smoothing along the frequency axis [32].
In this study, the function of $\delta(t) w(\tau)$ was used as the DI kernel. $w(\tau)$ is a window function that is real and dual.
$G_{1}(v)=1$ (10)
$g(v, \tau)=g_{2}(\tau)$ (11)
$g_{1}(t)=\delta(t)$ (12)
$\rho_{x}(t, f)=G_{2}(f) * W V D_{x}(t, f)$ (13)
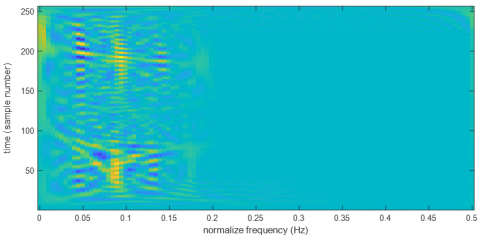
(a) Control subject
(b) Alcoholic subject
Figure 11. EEG signals’ TFD with Doppler-independent kernel
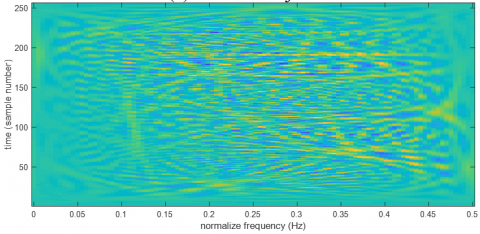
In the control subject's TFD with DI kernels, the main components at low frequencies are seen at a lower resolution compared to the TFD with separable kernels. The same situation, with a lower resolution, is true also for the TFD of the alcoholic subject (Figure 11).
The Lag-independent kernel (LI) is another special state of the separable kernel obtained using the constant $g_{2}(\tau)$ (Eqns. (14)-(17)) [30]. A TFD with LI kernel can fulfil the realness, frequency marginal, frequency support and spectral delay features. However, LI kernel is not suitable for the IF features despite smoothing performed along the time marginal, time support, or time axis [32].
In this study, the function $\frac{\cosh ^{-2 \beta} t}{\int_{-\infty}^{\infty} \cosh ^{-2 \beta} \xi d \xi}$ was used as the LI kernel.
$g_{2}(\tau)=1$ (14)
$g(v, \tau)=G_{1}(v)$ (15)
$g(v, \tau)=G_{1}(v)$ (16)
$\rho_{x}(t, f)=g_{1}(t) * W V D_{x}(t, f)$ (17)
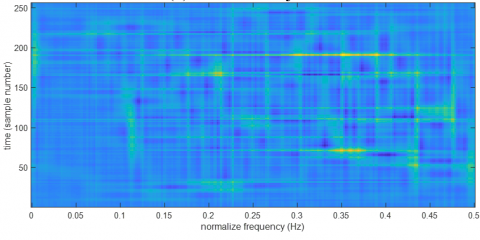
While in the control subject TFD with LI kernels, the resolution of 3 main components with low frequency is slightly better compared to the DI kernel structure, it is much poor compared to the separable kernel structure. The same issue is also true for the TFD of the alcoholic subject (Figure 12).
In Table 1, the TFDs used in the study are presented together with kernel functions and their performance.
The success of the methods used in this study was evaluated according to the solubility performance of the main components in the distributions. Accordingly, the most successful resolution was observed in the separable kernel distribution. Three main components centred (0, 225), (0.08, 50) and (0.09, 195) in a normal subject, and more than 10 major components distributed over the whole plane in the alcoholic subject (e.g. (0.2, 172), (0.35, 73) … Components with central coordinates) can be detected with good resolution compared to other kernel distributions (Figure 10).
(a) Control subject
(b) Alcoholic subject
Figure 12. EEG signals’ TFD with lag-independent kernel
Table 1. TFDs used in the study
|
TFD |
Kernel Function |
Resolution Performance |
|
WVD |
1 |
Very Poor |
|
Nonseparable Kernel |
$\frac{\sqrt{\pi \sigma}}{|\tau|} e^{-\pi^{2} \sigma t^{2} / \tau^{2}}$ |
Poor |
|
Separable Kernel |
$|\tau|^{\beta} \cosh ^{-2 \beta} t$ |
Good |
|
DI Kernel |
$\delta(t) w(\tau)$ |
Poor |
|
LI Kernel |
$\frac{\cosh ^{-2 \beta} t}{\int_{-\infty}^{\infty} \cosh ^{-2 \beta} \xi d \xi}$ |
Poor |
Alcoholism is one of the most common health problems. One of the organs that it causes the greatest damage is the brain. It is possible to detect these biological changes by using EEG. In this study, EEG signals were obtained from normal and alcoholic subjects, time-frequency analyses were applied to these signals and differences were determined with the best resolution.
First, EEG Signal with Running Minimum and Maximum were examined. It was determined that the extensions of signals of the alcoholic were higher and that their period was much lower than normal. In contrast to the normal signal, whose spectral amplitude consists of two main components, the alcoholic subject has numerous spectral components that spread over the entire plane.
The Cohen class TFD structure was used in this study. This structure consists of AF and kernel function. When the ambiguity functions of the signals were examined, although there was a smooth bar structure in the normal signal, the alcohol showed its effect with its multipart structure.
Kernel functions are filter structures that affect the resolution of TFD. The structure in which the kernel function in the Cohen relation is 1 is WVD, which is widely used and has many versions. In WVD analysis of signals, the main components at low frequencies in the control subject and the components spreading to the entire plane in the alcoholic subject are barely noticeable with a very poor resolution.
To solve the resolution problem, four different kernels (nonseparable, separable, DI, LI) were tested for the WVD structure. In the nonseparable TFD analysis, the main components (3 main components at low frequencies) for the control subject became more noticeable. For the alcoholic subject, on the other hand, the resolution was worse than normal. In the separable TFD analysis, cross-terms were better suppressed, and the main components for the normal and alcoholic subjects were clearly revealed. The TFD of the control subject's EEG had 3 main components at low frequencies and the TFD of the alcoholic subject's EEG had many major components, especially at high frequencies, that spread across the entire plane. The effect of alcohol was seen with these components that spread all over the plane. In this study, it was also figured out that in the DI and LI TFD structures, the resolution was poor compared to the separable TFD structure. Consequently, it can be said that in TFD analysis of normal and alcoholic subjects' EEGs, the optimal structure is TFDs that have separable kernel structure.
[1] Eggleton, M.G. (1941). The effect of alcohol on the central nervous system. British Journal of Psychology, 32(1): 52-61.
[2] Zahr, N.M., Pfefferbaum, A. (2017). Alcohol's effects on the brain: Neuroimaging results in humans and animal models. Alcohol Research: Current Reviews, 38(2): 1-24.
[3] Erdogan, E., Vardar, G., Altun, D., Fırat, M.F. (2018). Assessment of regional cerebral blood flow in patients with early and late onset alcohol dependence: SPECT study. Journal of Surgery and Medicine, 2(3): 257-261. https://doi.org/10.28982/josam.420428
[4] Prisciandaro, J.J., Schacht, J.P., Brenner, H.M., Anton, R.F., Prescot, A.P., Renshaw, P.F., Brown, T.R. (2019). Intraindividual changes in brain GABA, glutamate, and glutamine during monitored abstinence from alcohol in treatment-naive individuals with alcohol use disorder. Addiction Biology, e12810. https://doi.org/10.1111/adb.12810
[5] Koulentaki, M., Kouroumalis, E. (2018). GABA(A) receptor polymorphisms in alcohol use disorder in the GWAS era. Psychopharmacology, 235(6): 1845-1865. https://doi.org/10.1007/s00213-018-4918-4
[6] Karaaslan, M.F., Orhan, F.O. (2005). EEG and ERP in alcoholism. Turkiye Klinikleri J Int Med Sci., 1(47): 18-27.
[7] Baykan, B., Altındağ, E., Available online: http://www.itfnoroloji.org/semi2/eeg.htm, accessed on 28 February 2020.
[8] Akbari, H., Esmaili, S.S. (2020). A novel geometrical method for discrimination of normal, interictal and ictal EEG signals. Traitement du Signal, 37(1): 59-68. https://doi.org/10.18280/ts.370108
[9] Milnik, V. (2009). Instruction of electrode placement to the international 10-20-system. Neurophysiologie-Labor, 31(1): 1-35. https://doi.org/10.1016/j.neulab.2008.12.002
[10] Bayazıt, T.O., Bozkurt, M.A., Güneş, M.E., Hatipoğlu, S.S. (2018). The neuroelectric activity of the brain in extracorporeal circulation: Preliminary results. Medical Journal of Bakirkoy, 14(4): 427-432. https://doi.org/10.4274/BTDMJB.20180728081335
[11] Barry, R.J., De Blasio, F.M., Karamacoska, D. (2019). Data-driven derivation of natural EEG frequency components: An optimised example assessing resting EEG in healthy ageing. Journal of Neuroscıence Methods, 321: 1-11. https://doi.org/10.1016/j.jneumeth.2019.04.001
[12] Yavaş, G., Arıkan, Z., Bilir, E. A preliminary study on EEG disorder in children of alcohol addicts. Gazi University Faculty of Medicine, Department of Psychiatry, Available online: www.alopsikolog.net, accessed on 28 February 2020.
[13] Gopan, K.G., Sinha, N., Jayagopi, D.B. (2019). Alcoholic EEG analysis using Riemann geometry based framework. 27th European Signal Processing Conference (EUSIPCO), A Coruna, Spain. https://doi.org/10.23919/EUSIPCO.2019.8902506
[14] Cao, R., Deng, H., Wu, Z., Liu, G., Guo, H., Xiang, J. (2017). Decreased synchronization in alcoholics using EEG. IRBM, 38(2): 63-70. https://doi.org/10.1016/j.irbm.2017.02.002
[15] Aldırmaz, S. (2012). New communication and adaptive system designs by time frequency distributions and fractional fourier transform. PhD. Thesis, Yildiz Technical University, Istanbul, Turkey.
[16] Boashash, B. (2015). Time-frequency signal analysis and processing. Academic Press, London, UK.
[17] Deprem, Z., Cetin, A.E. (2015). Kernel estimation for time-frequency distributions using epigraph set of L1-NORM. 23rd European Signal Processing Conference (EUSIPCO), Nice, France, pp. 1491-1495. https://doi.org/10.1109/EUSIPCO.2015.7362632
[18] Flandrin, P. (2018). Explorations in Time-Frequency Analysis. Cambridge University Press, Cambridge, UK.
[19] Orovic, L., Stankovic, S., Jokanovic, B. (2013). A suitable hardware realization for the Cohen class distributions. IEEE Trans. Circuits and Systems II, 60(9): 607-611. https://doi.org/10.1109/TCSII.2013.2273724
[20] Zhang, B., Sato, S. (1994). A time-frequency distribution of Cohen's class with a compound kernel and its application to speech signal processing. IEEE Transactions on Signal Processing, 42(1): 54-64. https://doi.org/10.1109/78.258121
[21] Available online: http://kdd.ics.uci.edu/databases/eeg/eeg.data.html accessed on 28 February 2020.
[22] Thomas, M., Jacob, R., Lethakumary, B. (2012). Comparison of WVD based time-frequency distributions. International Conference on Power, Signals, Controls and Computation Power, (EPSCICON), Thrissur, Kerala, India. https://doi.org/10.1109/EPSCICON.2012.6175242
[23] Thomas, M., Lethakumary, B., Jacob, R. (2012). Performance comparison of multi-component signals using WVD and Cohen's class variants. International Conference on Computing, Electronics and Electrical Technologies (ICCEET), Kumaracoil, India, pp. 717-722. https://doi.org/10.1109/ICCEET.2012.6203869
[24] Wang, H.B., Long, J.B., Zha, D.F. (2013). Pseudo Cohen time-frequency distributions in infinite variance noise environment. Applied Mechanics and Materials, 475(1): 253-258. https://doi.org/10.4028/www.scientific.net/AMM.475-476.253
[25] Aiordachioaie, D., Popescu, T.D. (2017). A method to detect and filter the cross terms in the Wigner-Ville distribution. International Symposium on Signals, Circuits and Systems (ISSCS), Iasi, Romania. https://doi.org/10.1109/ISSCS.2017.8034878
[26] Jabczyński, J. Gontar, P., Gorajek, L. (2020). Wigner transform approach to dynamic-variable partially coherent laser beam characterization. Bulletin of the Polish Academy of Sciences: Technical Sciences, 68(1): 141-146. https://doi.org/ 10.24425/bpasts.2020.131840
[27] Mesbah, M., O'Toole, J.M., Colditz, P.B., Boashash, B. (2012). Instantaneous frequency based newborn EEG seizure characterisation. Eurasip Journal on Advances in Signal Processing. https://doi.org/10.1186/1687-6180-2012-143
[28] O'Toole, J.M., Mesbah, M., Boashash, B., Colditz, P. (2007). A new neonatal seizure detection technique based on the time-frequency characteristics of the electroencephalogram. 9th International Symposium on Signal Processing and Its Applications, ISSPA, Sharjah, United Arab Emirates. https://doi.org/10.1109/ISSPA.2007.4555347
[29] O'Toole, J.M., Mesbah, M., Boashash, B. (2007). A computationally efficient implementation of quadratic time-frequency distributions. 9th International Symposium on Signal Processing and Its Applications, ISSPA, Sharjah, United Arab Emirates. https://doi.org/10.1109/ISSPA.2007.4555346
[30] Boashash, B. (2015). Theory and Design of High-Resolution Quadratic TFDs. In Time-Frequency Signal Analysis and Processing: A Comprehensive Reference; B. Boashash, Elsevier Inc., London, UK.
[31] Boashash, B. (2015). Heuristic Formulation of Time-Frequency Distributions. In Time-Frequency Signal Analysis and Processing: A Comprehensive Reference, Elsevier Inc., London, UK.
[32] Boashash, B., Putland, G.R. (2015). Design of high-resolution quadratic TFDs with separable kernels. Time-Frequency Signal Analysis and Processing: A Comprehensive Reference, B. Boashash, Elsevier Inc., London, UK.