Serdar Gündoğdu* | Ebru Apaydın Doğan | Evrim Gülbetekin | Ömer Halil Çolak | Övünç Polat
© 2019 IIETA. This article is published by IIETA and is licensed under the CC BY 4.0 license (http://creativecommons.org/licenses/by/4.0/).
OPEN ACCESS
In this study, it is aimed to determine the effects of different modes N-back test which is one of the measurement tools frequently used in measurement of working memory, on the Electroencephalography (EEG) and Eye-tracker data. Eight healthy volunteers participated in this study. The volunteers performed tasks inducing stress and mental fatigue for almost 4 minutes. Each experimental task consists of 72-seconds stress and fatigue inducing 1-position back, 2-position-color and 2-position-image test sessions and three evaluation sessions performed for task. During these sessions, the volunteers were assessed using EEG, Eye Tracker and Visual analogue scale (VAS). VAS was also used to evaluate perceived stress and mental fatigue before and after the N-back test. Power values of EEG signals from volunteers for different test modes were evaluated according to test scores in theta, alpha, beta, and low gamma bands. According to the obtained results, the power values in each subband of the EEG change according to the test mode and the test scores. Beta, alpha and theta frequency bands’ power in the frontal cortex (AF7+AF8) increased with the n back test score and difficulty level of the game. When the task gets harder, it shows that the heat map of eye tracking is spread over a wider area. The VAS scores for both mental fatigue and stress increased after the N-back test with low and high test scores. According to the graphical results obtained from EEG with subjective evaluation, stress and mental fatigue increased with N-back tests. These results help understanding of the physiological changes of stress and mental fatigue and contribute to improve new approaches to assess stress and mental fatigue.
electroencephalography, eye tracking, wavelet transforms, N-back test
The working memory term means to a brain system that supplies temporary storage and manipulation of information necessary for complex cognitive tasks [1].
The working memory is a controlled attention that is responsible for keeping the information in memory for a long time and for protecting it against interference. The memory capacity is the term used to describe the functioning of the working memory system at the level of individual differences.
Working memory ability has been described as a significant constituent of complex academic skills, containing written expression, reading comprehension, language comprehension and mathematical computation in literature.
The researchers used behavioural measures that reliably revealing their neural activation patterns and can easily be correlated with the process of cognitive processing. Computerised measures such as the N-back tests are well convenient for this aim. The N-back tasks have become prototypical measures in functional neuroimaging studies of working memory [2].
Physiological measures can be used for continuous monitoring of workload levels. The most important physiological areas to measure workload in the literature are cardiac activity, eye activity, respiratory activity, brain activity and speech measures.
It may be useful in environments to monitor performance level in cognitive tasks. The EEG has the potential to identify changes in cognitive load in tasks that require continuous and intensive attention distribution. EEG waveforms generally are classified to their amplitude, frequency, and shape. Frequency-dependent classification is most preferred [3].
It is reported that there is a correlation between work or memory workload and EEG power values in theta and alpha bands. Behavioural measures verify that differences in workload are really practiced with an increase in N-back level, task performance decreases and subjective workload increases [4]. In the literature, alpha has been considered to indicate mental effort since the decrease in alpha band power is related to an increase in workload [5-8]. Although the affected region changes depending on the task and modality, alpha reduction in parietal regions is observed in effortful and attentive processing [9, 10].
EEG theta (4–8 Hz) band has been related with workload. In some studies, evidences of the relationship between theta and mental effort or working memory processes have been presented [11-13]. Theta energy rises as task requirements increase [14-17]. The increase of theta activity is most profound on frontal electrode locations.
Eye tracking and head movement detection are widely investigated. They are considered because they provide easier usage than other methods such as EEG / ECG signals [18]. The relevance between eye movements and brain processes (cognition etc.) is known for a long time. The authors [19] determine whether users are looking at the proper objects from the collected eye-movement data. There are various techniques for visualizing the data recorded by using eye-tracker such as provide a simple plot of the pupil’s coordinates to time and plot raw eye movements in 2-D with the stimulus image as the background [20].
Fixation maps use/present the information in a more proper. Generally, fixations are represented by using circles, and saccades are represented with lines connecting the circles [21].
VAS (10-point scale) is also designed to assess perceived stress before and after the N-back test. This scale is especially well suited for the clinical evaluation of the self-reported stress [22].
The aim of this study is to examine the eye movement’s behaviour and brain electrical signals during the N-back task in different modes, to compare the results and to associate the results with successfully.
2.1 Ethic statement
The study was approved by the Medical Ethical Committee of the Akdeniz University and the experiment was undertaken in compliance with national legislation and the Declaration of Helsinki.
2.2 Participants
Eight adults (2 female and 6 male) with a mean of 31± 7.3 (mean ± standard deviation) years, ranging from 24 to 41 years, took in the experiment. All of the volunteers had normal sleeping patterns, had normal or corrected-to-normal vision, no history of psychiatric complaints and were right hand.
2.3 Experiment design and acquisition systems
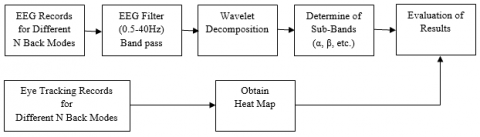
SParticipants assessed stress and mental fatigue using VAS before and after the N-back test. Participants were applied N-Back test while EEG and Eye Tracker signals were recorded. An outline of the aimed process is shown in Figure 1.
A published study [23], indicates that a memory task called dual N-back develops working memory (short-term memory) and fluid intelligence. N-Back is a game based on a scientifically proven way of improving intelligence, memory and the ability to focus.
Barker and Bialystok [24] proposed to processed differences among bilingual and monolingual young adults on an emotion N-back task. Pergher et al. [25] reported on a study on mental workload where young and older adults executed an N-Back task. Results of referred study were displayed differences in P300 amplitude, theta and alpha band power during N-Back test in young and older.
Figure 1. The outline of the experimental task
We used an open source software is called Brain Workshop, v.4.8.1 [26]. Participants completed three N-back tasks (Position single task, Position-Color 2-Back task and Position-Image 2-Back task, respectively). In each task level, a total of 24 trials were presented, wherein each one appeared after every 3 seconds. Switching from one task level to other was marked by a rest period three minutes.
Figure 2. A sample screenshot for position 1-back task
N-back is a memory test in which N indicates that previous stimuli should be remembered. Firstly, a square was appeared every 3 seconds in one of nine different positions on a regular grid on the screen. The participant has to respond by using the keyboard when the position of the currently displayed frame is the same as the one previously presented. This type of a workload is comparable to monotonous monitoring tasks where the participant has to maintain his attention at the same level task (“1-back position”) [27]. A sample screenshot for position 1-Back task is shown in Figure 2.
Position, Color 2-Back task means that the spatial and color visual stimulus are presented at the same time. Two memory tests were performed at the same time, and the previous two (2) spatial and color (red, blue, green, black, yellow etc.) targets should be remembered separately.
Position, Image 2-Back task means that the spatial and image visual stimulus are presented at the same time. Two memory tests were performed at the same time, and the previous two (2) spatial and image targets should be remembered separately.
If the position/color or position/image of the currently displayed frame is the same as the previous two targets, the gamer must press appropriate button.
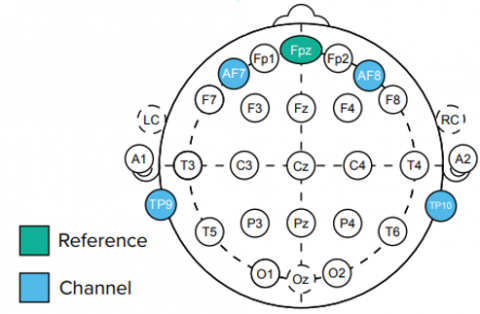
Figure 3 shows Muse electrode locations. This brain sensing headband is a technology of electroencephalography. EEG is non-invasive and harmless method for recording the electrical activity of groups of brain cells.
The used EEG headband (Muse EEG headband) has 5 electrodes: a FPz reference electrode and 4 electrodes which can be measured from AF7, AF8, TP9, TP10 (in the international 10-20 system) regions located in the frontal and temporal cortex of the brain.
Figure 3. EEG electrodes locations [28]
For eye tracking record, we used a Tobii Dynavox PCEye Mini eye tracker, which has eye tracking (gaze point, eye position, etc.) IR image stream at 30 Hz. The mobile EEG device was attached to the subjects and the eye tracker was calibrated to eye gaze.
2.4 Signal processing
The EEG and eye gaze signals were recorded respectively for participants during the performance of playing N-Back test.
EEG signals were acquired with a sampling frequency of 256 Hz. They were then filtered using Butterwoth bandpass filter. These signals were decomposed using the 6-level wavelet with Daubechies 4 (db4). Daubechies level 4th (db4) has the smallest error value in the EEG signal processing compared to other types of mother wavelet [29, 30]. Db4 decomposition of an EEG data with 6 levels of details (D1 … D6). The sub-band ranges in Hz are approximately: D1=64-128 Hz; D2=32-64 Hz; D3=16-32 Hz; D4=8-16 Hz; D5=4-8 Hz; D6=0-4 Hz; A6=0-4 Hz [31]. Then, the EEG data were divided into the lower frequency bands shown in Table 1. Finally, the power values of these subbands were calculated logarithmically.
Table 1. EEG frequency bands
|
EEG Bands |
Frequency Range (Hz) |
|
Low Gamma (γ) |
32-40 Hz |
|
Beta (β) |
16-32 Hz |
|
Alpha (α) |
8-16 Hz |
|
Theta (θ) |
4-8 Hz |
|
Delta (δ) |
0.5-4 Hz |
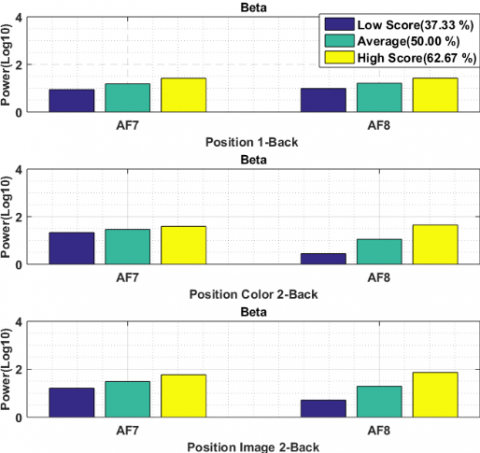
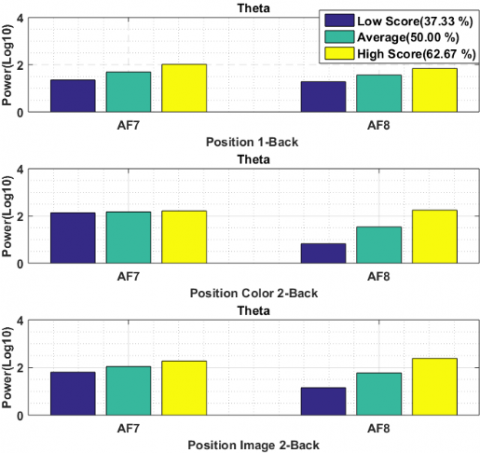
In the study, power values of EEG signals from participants for different modes of N-back test were evaluated according to test scores in theta, alpha, beta and gamma bands. EEG data of 2 participants were corrupted. Therefore, the EEG data analysis was assessed using only 6 participants' data. Figure 4 shows the variation of the power of the EEG signals received during the N-back test, for the different bands, the average of all 6 participants, and the average of 3 participants with the highest and lowest scores.
(a)
(b)
(c)
(d)
Figure 4. The variation of the power of the EEG signals received during the N-back test (a) gamma, (b) beta, (c) alpha, (d) theta bands
As shown in Figure 4, the power average of the EEG signals of 3 participants with the highest test score for all bands is higher than the average of the 3 participants with the lowest score. Also, the difference between the average of the power values of 3 participants with the highest and lowest scores is high in all bands in the AF8 channel for all modes of N-Back test.
In N-back tasks, attendees can either correctly press a button in response to targets, incorrectly press a button in response to non-targets, and incorrectly do not press a button in response to targets [32]. Scores were calculated as the number of correct responses divided by the sum of the whole responses. Results of the Position 1-Back (Task I), Position Color 2-Back (Task II), and Position Image 2-Back (Task III) scores are shown in Table 2.
Figure 5 shows that n the change of the power of the EEG signals according to the average of all 6 participants for different N-back tests and frequency sub-bands.
Table 2. Results of the N-back scores
|
Volunter |
SCORES |
||||
|
Task I |
Task II |
Task III |
|||
|
1 |
100 |
81 |
Mean: 62.67 |
Mean: 50.00 |
56 |
|
2 |
100 |
57 |
29 |
||
|
3 |
100 |
50 |
23 |
||
|
4 |
100 |
46 |
Mean: 37.33 |
15 |
|
|
5 |
100 |
37 |
41 |
||
|
6 |
100 |
29 |
21 |
||
|
7 |
100 |
54 |
* |
57 |
|
|
8 |
100 |
45 |
22 |
||
|
Mean |
100 |
49.33 |
|
|
33 |
For all N-back tests and frequency bands, the EEG power changes in the AF8 region changed in the same way. The changes in AF7 are the same for alpha and theta band and they are different from beta and gamma.
Figure 5. The variation of the power of the EEG signals according to the average of all participants for different n back tests, (a) gamma, (b) beta, (c) alpha, (d) theta bands
Figure 6 shows that the variation of the power of the EEG signals received during the N-back test according to the average of all 6 participants and electrodes region. During position 1 back test, the AF8 region is slightly more dominant for the beta and gamma bands. However, the AF7 region is more dominant in all other test types and subbands.
Figure 6. The variation of the power of the EEG signals received during the N-back test according to the average of all participants and electrodes regions, (a) gamma, (b) beta, (c) alpha, (d) theta bands
Figure 7. The variation of the power of the AF7+AF8 EEG signals according to n back tests
Figure 7 shows that the variation of the power of the AF7+AF8 EEG signals according to n back tests. The scores of the participants for position 1-back, position color 2-back and position image 2-back tests are 100.00, 49.88 and 33.00 respectively. The beta, alpha and theta powers (except gamma band) have also increased with the increase of the N back test difficulty.
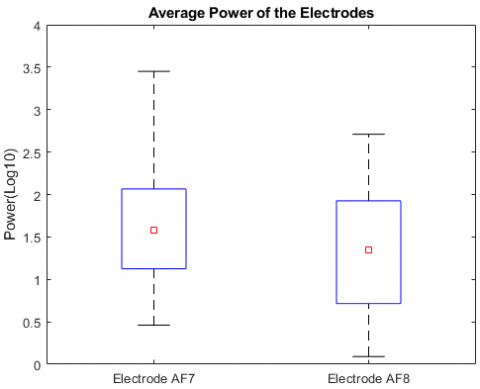
We used One-Way Anova tests to examine possible differences in EEG power (used mean values) between AF7 and AF8 regions. Test results and graphic of the average power are shown in Table 3 and Figure 8, respectively. The AF7 region is more dominant than AF8. From Table 3 it was observed as EEG power between AF7 and AF8 regions showed significant difference at 0.05 (p=0.041).
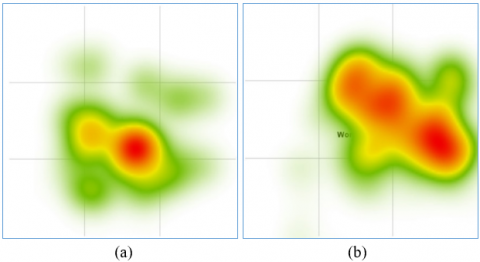
Figure 9 shows that the sample heat map (from one participant) results for 1-back and 2-back tests. The obtained heat-map results generally show that the participants are focused on one or two point for the 1-back test, they usually focus on more points for the 2-back test.
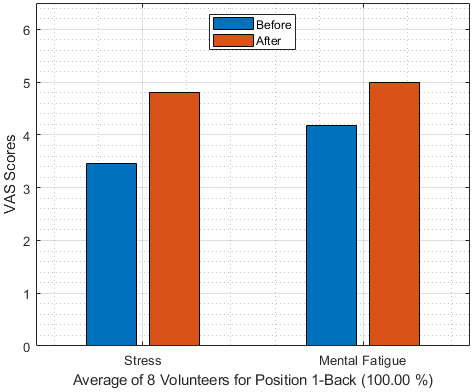
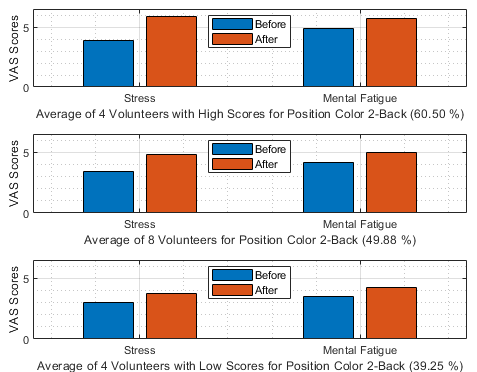
Figure 10 shows that VAS score comparison between the before and after all the tasks in terms of mental fatigue and stress. The acquired results show that the VAS scores for both mental fatigue and stress increased after the N-back test with low and high test scores.
Table 3. Comparison of average EEG power of the two electrodes at three N-Back tasks
|
Parameters |
AF7 Region (Mean±Std) |
AF8 Region (Mean±Std) |
p-value |
|
EEG Power |
1.58±0.62 |
1.35±0.69 |
0.041* |
Figure 8. The average power of the EEG signals at AF7 and AF8 electrodes
Figure 9. Sample eye-tracking heat-map results (a) For 1-back position task, (b) For position-color 2-back task
(a)
(b)
(c)
Figure 10. VAS score variations between the before and after n-back test according to the scores for (a) Position 1-Back (b) Position Color 2-Back (c) Position Image 2-Back
In this study, it is aimed to determine the effects of different modes N-back test which is one of the measurement tools frequently used in measurement of working memory, on the Electroencephalography (EEG) and Eye-tracker data. Eight healthy volunteers participated in this work. They performed mental fatigue and stress inducing tasks. Each task contains 72-seconds stress and mental fatigue inducing 1-position back, 2-position-color and 2-position-image test sessions and three evaluation sessions performed. During these sessions, the volunteers were assessed using EEG, Eye Tracker and Visual analogue scale (VAS). VAS was also used to evaluate perceived stress and mental fatigue before and after the N-back test.
The obtained results of this study show that significant influence different N-back task modes. In particular, all tested N-back modes for volunteers with high test scores, the power values in the AF8 channel are higher than those with lower scores.
Power values of EEG signals from volunteers for different test modes were evaluated according to test scores in theta, alpha and beta bands. According to the obtained results, the power values in each subband of the EEG vary according to the test mode and the test scores. Beta, alpha and theta frequency bands’ (except gamma band) power in the frontal cortex (AF7+AF8) increased as the N-back test score increased and the play became more difficult.
When the test becomes difficult, it shows that the heat map used for eye tracking is spread over a wider area. The acquired heat-map results by eye-tracker device usually shows that the participants are focused on one or two point for the 1-back test.
It is aimed to determine the differences that different N-back tests make in focusing on the screen by using eye tracer heat maps. Thus, when the difficulty level and modes of the N-back test change, focus differences can be determined.
The VAS scores for both mental fatigue and stress increased after the N-back test with low and high test scores.
According to the graphical results obtained from EEG with subjective evaluation, n back tests increased stress and mental fatigue. These results help understanding of the physiological changes of stress and mental fatigue and contribute to develop new methods to assess stress and mental fatigue. In this study only the results for position-1-back, position-color-2-back and position-image-2-back modes were evaluated. Similar analysis can be performed in different N-back tasks.
This study was supported by the Research Project Department of Akdeniz University, Antalya, Turkey (Project Number: FBA-2018-3351). We acknowledge the volunteers for their contribution to this study.
[1] Baddeley, A. (1992). Working memory. Science, 255(5044): 556-559. https://doi.org/10.1126/science.1736359
[2] Jacola, L.M., Willard, V.W., Ashford, J.M., Ogg, R.J., Scoggins, M.A., Jones, M.M., Wu, S., Conklin, H.M. (2014). Clinical utility of the N-back task in functional neuroimaging studies of working memory. Journal of Clinical and Experimental Neuropsychology, 36(8): 875-886. https://doi.org/10.1080/13803395.2014.953039
[3] Shriram, R., Sundhararajan, M., Daimiwal, N. (2013). EEG based cognitive workload assessment for maximum efficiency. IOSR Journal of Electronics and Communication Engineering, 7: 34-38.
[4] Brouwer, A.M., Hogervorst, M.A., van Erp, J.B., Heffelaar, T., Zimmerman, P.H., Oostenveld, R. (2012). Estimating workload using EEG spectral power and ERPs in the N-back task. Journal of Neural Engineering, 9(4): 1-14. https://doi.org/10.1088/1741-2560/9/4/045008
[5] Ray, W.J., Cole, H.W. (1985). EEG activity during cognitive processing: influence of attentional factors. International Journal of Psychophysiology, 3(1): 43-48. https://doi.org/10.1016/0167-8760(85)90018-2
[6] Fink, A., Grabner, R.H., Neuper, C., Neubauer, A.C. (2005). EEG alpha band dissociation with increasing task demands. Brain Res Cognitive Brain Research, 24(2): 252–259. https://doi.org/10.1016/j.cogbrainres.2005.02.002
[7] Pfurtscheller, G., Stancak, A.J., Neuper, C. (1996). Event-related synchronization (ERS) in the alpha band: an electrophysiological correlate of cortical idling. International Journal of Psychophysiology, 24(1-2): 39-46. https://doi.org/10.1016/S0167-8760(96)00066-9
[8] Sterman, M.B., Mann, C.A., Kaiser D.A., Suyenobu, B. Y. (1994). Multiband topographic EEG analysis of a simulated visuomotor aviation task. International Journal of Psychophysiology, 16(1): 49-56. https://doi.org/10.1016/0167-8760(94)90041-8
[9] Klimesch, W., Doppelmayr, M., Röhm, D., Pöllhuber, D., Stadler, W. (200). Simultaneous desynchronization and synchronization of different alpha responses in the human electroencephalograph: A neglected paradox? Neuroscience Letters, 284(1-2): 97-100. https://doi.org/10.1016/s0304-3940(00)00985-x
[10] Keil, A., Mussweiler, D., Epstude, K. (2006). Alpha-band activity reflects reduction of mental effort in a comparison task: A source space analysis. Brain Research, 1121(1): 117-127. https://doi.org/10.1016/j.brainres.2006.08.118
[11] Klimesch, W. (1996). Memory processes, brain oscillations and EEG synchronization. International Journal of Psychophysiology, 24(1-2): 61-100. https://doi.org/10.1016/S0167-8760(96)00057-8
[12] Klimesch, W. (1997). EEG alpha rhythms and memory processes. International Journal of Psychophysiology, 26(1-3): 319-340. https://doi.org/10.1016/s0167-8760(97)00773-3
[13] Klimesch, W. (1999). EEG alpha and theta oscillations reflect cognitive and memory performance: A review and analysis. Brain Research Reviews, 29(2-3): 169-195. https://doi.org/10.1016/S0165-0173(98)00056-3
[14] Miyata, Y., Tanaka, Y., Hono, T. (1990). Long term observation on Fm-theta during mental effort. Neuroscience, 16: 145-148.
[15] Raghavachari, S., Kahana, M.J., Rizzuto, D.S., Caplan, J. B., Kirschen, M.P., Bourgeois, B., Madsen, J.R., Lisman, J.E. (2001). Gating of human theta oscillations by a working memory task. Journal of Neuroscience, 21(9): 3175-3183. https://doi.org/10.1523/JNEUROSCI.21-09-03175.2001
[16] Jensen, O., Tesche, C.D. (2002). Frontal theta activity in humans increases with memory load in a working memory task. European Journal of Neuroscience, 15(8): 1395-1399. https://doi.org/10.1046/j.1460-9568.2002.01975.x
[17] Esposito, F., Aragri, A., Piccoli, T., Tedeschi, G., Goebel, R., Disalle, F. (2009). Distributed analysis of simultaneous EEG-fMRI time-series: Modeling and interpretation issues. Magnetic Resonance Imaging, 27(8): 1120-1130. https://doi.org/10.1016/j.mri.2009.01.007
[18] Rahayfeh, A.A., Faezipour, M. (2013). Eye tracking and head movement detection: A state-of-art survey. IEEE Journal of Translational Engineering in Health and Medicine, 1: 1-12. https://doi.org/10.1109/JTEHM.2013.2289879
[19] Crowe, E., Narayanan, N.H. (2000). Comparing interfaces based on what users watch and do. Proceedings of the Symposium on Eye Tracking Research & Applications, Florida, pp. 29-36. https://doi.org/10.1145/355017.355022
[20] Duchowski, A.T. (2002). A breadth-first survey of eye-tracking applications. Behavior Research Methods, Instruments, and Computers, 34(4): 455-470. https://doi.org/10.3758/bf03195475
[21] Špakov, O., Miniotas, D. (2007). Visualization of eye gaze data using heat maps. Elektronika Ir Elektrotechnika, 742: 55-58.
[22] Lesage, F.X., Berjot, S., Deschamps, F. (2012). Clinical stress assessment using a visual analogue scale. Occupational Medicine, 62(8): 600-605. https://doi.org/10.1093/occmed/kqs140
[23] Jaeggi, S.M., Buschkuehl, M., Jonides, J., Perrig, W.J. (2008). Improving fluid intelligence with training on working memory. Proceedings of the National Academy of Sciences of the United States of America, 105(19): 6829-6833. https://doi.org/10.1073/pnas.0801268105
[24] Barker, R.M., Bialystok, E. (2019). Processing differences between monolingual and bilingual young adults on an emotion N-back task. Brain and Cognition, 134: 29-43. https://doi.org/10.1016/j.bandc.2019.05.004
[25] Pergher, V., Wittevrongel, B., Tournoy, J., Schoenmakers, B., Van Hulle, M.M. (2019). Mental workload of young and older adults gauged with ERPs and spectral power during N-Back task performance. Biological Psychology, 146: 107726. https://doi.org/10.1016/j.biopsycho.2019.107726
[26] Hoskinson, P., Toomim, J. (2010). Brain Workshop: Brain Workshop - a Dual N-Back game (Version 4.8.1), [Software]. Available: http://brainworkshop.sourceforge.net/download.html
[27] Fallahi, M., Heidarimoghadam, R., Motamedzade, M., Farhadian, M. (2016). Psycho physiological and subjective responses to mental workload levels during N-back task. Journal of Ergonomics, 6(6): 1-7. https://doi.org/10.4172/2165-7556.1000181
[28] Abujelala, M., Abellanoza, C., Sharma, A., Makedon, F. (2016). Brain-EE: brain enjoyment evaluation using commercial EEG headband. PETRA '16 Proceedings of the 9th ACM International Conference on PErvasive Technologies Related to Assistive Environments. https://doi.org/10.1145/2910674.2910691
[29] Tumari, S.Z.M., Sudirman, R., Ahmad, H. (2013). Selection of a suitable wavelet for cognitive memory using electroencephalograph signal. Engineering, 5 (5B): 15-19. https://doi.org/10.4236/eng.2013.55B004
[30] Rahma, O.N., Wijaya, S.K., Prajitno, P., Badri, C. (2016). Electroencephalogram analysis with wavelet transform and neural network as a tool for acute ischemic stroke identification. In Proceedings IASTEM International Conference, Bali, Indonesia, 9.
[31] Orosco, L., Correa, A.G., Laciar, E. (2013). A survey of performance and techniques for automatic epilepsy detection. Journal of Medical and Biological Engineering, 33(6): 526-537. https://doi.org/10.5405/jmbe.1463
[32] Meule, A. (2017). Reporting and interpreting working memory performance in N-back tasks. Frontiers in Psychology, 8: 352-354. https://doi.org/10.3389/fpsyg.2017.00352