Valeria Todeschi | Simone Beltramino | Bernadette El Jamous | Guglielmina Mutani*
OPEN ACCESS
Nowadays, energy consumption in buildings is one of the fundamental drivers to control greenhouse gas emissions and environmental impact. In fact, the air quality of urban environments can cause two main phenomena in metropolitan areas: urban heat island and climate changes. The aim of this work is to showcase how different building variables can impact the residential building’s space heating and cooling energy consumption. Buildings energy-related variables can be fundamental viewpoints to improve the energy performance of neighborhoods, especially in future urban planning. This work examines four neighborhoods in the city of Turin (IT): Arquata, Crocetta, Sacchi, and Olympic Village characterized by different morphologies and building typologies. In each neighborhood, residential building was grouped according to orientations and construction periods. A sensitivity analysis was applied by analysing six building variables: infiltration rate, window-to-wall ratio, and windows, walls, roofs, and floor thermal transmittances. The energy consumption for space heating and cooling of residential buildings and local climate conditions were investigated using CitySim Pro tool and ENVI-met. The challenge of this work is to identify the building variables that most influence energy consumption and to understand how to promote high-energy efficiency neighborhoods: the goal is to identify the “ideal” urban form with low consumption and good comfort conditions in outdoor urban environments. The results of this work show a significant connection between the energy consumption and the six analyzed building variables; however, this relationship also depends on the shape and orientation of the neighborhood.
energy simulation, sensitivity analysis, energy-related variables, building shape, urban form, local climate conditions, outdoor thermal comfort
Urbanization is largely affected by the shifting of populations to existing metropolitan areas with urban transportation systems, social and financial connections, way of life, or a blend of these factors. As per the United Nations (UN), 66% of the worldwide population will live in metropolitan communities by 2050, while 86% of them are expected to be concentrated in metropolitan regions as opposed to rural ones [1]. This trend causes huge changes of metropolitan and rural scenes with related ecological effects, which include urban heat island (UHI) effect and raise in energy consumption. The UHI mitigation phenomena are mainly caused by the expansion of urban built-up environments [2], as well as the use of materials with low albedo, such as concrete, related for example to the lack of vegetative land cover. Rising temperatures and increasing urbanization are trends that make cities play an important role in the fight against climate change. Moreover, inside cities microclimatic variations cause a further increase in temperature, making outdoor urban environments thermally stressful. At neighborhood scale outdoor thermal comfort is influenced by building geometry, urban morphology and local climate [3]. As stated by the European commission in 2016, buildings are held accountable for 40% of energy utilization and 36% of CO2 emissions in Europe. Furthermore, urban areas are responsible for 75% of greenhouse gas (GHG) emissions, mainly caused by the energy consumption of buildings and transportation systems that are the main responsible of this phenomenon [4]. Therefore, the buildings energy management is a key factor in order to achieve a more sustainable and energy efficient environment in urban territories. In Italy, and in most European nations, energy policies to reduce energy-use in buildings and GHG emissions are centered on two main activities: improve energy performance by promoting energy efficiency and increase the use of renewable energy sources (RESs) [5].
To promote energy efficiency in metropolitan areas, various strategies could be used, for example: the distribution of heat through neighborhood heating network, the use of construction coverings and spaces to create energy from RESs, and a mixture of different types of users with a distinctive energy daily load in close territories. The limited accessibility of RESs in metropolitan areas stimulates the requirement to optimize the use of smart green technologies, such as solar panels [6, 7].
The aim of this work is to understand how energy consumption and thermal comfort vary, considering the building geometry, urban morphology, and local climate in different zones of the city. By analyzing neighborhoods, it is possible to identify the optimal shape of buildings and built environment that ensure low energy consumption, high-energy savings and higher thermal comfort conditions [8]. This work provides guidelines to support urban planners for improve health and thermal comfort.
The energy consumption of buildings is identified as one of the most important cause of GHG emissions. Since the urban form influence the energy performance of buildings, the shape of the city plays a significant role in the promotions of sustainable territories [9].
To date, there are several energy models and tools able to simulate energy consumption at urban level [10]. In addition to the known variables that influence consumptions at the building scale (i.e. compactness, exposure, thermal proprieties), urban energy models need to take into consideration the urban morphology of each neighborhood [11], focusing mainly on developed zones and on very dense areas [12].
Energy consumption and urban form affect external air temperature in urban environment. The results carried out in [7] demonstrate that direct sun and mean radiant temperature play the most important role in thermal comfort environment and are influenced by the urban forms and main orientation, which provides different thermal environments.
The main parameters used to analyze the energy performance at urban level are: the presence of vegetation, the albedo, the canyon effect, the building density, the building coverage ratio and the main orientation of the buildings [13]. In addition, the solar energy accessibility can be improved according to the urban form [14]. By planning and designing the urban areas taking into consideration the exposure and buildings’ shape, solar energy can be used both passively for heating and day lighting, and actively for electrical energy and domestic hot water production [15].
Several analysis methods have been developed throughout the years to identify rules and methods to simulate energy consumption at urban scale by investigating energy-related variables and the impact of urban form on energy. Sensitivity analysis approach was introduced by Morris [16] –Morris method– and it is a so-called one-step-at-a-time method (OAT), in each run only one input variable is given a new value. The technique depends on processing, for each input data various steady ratios, to have impacts that are later averaged to survey the significance of these collected data in relation to the results obtained. The technique depends on determining for each input various steady proportions, known as Elementary Effects (EE), from which essential insights are processed to deduce sensitivity records. The aim of this type of analysis is to figure out which variables might be considered to have impacts, which are irrelevant or can be neglected. For each variable, two type of analysis are processed: the first one evaluates the general impact of the factor on the phenomenon, the second one determines the factor’s with higher impacts. The analysis is made of independently randomized tests. Every model’s input data shift across levels in the space of the related information to the factors. Observing a standard practice, factors are thought to be consistently dispersed in between 0 to 1 and afterward updated according to the unit associated to it. Morris method, depends on the development of directions in the space of the input data analyzed, commonly ranging between 10 and 50. The configuration depends on the production of an arbitrary beginning stage for every direction and afterward finishing it by moving one factor at a time in an irregular request. However, this methodology could prompt a non-ideal result of the data’s space, particularly for models with countless variable factors. This aspect was investigated by Campolongo et al. [17], the authors tried to improve Morris’s sensitivity analysis method by a superior filtering of the input data area without expanding the quantity of model executions required. In fact, they investigated the performance of Korean Integrated Model (KIM), a model of the tropospheric science [18]. The results of this model show that the best way to apply different strategies is to gather factors into subsets. Beginning from the results of the screening, factors were assembled into two subsets, the first containing the most un-compelling elements and the second one including the residual components. To recognize these most less recognizable elements, for each subset several variables considering the amount of their scores were processed. This procedure delivers a solitary positioning beginning from numerous outputs, along with the gathering of components into two separate sets. The change-based investigation confirms the results obtained in the EE methodology, since for all the yields, the primary gathering of variables represents under 1% of the complete fluctuation. This authenticates the accuracy of Morris’s sensitivity analysis strategy used as a screening strategy in models with several impacts and numerous input data components.
Various methodologies have been proposed to investigate the impact of urban morphology on energy-use. Generally top-down and bottom-up approaches were used to simulate energy consumption of buildings in metropolitan areas. The bottom-up model requires exhaustive database with information at building level, as well as the energy consumption of each building. The top-down model uses aggregated information at territorial level [19-23]. Several tools were developed to facilitate the energy simulations of buildings in different urban areas: Geographic Information System (GIS), Energy Plus, CitySim Pro, UMI, and SimStadt. CitySim Pro [24] is an engineering tool able to improve sustainability of metropolitan areas by analyzing energy distribution at territorial level. CitySim Pro simulates energy space heating and cooling consumption of buildings using as input data buildings shape, urban variables and local climate conditions. These input variables at building scale mainly consist of: building’s infiltration rate, indoor minimum and maximum air temperatures, thermal properties of opaque and transparent surfaces, window-to-wall ratio (WWR), and building occupant’s profile [25]. Using both GIS tools and CitySim Pro some investigation on the relation between urban shape and energy heating demands have been done by Mutani et al. [26]. For the evaluation of outdoor urban thermal comfort ENVI-met was used in this works, it is able to analyze the local climate take into account effects of vegetation on atmosphere, radiation, and soil [27]. Moreover, ENVI-met can calculate many parameters, like: air temperature, vapor pressure, relative humidity, wind velocity and mean radiant temperature useful for evaluation at neighborhood scale.
In this work, energy consumption for space heating and cooling of residential buildings and local climate conditions using CitySim Pro tool and ENVI-met were analyzed. The goal is to identify an “ideal” building shape with high-energy efficiency level for future neighborhoods by using a sensitivity analysis approach. The investigation was applied to four neighborhoods located in the city of Turin, Italy.
Turin is a city situated in the northwestern part of Italy. The city is predominantly located on the west side of the Po River, surrounded by the western Alpine. The number of inhabitants in the city is 866,425 (updated to August 2020). The city’s weather is a continental temperate climate with cold and dry winters and humid and hot summers.
In this study, four homogeneous zones in Turin were selected to analyze the heating and cooling demand of each neighborhood at building scale (Figure 1) [28].
Figure 1. City of Turin with the selection of four neighborhoods
The energy consumption was simulated for residential buildings using CitySim Pro tool. Since urban form influence not only energy performance of buildings but also outdoor thermal comfort conditions, ENVI-met was used in order to investigate the impact of urban morphology on the external air temperature of urban environments.
The main databases used to create the 3D models were: orthophotos, land use (i.e. green surfaces, trees, type of surface), municipal technical map (i.e. building height, type of users).
ENVI-met models have a resolution of 10x10 meters, this resolution was chosen based on the dimension of the area analyzed (neighbors of around 500x500 m), the dimension of the building environment and the limit of time calculation of the software. The simulation of comfort conditions was made using as reference day the hottest one of 2015 to evaluate how urban characteristics affect urban thermal comfort in extreme climatic conditions. A set of meteorological data from the nearest weather station was used. For what concern soil and surface “grass” 25 cm average dense is used for replace green area, “concrete light pavement” and “concrete gray pavement” are used for the courtyard and “asphalt” is used for draw the streets. While, as regards the type of plants chosen, to replace: (i) plane trees of about 15 meters: deciduous trees, LAD high, spherical shape, medium trunks (15m); (ii) maple trees of about 5 meters: deciduous trees, LAD high, spherical shape, small trunks (5m). It was decided to choose a high LAD as the simulation of the climatic parameters was set during the month of August, month in which the leaf area density is high.
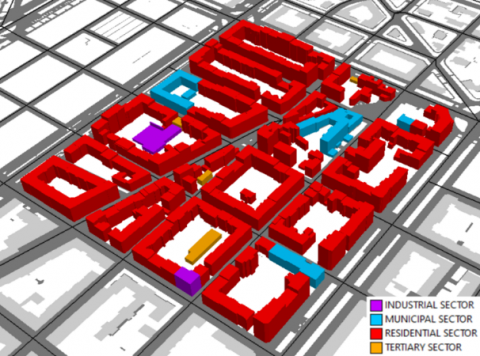
Figures 2-4 show for each neighborhood the type of users at building level: industrial, municipal, residential, tertiary. In this work, the residential buildings were selected for the energy simulation. Homogenous groups were identified in each neighborhood according to the construction period, the surface-to-volume ratio and the orientation (orientations of NE-SW and NW-SE). The sensitivity analysis was done taking into account the different groups.
Figure 2. Sacchi neighborhood and type of users
Figure 3. Crocetta neighborhood and type of users
Figure 4. Arquata neighborhood and type of users
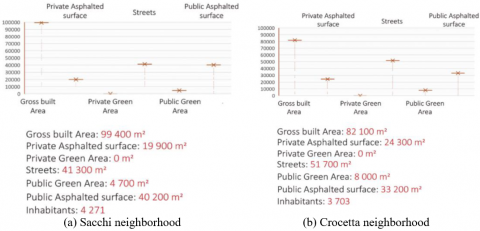
By analyzing building shape, construction period, urban morphology, and socio-economic characteristics of neighborhoods, it is possible to observe that older built neighborhoods have a higher building coverage ratio values with very high gross built areas compared to newly urban areas, less public green areas, and a much higher public asphalted surface. In addition, a lower population density compared to older areas such as Crocetta and Sacchi characterizes the newer urban neighborhoods in this case, Arquata and Olympic Village (Figure 5).
Figure 5. Land use and socio-economic characteristics
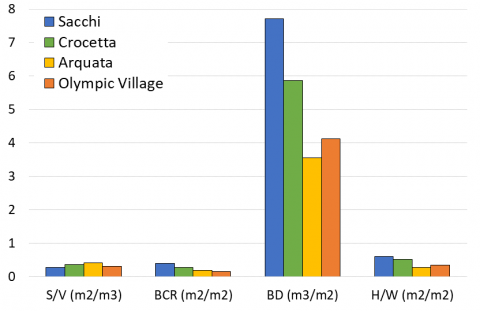
Figure 6. Surface-to-volume ratio (S/V), building coverage ratio (BCR), building density (BD) and height-to-width ratio (H/W) at neighborhood level
Figures 6 shows the surface-to-volume ratio (S/V) and the urban variables calculated for each neighborhood: building coverage ratio (BCR), building density (BD), and height-to-width ratio (H/W). It is possible to observe that residential buildings analyzed in these neighborhoods have a very similar S/V ratio; most of the buildings are compact condominiums. This made it possible to evaluate, with the same compactness of the building, how much the orientation, the construction period and the urban form of the neighborhood affect the energy performance of building and the local climate of outdoor spaces.
A sensitivity analysis was performed in this work, by comparing energy demand for heating and cooling according to different values of building input variables in the four neighborhoods. Table 1 represents the ranges taken into consideration for each input variable. Each neighborhood was investigated analyzing residential buildings characterized by opposite orientations and approximately similar S/V ratio.
Therefore, energy simulations were done in CitySim Pro for the selected buildings by changing the values of the investigated building variables: infiltration rate, WWR, thermal transmittances of windows, walls, roof and floor. The sensitivity analysis was conducted to understand the impact of these variables (Table 1) on hourly space heating and cooling demand of residential buildings with different periods of construction.
Table 1. Building variables used in the sensitivity analysis
|
Variable |
Unit |
Value |
|
Infiltration rate |
h-1 |
0.2 – 0.4 – 0.6 |
|
Window-to-wall ratio (WWR) |
- |
0.2 – 0.4 – 0.6 |
|
Thermal transmittance of window |
W/m2/K |
2.15 – 4.4 – 4.9 |
|
Thermal transmittance of walls |
W/m2/K |
0.67 – 0.9 – 1.1 |
|
Thermal transmittance of roof |
W/m2/K |
0.53 – 1.27 – 1.6 |
|
Thermal transmittance of floor |
W/m2/K |
1.16 – 1.25 |
This section shows the main results obtained at building scale in each neighborhood. The sensitivity analysis has investigated six building variables: infiltration rate, WWR, U-values of windows, wall, roof and floor. The effect of building variables on space heating and cooling energy demand was investigated by analyzing residential buildings with different construction periods in the four neighborhoods: Sacchi, Crocetta, Arquata, and Olympic Village.
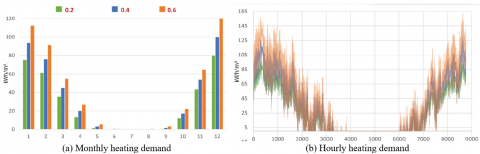
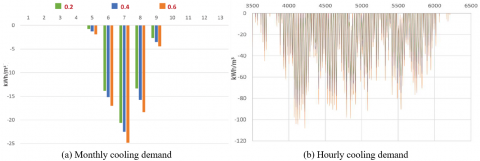
Figure 7 and 8 show an example of the energy simulation made with CitySim Pro for a building located in Sacchi neighborhood. The results refer to the investigation of the WWR variable (values: 0.2, 0.4, 0.6). In particular, in Figure 7a the monthly heating demand expressed in kWh/m3/y for three values of WWR has been indicated; Figure 7b shows the same analysis with hourly time resolution. Figure 8 shows the results for the cooling season distinguishing monthly energy demand and annual demand. Comparing the simulations with 0.2 and 0.6 WWR, in the winter season there is an energy difference of about 40 kWh/m3/month in the colder months, while in the summer season the energy difference is about 5 kWh/m3/month in the warmer months. Therefore, by changing the WWR values, there is a greater impact on heating demand.
Figure 7. Energy simulation: Sensitivity analysis of WWR
Figure 8. Energy simulation: Sensitivity analysis of WWR
From the sensitivity analysis, it is emerged that:
(1) When the infiltration rate increased, mostly all the buildings show a higher energy demand. Therefore, having the smallest infiltration rate (0.2 h-1 in this case), is the ideal range to have higher energy performance. In buildings characterized by the oldest period of construction (before 1919), there is a highest impact in the heating and cooling consumption compared to other construction periods. However, when this value was equal to 0.6 h-1, in new buildings built between 2001 and 2005 (in Olympic Village neighborhood) the heating consumption considerably decreased compared to infiltration rates equal to 0.2 h-1 and 0.4 h-1.
(2) Regarding the WWR results show that whenever the WWR increases, all the residential buildings’ energy demand increased simultaneously. Therefore, the best range in this case is equal to 0.2. Adding to that, buildings that are characterized by an older construction period, (before 1945), had a higher impact in heating energy demand, compared to newer residential buildings. For the cooling energy demand, were found different results. Buildings built between 2001 and 2005 had a much higher impact compared to older ones such as buildings located in Sacchi and Crocetta neighborhoods.
(3) Regarding thermal transmittance of window, it was found that whenever the U-values increased, all the examined residential buildings’ heating energy demand simultaneously increased as well, while the cooling energy demand decreased. This is mainly due to the lower windows insulation, and thus the unwanted penetration of the outdoor air into the buildings. Therefore, the best range is equal to the lowest studied value of 2.15 W/m2/K, generally for buildings built between 2001 and 2005. Adding to that, with higher U-values, the heating and cooling energy demand had the highest impact in the most recently constructed building (2001-2005, in this case) analyzed in Olympic Village neighborhood.
(4) By changing thermal transmittance of walls it is emerged that all the buildings had the highest increase in heating and cooling demand, with U-values of walls 0.9 W/m2/K (generally representative of buildings built between 1961 and 1970). With U-value of wall of 0.67 W/m2/K buildings consume less. U-value equal to 1.1 W/m2/K is typical for buildings built between 1919 and 1945, and equal to 0.67 W/m2/K is for buildings built between 2001-2005.
(5) Heating and cooling energy demand increases with U-value of roof equal to 1.27 W/m2/K (typical for buildings built in 1961-1970. With U-value of roof equal to 0.53 W/m2/K (typical for buildings built in 2001-2005), energy demand is lower.
(6) Regarding thermal transmittance of floor, results show that buildings had the highest increase in both heating and cooling demands with U-value of floor equal to 1.25 W/m2/K (typical for buildings built in 1961-2005). With U-value of 1.16 W/m2/K, energy consumption is lower.
In general, for the oldest buildings, in Sacchi (built before 1919), and Crocetta neighborhood (built in 1919-1945), the variable that had the most impact on the heating demand is the WWR. Whereas for the more recent periods of constructions (Arquata and Olympic Village neighborhoods), the windows U-value, played the biggest role in affecting the building’s energy demand. Adding to that, residential buildings that are characterized by construction periods of before 1919 and, 1961-1970, had the highest impact in cooling energy consumption in regard the building’s walls U-value. While the most recent construction of 2001-2005 in Olympic Village neighborhood, had the highest cooling energy demand with the change of the infiltration rate. Whereas the floor U-value, had the least impact in comparison to the other examined building variables.
5.1 Sacchi neighborhood
Several buildings built before 1919 characterizes Sacchi neighborhood. It has the highest BCR of 0.4 m2/m2 that reflects the gross built area of the neighborhood over the census parcel area, with a BD of 7.72 m3/m2 that represents the proportion between the overall volume of the buildings and the census parcel zone.
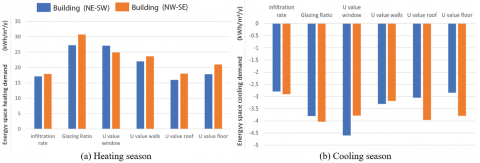
In Figure 9 sensitivity analysis’ results of Sacchi neighborhood have been indicated distinguishing NE-SW and NW-SE orientations. In the heating season, the building variable that has the greatest impact on the energy demand is the WWR, especially for buildings with a NE-SW orientation. While for the cooling season the thermophysical properties of the opaque envelope have a greater influence on consumption. In this neighborhood there are maximum impact of 40 kWh/m3/y and 8 kWh/m3/y for heating and cooling energy demand respectively.
Figure 9. Sacchi neighborhood: sensitivity analysis
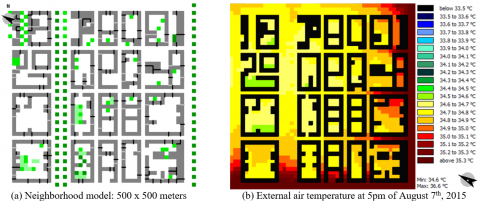
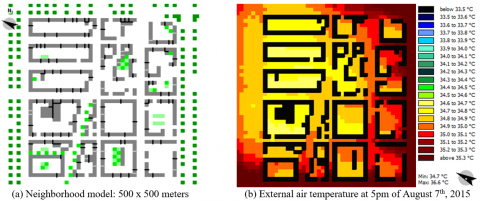
Figure 10 shows the analysis made in ENVI-met, and in Figure 10b external air temperature at 5pm of August 7th, 2015 (the hottest day for the 2014 and 2015) have been mapped. It is possible to see that the minimum temperatures are about 34.5°C and are located in the inner courtyards of the buildings and where there are green areas.
5.2 Crocetta neighborhood
Several buildings built before between 1919 and 1945 characterizes Crocetta neighborhood. It has a moderate BCR equal to 0.28 m2/m2 that reflects the gross built area of the neighborhood over the census parcel area, with a BD of 5.86 m3/m2 and an H/W ratio of 0.52 m2/m2.
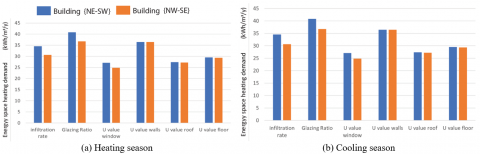
In Crocetta neighborhood the building variable that has the greatest impact on heating demand is the WWR (as in the case of Sacchi) with a maximum in energy variation of 30 kWh/m3/y. Instead, in the case of cooling demand, the thermal transmittance of the windows and the WWR have a greater impact on the energy performance with a maximum in energy variation of 4.5 kWh/m3/y (Figure 11).
Considering the urban form and the building shape, Crocetta neighborhood is very similar to Sacchi one, with the difference that Sacchi has a higher level of building density equal to 7.7 m3/m2.
From the simulations of ENVI-met it emerged that the lowest temperature at 5 pm is 34.7°C up to a maximum of 36.6°C (Figure 12). As expected from the analysis of the urban form, the climatic characteristics between Sacchi and Crocetta are very similar.
Figure 10. Sacchi neighborhood: ENVI-met analysis
Figure 11. Crocetta neighborhood: sensitivity analysis
Figure 12. Crocetta neighborhood: ENVI-met analysis
5.3 Arquata neighborhood
Buildings built between 1961 and 1970 characterize Arquata neighborhood. It has the BCR m2/m2 equal to 0.18, the BD of 3.56 m3/m2 and the H/W is 0.27 m2/m2.
Compared to the other areas (especially for Sacchi and Crocetta), the Arquata neighborhood has much more basic values of BCR, BD and H/W. Figure 13 shows that the building variables have a fairly similar impact on heating demand, with maximum values of 25 kWh/m3/y for the thermal transmittance of the windows. Also, for cooling demand the variables have a similar impact on cooling demand that varies between 4 and 6 kWh/m3/y.
Figure 13. Arquata neighborhood: Sensitivity analysis
The external air temperature ranges from 34.8 to 36.6°C. Compared to the other neighborhoods, here there are higher temperatures in the inner courtyards, which is due to the fact that with lower H/W values there are fewer shaded areas, and this affects the temperature.
5.4 Olympic village neighborhood
Buildings constructed between 2001 and 2005 characterize Olympic Village. It has the lowest BCR equal to 0.16 m2/m2, a BD equivalent to 4.13 m3/m2, and H/W of 0.34 m2/m2 (Figure 14).
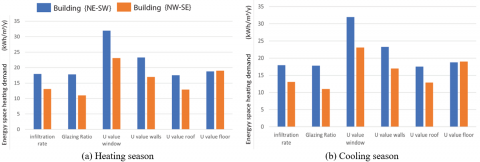
In this neighborhood the thermal transmittance of the windows has a significant impact on the heating demand (23-32 kWh/m3/y) especially for buildings with an orientation (NE-SW). Regarding the cooling energy demand the infiltration rate and WWR have a greater impact than the other building variables (Figure 15).
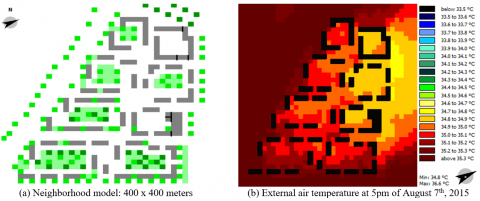
Figure 14. Arquata neighborhood: ENVI-met analysis
Figure 15. Olympic Village neighborhood: sensitivity analysis
Figure 16. Olympic neighborhood: ENVI-met analysis
This is the area with the lowest external air temperatures, with minimums of 33.6°C and maximums of 36.4°C (Figure 16). This is because, in addition to the presence of green areas and trees, there are also pedestrian areas (not asphalted) and more permeable surfaces (the BCR is low).
The sensitivity analysis approach could help to understand how different building energy-related variables can affect the energy performance of building. The results of this study can be used as a tool to support the design of building shape by promoting sustainable urban environment.
From the sensitivity analysis it is emerged that generally, when the infiltration rate, WWR, windows, walls, roof, and floor’s U-values increased, buildings tend to consume more annually. In addition, for buildings that are characterized by old buildings (before 1945), the impact of building variables on energy consumption is gather compared to recent construction periods (1961-1970, and 2001-2005, in this case).
From the local climate analysis it is emerged that direct sun and air temperature are two factors that strongly influence thermal comfort and are defined by the urban morphology and orientation of the neighborhood.
The goal of the methodology presented in this work is to identify an “ideal” urban form with high level of buildings’ energy performance by improving the use of solar energy and the thermal comfort conditions.
[1] Pradhan, S., Al-Ghamdi, S.G., Mackey, H.R. (2019). Greywater recycling in buildings using living walls and green roofs: A review of the applicability and challenges. Science of The Total Environment, 652: 330-344. https://doi.org/10.1016/j.scitotenv.2018.10.226
[2] Rehan, R.M. (2016). Cool city as a sustainable example of heat island management case study of the coolest city in the world. HBRC Journal, 12(2): 191-204. https://doi.org/10.1016/j.hbrcj.2014.10.002
[3] Kolokotsa, D., Santamouris, M., Zerefos, S.C. (2013). Green and cool roofs’ urban heat island mitigation potential in European climates for office buildings under free floating conditions. Solar Energy, 95: 118-130. https://doi.org/10.1016/j.solener.2013.06.001
[4] UNEP. Emissions Gap Report 2018 (https://www.unep.org/resources/emissions-gap-report-2018).
[5] Mutani, G., Todeschi, V. (2020). Building energy modeling at neighborhood scale. Energy Efficiency, 13(7): 1353-1386. https://doi.org/10.1007/s12053-020-09882-4
[6] Mutani, G., Todeschi, V. (2020). The effects of green roofs on outdoor thermal comfort, urban heat island mitigation and energy savings. Atmosphere, 11(2): 123. https://doi.org/10.3390/atmos11020123
[7] Taleghani, M., Kleerekoper, L., Tenpierik, M., Van Den Dobbelsteen, A. (2015). Outdoor thermal comfort within five different urban forms in the Netherlands. Building and Environment, 83: 65-78. https://doi.org/10.1016/j.buildenv.2014.03.014
[8] Yang, F., Jiang, Z. (2019). Urban building energy modelling and urban design for sustainable neighbourhood development-A China perspective. In IOP Conference Series: Earth and Environmental Science, 329(1): 012016. https://doi.org/10.1088/1755-1315/329/1/012016
[9] Murshed, S.M., Duval, A., Koch, A., Rode, P. (2019). Impact of urban morphology on energy consumption of vertical mobility in Asian cities-a comparative analysis with 3D city models. Urban Science, 3(1): 4. https://doi.org/10.3390/urbansci3010004
[10] Hedegaard, R.E., Kristensen, M.H., Pedersen, T.H., Brun, A., Petersen, S. (2019). Bottom-up modelling methodology for urban-scale analysis of residential space heating demand response. Applied Energy, 242: 181-204. https://doi.org/10.1016/j.apenergy.2019.03.063
[11] Quan, S.J., Economou, A., Grasl, T., Yang, P.P.J. (2020). An exploration of the relationship between density and building energy performance. Urban Design International, 25(1), 92-112. https://doi.org/10.1057/s41289-020-00109-7
[12] Boghetti, R., Fantozzi, F., Kampf, J., Mutani, G., Salvadori, G., Todeschi, V. (2020). Building energy models with Morphological urban-scale parameters: A case study in Turin. In 4th IBPSA-Italy Conference on Building Simulation Applications, BSA 2019, 131-139. http://hdl.handle.net/11568/1057914
[13] Strømann-Andersen, J., Sattrup, P.A. (2011). The urban canyon and building energy use: Urban density versus daylight and passive solar gains. Energy and Buildings, 43(8): 2011-2020. https://doi.org/10.1016/j.enbuild.2011.04.007
[14] Sarralde, J.J., Quinn, D.J., Wiesmann, D., Steemers, K. (2015). Solar energy and urban morphology: Scenarios for increasing the renewable energy potential of neighbourhoods in London. Renewable Energy, 73: 10-17. https://doi.org/10.1016/j.renene.2014.06.028
[15] Sanaieian, H., Tenpierik, M., Van Den Linden, K., Seraj, F.M., Shemrani, S.M.M. (2014). Review of the impact of urban block form on thermal performance, solar access and ventilation. Renewable and Sustainable Energy Reviews, 38: 551-560. https://doi.org/10.1016/j.rser.2014.06.007
[16] Morris, M.D. (1991). Factorial sampling plans for preliminary computational experiments. Technometrics, 33(2): 161-174. https://doi.org/10.1080/00401706.1991.10484804
[17] Campolongo, F., Cariboni, J., Saltelli, A. (2007). An effective screening design for sensitivity analysis of large models. Environmental modelling & software, 22(10): 1509-1518. https://doi.org/10.1016/j.envsoft.2006.10.004
[18] Hong, S.Y., Kwon, Y.C., Kim, T.H., Kim, J.E.E., Choi, S.J., Kwon, I.H., Kim, D.I. (2018). The Korean Integrated Model (KIM) system for global weather forecasting. Asia-Pacific Journal of Atmospheric Sciences, 54(1): 267-292. https://doi.org/10.1007/s13143-018-0028-9
[19] Vogt, Y. (2003). Top–down energy modeling. Strategic planning for energy and the environment, 22(4): 64-79. https://doi.org/10.1080/10485230309509626
[20] Li, W., Zhou, Y., Cetin, K., Eom, J., Wang, Y., Chen, G., Zhang, X. (2017). Modeling urban building energy use: A review of modeling approaches and procedures. Energy, 141: 2445-2457. https://doi.org/10.1016/j.energy.2017.11.071
[21] Swan, L.G., Ugursal, V.I. (2009). Modeling of end-use energy consumption in the residential sector: A review of modeling techniques. Renewable and sustainable energy reviews, 13(8): 1819-1835. https://doi.org/10.1016/j.rser.2008.09.033
[22] Mutani, G., Fontanive, M., Arboit, M. (2018). Energy-use modelling for residential buildings in the metropolitan area of Gran Mendoza (AR). Italian Journal of Engineering Science: Tecnica Italiana, 61(2): 74-82. https://doi.org/10.18280/ijes.620204
[23] Mutani, G., Todeschi, V., Grisolia, G., Lucia, U. (2019). Introduction to constructal law analysis for a simplified hourly energy balance model of residential buildings at district scale. Tecnica Italiana-Italian Journal of Engineering Science, 63(1): 13-20. https://doi.org/10.18280/ti-ijes.630102
[24] Carozza, M., Mutani, G., Coccolo, S., Kaempf, J.H. (2017). Introducing a hybrid energy-use model at the urban scale: the case study of Turin (IT). 3rd Building Simulations Application Conference BSA 2017, Bolzano, Italy.
[25] Mutani, G., Coccolo, S., Kaempf, J., Bilardo, M. (2018). CitySim Guide: Urban Energy Modelling. 1-114.
[26] Mutani, G., Delmastro, C., Gargiulo, M., Corgnati, S.P. (2016). Characterization of building thermal energy consumption at the urban scale. Energy Procedia, 101: 384-391. https://doi.org/10.1016/J.EGYPRO.2016.11.049
[27] Yang, Y., Gatto, E., Gao, Z., Buccolieri, R., Morakinyo, T.E., Lan, H. (2019). The “plant evaluation model” for the assessment of the impact of vegetation on outdoor microclimate in the urban environment. Building and Environment, 159: 106151. https://doi.org/10.1016/J.BUILDENV.2019.05.029
[28] Mutani, G., Carozza, M., Todeschi, V., Rolando, A. (2020). Urban-scale energy models: Relationship between urban form and energy performance. 2020 IEEE 3rd International Conference and Workshop in Óbuda on Electrical and Power Engineering (CANDO-EPE), Budapest, Hungary, pp. 000185-000190. https://doi.org/10.1109/CANDO-EPE51100.2020.9337760