Sunitha Rajanna*![]() | Chandrika Jayaramaiah
| Chandrika Jayaramaiah![]() | Rajashree Sridhar
| Rajashree Sridhar![]() | Pavithra Hassan Chandrappa
| Pavithra Hassan Chandrappa![]() | Rohini Thimmapura Venkatesh
| Rohini Thimmapura Venkatesh![]()
© 2023 IIETA. This article is published by IIETA and is licensed under the CC BY 4.0 license (http://creativecommons.org/licenses/by/4.0/).
OPEN ACCESS
Heart attack is becoming a common life-threatening disease in the current lifestyle of the people. There is a lack of an automatic mechanism to detect it using medical sensor data. Because processing medical sensor data is tedious and leads to more processing overhead. Hence, we are proposing a framework to process the data by mining the important patterns in it i.e., we designed a framework to process the data sensed by various sensors that can be deployed on the human body in the form of gadgets using the technologies like Internet of Things and Machine learning. This paper presents a Fuzzy Inference with a Modified Convolutional Neural Network framework for heart attack prediction. We trained and tested our designed framework on the medical sensor data and achieved good prediction accuracy. This framework offers a foundation for developing a system of decision support that has the potential for learning and the ability to cope with disease management vagueness and unstructuredness. The result is compared with a few existing methods like SVM, K-Nearest Neighbor, Logistic Regression, and Convolutional Neural Network to show improved classification accuracy.
heart attack disease, convolutional neural network, fuzzy inference system, data classification, pattern mining
A heart attack is a major and common medical problem in the human being because of the various reasons and changed life style. A blood clot generally causes a heart attack by obstructing the heart's blood supply. Without blood, tissue dehydrates and deteriorates. A tightness or soreness in the chest, neck, back, or arms, as well as weariness, dizziness, an irregular heartbeat, and anxiety, are other symptoms. Atypical symptoms are more common in women than in males. Treatment options include anything from medication, stents, and bypass surgery to dietary adjustments and cardiac rehabilitation. The World Health Organization states that the leading cause of death globally is cardiovascular disease (CVD). In 2015, about 17 million people died as a result of CVD, accounting for almost 30% of all fatalities worldwide.
Several methods based on clustering, association rules [1], common patterns [2], sequential patterns [2], and classification were effectively applied to sensor data. The design and implementation of sensor networks, however, poses unique research issues because of their massive size (up to thousands of sensor nodes), haphazard and risky deployment, loss communication environment, constrained power supply, and high failure rate. These issues make using traditional mining methods impossible. Because mining has typically been centralized, expensive in terms of processing, and focused on transactional data stored on the disc, these issues make traditional mining approaches inapplicable. Microelectronic devices and wireless communication have advanced as a result of the installation of large-scale sensor networks and low-power sensors.
The most common of these conditions, coronary heart disease, resulted in nearly 360,000 heart attack-related deaths in the United States in 2015. The Centers for Disease Control and Prevention (CDC) estimate that an American has a heart attack every 40 seconds or so [3]. Additionally, the American Cardiac Association predicts that by 2030, the cost of treating heart disease will have doubled. In various application areas, including habitat monitoring [4], object tracking [5], environmental monitoring, military, disaster management, as well as smart environments, sensor networks have attracted significant interest due to their capabilities of ubiquitous surveillance.
Data mining techniques have been shown to be an effective tool for raising the effectiveness and quality of services (QoS) provided by WSN. In WSN, knowledge discovery has also been used to gather data about the immediate surroundings. This data is derived from sensor node data and behavioral patterns, which are produced from meta-data characterizing sensor behaviors.
Heart disease was the primary cause of almost 7 million of these fatalities, and industrialized nations accounted for more than 75% of all CVD deaths. Over 50% of fatalities from heart disease are male. Over 630,000 Americans each year die from heart disease in the United States alone, which accounts for 25% of fatalities. Congenital, coronary, rheumatic, and other types of heart disease are all included under the general term "heart disease." This study tells the important requirement for the automatic mechanism to predict CVD worldwide.
This research paper is arranged as follows: defined the literature work in Section 2. The proposed method is discussed in section 3. The experimental outcomes are discussed and evaluated in Section 4. Finally, the paper ends with Section 5.
Heart attack detection using medical sensor data mining is a very important task in real-time scenario. These sensor devices use wireless sensor network as the backbone network. In this section, we will discuss some existing literature.
Junaid and Kumar [6] have detected to predict heart disease at a very early stage. As it is well known that most of the world's death-causing diseases are heart disease, cancer also exists, which is a very persistent and deadly disease that has haunted humans all over the world. Subhadra and Vikas [7] have designed a system for predicting heart disease with neural networks. This model is designed for non-linear problems with the help of MLP. It consists of 3 layers, which take input (input layer), process the information (hidden layer), and give the result (output layer). Karayilan and Kılıç [8] have designed an intelligent system for predicting heart disease with a neural network. It is based on a heart diagnosis model. They used 14 valid features for this model to predict heart disease.
Baihaqi et al. [9] have proposed a method of extracting rules for a fuzzy expert system to diagnose CAD. They proposed a diagnosis system for CAD by using data mining techniques. Kasbe and Pippal [10] have designed a system to diagnose heart disease using fuzzy logic. The aim is to build a system that identifies the risk in the patient's heart by using fuzzy logic.
Wedashwara et al. [11] have presented parallel processing of evolutionary association rule mining for efficient summarization of WSN data patterns. This paper is about the parallel processing of ARM for effective processing in WSN using the genetic network programming algorithm. Song et al. [12] have designed a model for the sequential behaviour of pattern discovery with FEM and WSN. This model provides a new technique of mining the data, which uses fewer features and gives us better and more useful patterns. Ismail et al. [13] have presented a Context-Enriched Pattern of Regular Human Behavioral Detection from Body Sensor Data. In this paper, they have used the TEDCP model for identifying the behaviour of human beings with the help of periodicity, context of actions, and action in correlation.
Gawande and Rathod [14] have presented a design of a rule-based fuzzy expert system for the diagnosis of cardiac diseases. They proposed a diagnosis of the system with fuzzy logic. In this paper, they have used 12 attributes.
Jindal et al. [15] have proposed mechanism to predict heart attack using logistic regression and KNN algorithms. Diwakar, et al. [16] have surveyed latest trends in heart attack using various classification mechanisms in machine learning with data fusion methods. In-Network Data Reduction and Coverage-Based Mechanisms for Generating Association Rules in Wireless Sensor Networks were proposed by Boukerche and Samarah [17], which are a kind of behavioral pattern intended to record the temporal connections among sensor nodes. Applications for object detection in use today focus on identifying an object's or all objects' movement patterns. In contrast, a distributed mining technique presented by Tsai et al. [18] detects a collection of objects with similar motion patterns.
According to Rashid et al. [19], a new type of sensor behaviour pattern called associated-correlated sensor patterns should be mined. In this research, Rashid et al. [20] introduced a novel sensor behavioral pattern they dubbed related sensor patterns, which captures association-like co-occurrences and the strong temporal correlations inferred in the sensor data by such co-occurrences. Pattern matching is one of the strategies that may be employed for WSN protection, according to Kalnoor and Agarkhed's [21] proposal. There is also discussion of a few preventative measures that may be taken to safeguard the sensor network. According to Using regularly frequent sensor pattern mining for WSNs sliding window-based, Rashid et al. [22] presented a tree structure called the regular frequent sensor pattern stream tree (RFSPS-tree) and a method called regularly frequent sensor pattern data stream mining (RFSPMS).
By utilising the k-nearest neighbor method on data from wireless sensor networks, Erdogan and Bilgin [23] have suggested a data mining strategy for fall detection. In this research, Ravish et al. [24] have provided a useful technique for obtaining clinical and ECG data in order to train an artificial neural network to correctly diagnose the heart and, if necessary, forecast anomalies.
The process described in Image-Based Modeling and Precision Medicine: Patient-Specific Carotid and Coronary Plaque Assessment and Predictions was proposed by Tang et al. [25]. Without warning, atherosclerotic plaques have the potential to rupture and result in serious cardiovascular conditions, including heart attack and stroke. In order to significantly reduce the energy squandered by the OTSNs while maintaining adequate missing rate levels, Samarah, et al. [26] have suggested a sequence pattern (PTSP) prediction-based tracking approach. Manikandan [27] have presents a prototype implementation of such a framework with an easy-to-use user interface. The classifier was created using the Nave Bayes method, and the graphical user interface is web-based. A wearable cardio-respiratory monitoring device that could concurrently track and visualize 4 parameters on a phone screen or a computer screen in real-time was developed by Sasidharan et al. [28].
There are so many models and related designs that rely on different design methods for their system design and implementation. The existing methods have some shortcomings like they mainly relay on the patient history, expertize knowledge of the doctor, vary time consuming, not accurate prediction, etc. Sometimes leads to imprecise diagnosis of the disease because of the human errors. The proposed research is to overcome these shortcomings of the existing methodologies using wireless sensors. The heart sensor dataset is used for testing the proposed model. The designed hybrid model's efficacy of prediction performance for decision making is determined by training the model using patient data and their condition status.
This section provides the details of the classification and prediction frameworks for the diagnosis of heart attack disease based on the deep neural network architecture. Here, designing a modified convolutional neuro fuzzy inference framework for heart attack prediction. Proposed Neuro-fuzzy data processing system contains eight layers including two activation layers with activations functions i.e., ReLu and Softmax.
Each node of the input layer corresponds to one input variable, and since the first layer simply transfers input values to the following layer, it utilizes a linear function. Each input variable space is fuzzy quantized in the second layer. Second-layer neuron serves as a membership function and represents a term of an input linguistic variable. Although have other membership functions, such as trapezoidal, triangle, etc., we utilize the Gaussian function in this layer to increase the correctness of our design. Rule nodes in the third layer undergo learning using convolutional networks and activation functions. The fuzzy quantization and variable pooling for down sampling are represented by the fourth layer of neurons. The fifth layer is a fully connected layer with all filtered fuzzy rules. The sixth layer represents defuzzification of the rules which are filtered and finalized. The seventh layer represents the activation layer to convert the output into crisp values should fall in 1 and 0. The last layer i.e., eighth layer represents the output of the proposed framework.
The framework of the proposed research work is designed based on the conventional CNN, with a few convolutional layers, a fully connected layer, and fuzzy inference model. Every convolutional layer normally comprises of a convolution phase, a nonlinearity phase, and ultimately a pooling level. The systematic three-stage structure of the designed framework. During the first step of this, the input data is managed and fed into the fuzzification layer to render the fuzzy logic interpretation. The fuzzy convolution layer is subsequently convoluted with fuzzy logic interpretation that includes fuzzified convolutional layers. A min-max composition of fuzzified kernels with local fuzzified input characteristics is the Fuzzy convolution. From its input spatial features, each min-max composition derives higher-level fuzzy characteristics. The proposed framework showing how fuzzy convolution filters help to extract high-level characteristics from fuzzified input data. In the fuzzy domain, via the application of the fuzzy convolution series, the fuzzy convolution stage output feature sets are highly abstract attributes.
As some of the neurons should not get activated sometimes this RELU activation function keeps null for all negative values keeping them inactive when it is unnecessary. ReLu provides us this benefit. The activation function is given in (1)
$f(s)=\max (s, 0)$ (1)
Imagine a network with initialised (or standardized) random weights and almost 50 percent of network activation due to the ReLu function (output 0 for negative values of x). This means that fewer neurons are firing (sparse activation) and there is a lighter network. The Softmax function is shown below mathematically in Eq. (2), where z is the input vector to the output layer. And again, j indexes the units of production, so j = 1, 2,…, K.
$\sigma(z)_j=\frac{e^{Z j}}{\sum_{k=1}^K \,\,e^{Z k}}$ (2)
This function allows in determining the probability of more than one class at once. It is commonly used in the neural network as in the O/P layer and should sum up to 1. A neural network here is predicting whether the patient is suffering from disease or not. It will produce a probability, but it would do individually for each and every input. This function layer allows us to run many classes at once. The number of Softmax function nodes will be the same as O/P layer nodes. Here in the proposed model, build the output layer for predicting 0 or 1.
The proposed model takes the input of S(T) training samples and corresponding L(Y) labels, hyper-parameters αfc, αca, αcb, and αcw are the learning rates; N(B) batch number; dropout rate; I(N) training iteration number; C(L) number of convolution layers. And produces output of trained parameters and the model is designed with initializing the weight W and membership functions cx, cw, cy randomly. In the proposed model, few layers including input layer perform linear transformation on the input data S(T). Linear transformation Z is done according to the Eq. (3)
$\mathrm{Z}=w_T \cdot S(T)+b$ (3)
Here in Eq. (3), wT Represents the weight, S(T) is the input data, and b is the bias value.
If the input matrix is A, several linguistic labels are given for every variable in A in association by membership functions. The fuzzy membership feature determines the degree that determines an input node membership to a specific fuzzy set. In Eq. (4), the fuzzy sets A are obtained via fuzzy relation of Eq. (5) which is computed by the max product procedure. It is linked to the probability that input and output data fit into the predetermined reference fuzzy records of Mpq.
$\mathrm{A}=$ fuzzification $\left(\mathrm{a}_{\mathrm{pq}} \mid \mathrm{c} \mathrm{a}_{\mathrm{pq}}\right)$ (4)
Here p, q, in input matrix A represents indices of element a.
$\mathrm{a}_{\mathrm{pq}}=\text { possibility } \left(\mathrm{a}_{\mathrm{pq}} \mid \mathrm{M}_{\mathrm{pq}}\right) \max _{\mathrm{a \in A}}\left(M_{\mathrm{pq}} \delta\left(\mathrm{a}-\mathrm{a}_{\mathrm{pq}}\right)\right)$ (5)
Here in Eq. (5), δ(a-apq) represents the Kronecker delta function.
Three processing stages are included in each fuzzy convolution layer: the fuzzy convolution stage, the nonlinearity stage, and the pooling stage. As given in Eq. (6), The fuzzy convolutional step occurs a method of employing fuzzy convolutional filters to fuzzy 2D information in that Fμ fuzzy convolutional filters are measured using formula (7).
$a_{\mathrm{pq}}=\sum_{p=0}^{i-1} \sum_{q=0}^{i-1} \mathrm{~F}_{\mu \mathrm{a}}(\mathrm{a}+\mathrm{p})(\mathrm{b}+\mathrm{q})$ (6)
$F_{\mu a}=$ fuzzification(F) (7)
The Eq. (8) is a non-linear conversion of the acquired output from the fuzzy convolution point. The final step is a process called pooling, that is a brief statistic of immediate results with the function's extraction point. This phase enables the interpretation to be invariant to the conversion of the input, and in the meantime, the amount of the input to the subsequent fuzzy convolutional layer could be decreased. Crisp values are generated by the defuzzification layer from the characteristics extracted through pooling. Eventually, as an output classifier of the proposed framework, produces a completely linked layer feature.
The f(apq) represents the input activation function for the input to transfer to the next layer. This activation function activates the input and send some filtered output to the next fuzzy layer using the function in Eq. (8).
$f\left(a_{\mathrm{pq}}\right)=\max \left(a_{\mathrm{pq}}, 0\right)$ (8)
$b_{\mathrm{pq}}=\sigma\left(a_{\mathrm{pq}}\right)$ (9)
where, σ is the convolution layer's activation feature shown in Eq. (9). The completely connected layer of the proposed framework serves as a classifier through the crisp value gained in Eq. (10) being the input characteristics. With the center of gravity method from the defuzzification process. Here bp is the base of defuzzification's membership function, bp' is the yield of the classifier given in Eq. (11).
$\operatorname{defuzz}\left(a_{\mathrm{p}}\right)=\frac{\sum c_b a_p}{\sum a_p}$ (10)
$b_p^{\prime}=$ fullyconnected $\left(b_p\right)$ (11)
The loss function used for measuring the output error is cross entropy as given in Eq. (12) here bp is the target bp' is the outcome of the classifier, and the sample count is S.
$\mathrm{G}=-\frac{1}{S} \sum_{I=1}^S\left[b_p \log \left(b_p^{\prime}\right)+\left(1-b_p\right) \log \left(1-b_p^{\prime}\right)\right]$ (12)
By a conventional back propagation learning algorithm, the model parameters are trained with the cross-entropy loss function. The Wfc updated as shown in Eq. (13) of the fully connected layer weight with an αfc learning rate.
$W_{f c}(\mathrm{k}+1)=W_{f c}(\mathrm{k})-\alpha \mathrm{fc} \,\,\partial \mathrm{E} / \partial W_{f c}$ (13)
The cb(k) centers for the membership functions of defuzzification are revised using Eq. (14), here pcb represents the updating center learning rate, $c_{k+1}$ and $\left(c_{k+1}\right)^{\prime}$ are the outcome target and the definite output of the model, accordingly.
$c_b(\mathrm{k}+1)=c_b(\mathrm{k})+\mathrm{p} c_b \nabla c_b$ (14)
The center value cw(k) and σ variance of the weight of the fuzzification membership function of the convolution layer is calculated by Eqns. (15)-(18) with a learning rate of $\alpha c_w$.
$c_w(\mathrm{k}+1)=c_w(\mathrm{k})+\alpha c_w \nabla \mathrm{W}_\mu$ (15)
$\sigma_{c w}(\mathrm{k}+1)=\sigma_{c w}(\mathrm{k})+\sigma_{c w} \nabla \mathrm{W} \mu$ (16)
where $\delta_{\mathrm{k}}=\left(\mathrm{W}_{\mu \mathrm{k}}\right)^T \delta_{\mathrm{k}} \mathrm{f}^{\prime}\left(\mathrm{i}_{\mathrm{k}}\right)$ (17)
$\nabla W_{\mu \mathrm{k}}=\sum b_{p q} * \operatorname{rot} 180\left(W_{\mu \mathrm{k}}+1\right)$ (18)
Here, f'(ik) is the derivative function of ik and rot180($W_{\mu \mathrm{k}}+1$) is the operator that rotates 180 degrees with respect to $W_{\mu \mathrm{k}}+1$. Eqns. (19) and (20) are used to change the mean and variance of the affiliation function of the fuzzification sheet and αcx is the rate of learning.
$c_{\mathrm{p}}(\mathrm{k}+1)=c_{\mathrm{p}}(\mathrm{k})+\alpha c_{\mathrm{p}} \nabla c_{\mathrm{p}}$ (19)
$\sigma c_{\mathrm{p}}(\mathrm{k}+1)=\sigma c_{\mathrm{p}}(\mathrm{k})+\alpha c_{\mathrm{p}} \nabla c_{\mathrm{p}}$ (20)
The training process for the proposed framework with a back-propagation strategy is summed up in above process. The good parameters of the proposed framework for the provided training dataset through a function list and target to obtain, employ small set of training procedures. The hyperparameter are like batch size, dropout rate, and learning rates are selected through empirical observation.
Heart attack prediction using fuzzy inference and modified neural network framework is designed using python programing with few set of libraries. Heart attack diagnostic accuracy, misclassification error, specificity, sensitivity, precision, and F-score are some of the metrics frequently used to assess how well updated neuro-fuzzy inference system learning models perform in diagnoses. The first and second hidden layers, six input units, a binary output unit, and a modified neuro-fuzzy architecture make up the proposed classification model. Rectified linear unit activation functions relate to 6 neurons in the first layer and 21 neurons in the second layer, together with a 50% dropout. The output unit is coupled to a Gaussian activation function in the last stage of the design. Dropout rates in both hidden layers are applied randomly during model training, creating unpredictable connections within the proposed framework architecture. As a result, dropout technology can decrease overfitting problems in this model.
4.1 About the dataset
For the experimentation, the heart attack disease data set collected from multiple sources. The datasets to say are Long-beach dataset with 200 instances, Cleveland dataset with 303 instances, Switzerland dataset with 123 instances and Hungarian dataset with 294 instances. All these datasets have 76 attributes related to heart attack patients in which we have taken only six important features extracted from the filter feature extraction method. Totally we have collected 900 instances of dataset from the above-mentioned datasets and cleaned all this data to remove the null values and errors using some techniques based on type of data such as mean and mode method.
4.2 Data pre-processing
Data processing is done for better prediction and it helps to process the data in a better way and to get more accurate and reliable data. The operations included in data pre-processing are: Collecting the data, Cleaning the data from junk values/null values, transformation, normalization, feature selection and splitting of dataset. It will help to get a cleaned dataset by deleting all the unwanted entries and null/dummy values after data collection, data pre-processing must be performed to clean the data. To read and input the data to the model from the dataset, the Pandas tool is used. A data transformation is performed on a single data input to disseminate the data consistently and scale it into an acceptable range for the network through the normalization process. By normalizing the data, it will help to speed up the process and to reduce and eliminate data redundancy. The following Eq. (21) is used for transforming to an input value K from each data value V.
$K=K_{\text {low }}+\left(K_{\text {high }}-K_{\text {low }}\right) * \frac{\left(\mathrm{V}-V_{\text {low }}\right)}{\left(V_{\text {high }}\,\,-V_{\text {low }}\right)}$ (21)
$K_{\text {high }}$ and $K_{\text {low }}$ are calculated based on input-by-input method and it will scale input data into the appropriate range without increasing uniformity in the data.
4.3 Fuzzy inference
In the given dataset, both the input variables and output variables are of having different value types based on the range of data for each linguistic value. The input feature like age, gender, Blood pressure, cholesterol, and Diabetic history are having 5,4,3,2,1 linguistic value types. The output variable is heart attack risk factor has a 5 types of risk values (0, 1, 2, 3, 4). In general, 0-1 means normal and 2-4 means abnormal. Finally, in our model we are converting the target types into binary class (0 or 1) as required to represent the status of a patient like replacing 0-1 as normal and 2-4 as abnormal. The proposed framework is designed with the fuzzy rule base with 1200 rules by considering six input parameters with various linguistic term set. For example: if the patient is young and male, having diabetic history, blood pressure is high, cholesterol level is also high is having high risk of heart attack.
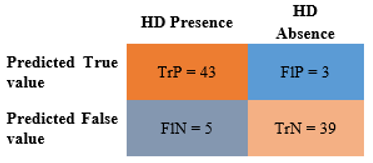
Figure 1. Confusion matrix
Precision, accuracy, F1-measures, and recall are the four separate metrics used to assess the performance of the suggested model. Here, a few key parameters are taken into consideration are as shown in Figure 1, including FlP (False Positive: the number of occurrences predicted incorrectly as necessary), TrP (True Positive: the number of occurrences predicted correctly as necessary), FlN (False Negative: the number of occurrences predicted incorrectly as not necessary), and TrN (True Negative: the number of occurrences predicted correctly as not needed). Then, the four metrics precision (Eq. (22)), accuracy (Eq. (23)), F1- measure (Eq. (25)), and recall (Eq. (24)) are calculated using the standard equations given below.
$Precision=\frac{\operatorname{Tr} P}{\operatorname{Tr} P+F l P}$ (22)
$Accuracy =\frac{\operatorname{Tr} P+\operatorname{Tr} N}{\operatorname{Tr} P+F l P+\operatorname{Tr} N+F l N}$ (23)
$Recall =\frac{\operatorname{TrP}}{\operatorname{TrP}+F l N}$ (24)
$F 1- Measure =\frac{2 \times { Precision } \times { Recall }}{ { Precision }+ { Recal }}$ (25)
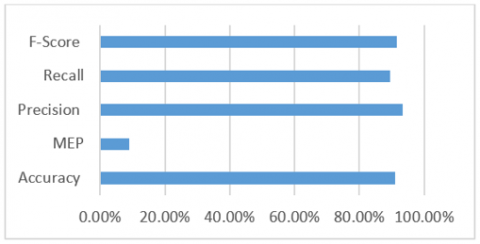
The Precision, Accuracy, Recall, and F1-Measure [1] are used to evaluate the designed framework and to show the improved performance. The use of accuracy alone may not be sufficient in the selection of a model and may often be misleading. It is often preferable to choose a model with a lower accuracy because it provides a more robust predictor of the problem. The proposed model achieved 91.11 percent accuracy, Precision is around 93.47 percent, Probability of Misclassification Error probability (MEP) is 8.89 percent, Recall is around 89.58%, Precision around 93.47 percent, and F-Score around 91.48 percent are shown in Figure 2. Both predictions can be predicted as the majority class value by model when the problem domain has a broad class imbalance. Therefore, for the proposed model preferred herewith the four different variables to achieve more reliable results.
Figure 2. Performances of updated learning of the neuro-fuzzy inference system using some of the measures.
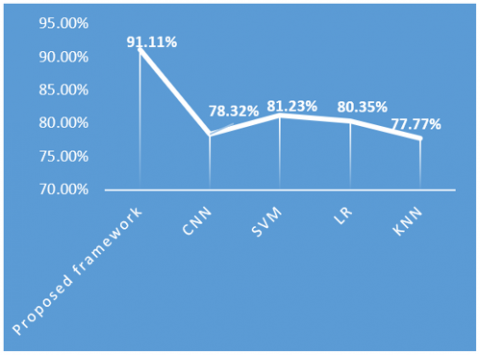
The overall performance of our proposed model is improved with the good classification accuracy and it is shown in the below Figure 3. The table shows the comparison of average classification accuracy of different methods like our proposed framework of 91.11%, CNN of 78.32%, Support Vector Machine of 81.23%, Logistic regression of 80.35% and K Nearest neighbors of 77.77%.
Figure 3. Performance comparison between proposed and few existing models like CNN, SVM, LR, and KNN
The experimentation of the modified learning of the neuro-fuzzy inference method using some of the measures is done. We also found good heart attack disease diagnostic precision, low misclassification error probability (MEP), good recall, accuracy, precision and F-score. This indicates that the proposed model for the prediction of heart attack disease works with good precision.
Medical data processing to predict the health issues is very important in the current life style of the people. One of most common disease identified in today’s era is that heart attack disease. Manual process of detecting and saving life is a tedious job and sometimes it is not possible. So, here proposing fuzzy inference with modified Convolutional Neural Network framework for predicting the heart attack. To assess the risk of coronary heart attack, the proposed technique is tested on medical sensor data. The input/output speed partitions define the number of rules derived from the training data as well as the quantity of fuzzy sets in the framework for each input variable. The time required to calculate preliminary modelling is decreasing by partitioning the input data. The proposed model achieves a good accuracy of 91.11% in detecting heart attack disease. It also predicts heart attack based on the data feed to the model on patient's condition. This approach primarily aims to minimize medical errors and to promote humanitarian efforts.
This work can be further improved with practical implementation for testing with the real-time sensor deployment on the patient’s body to collect the data and model can be tested.
[1] Benjamin, E.J., Virani, S.S., Callaway, C.W., Chamberlain, A.M., Chang, A.R., Cheng, S., Muntner, P. (2018). Heart disease and stroke statistics-2018 update: a report from the American Heart Association. Circulation, 137(12): e67-e492. http://dx.doi.org/10.1161/CIR.0000000000000558
[2] Rozyyev, A., Hasbullah, H., Subhan, F. (2011). Indoor child tracking in wireless sensor network using fuzzy logic technique. Research Journal of Information Technology, 3(2): 81-92. http://dx.doi.org/10.3923/rjit.2011.81.92
[3] Szewczyk, R., Osterweil, E., Polastre, J., Hamilton, M., Mainwaring, A., Estrin, D. (2004). Habitat monitoring with sensor networks. Communications of the ACM, 47(6): 34-40. http://dx.doi.org/10.1145/990680.990704
[4] Chauhdary, S.H., Bashir, A.K., Shah, S.C., Park, M.S. (2009). EOATR: energy efficient object tracking by auto adjusting transmission range in wireless sensor network. Journal of Applied Sciences, 9(24): 4247-4252. http://dx.doi.org/10.3923/jas.2009.4247.4252
[5] Biswas, P.K., Phoha, S. (2006). Self-organizing sensor networks for integrated target surveillance. IEEE Transactions on Computers, 55(8): 1033-1047. https://doi.org/10.1109/TC.2006.130
[6] Junaid, M.J.A., Kumar, R. (2020). Data science and its application in heart disease prediction. In 2020 International Conference on Intelligent Engineering and Management (ICIEM), pp. 396-400. London, UK. https://doi.org/10.1109/ICIEM48762.2020.9160056
[7] Subhadra, K., Vikas, B. (2019). Neural network based intelligent system for predicting heart disease. International Journal of Innovative Technology and Exploring Engineering, 8(5): 484-487.
[8] Karayılan, T., Kılıç, Ö. (2017). Prediction of heart disease using neural network. In 2017 international conference on computer science and engineering (UBMK), pp. 719-723. Antalya, Turkey. https://doi.org/10.1109/UBMK.2017.8093512
[9] Baihaqi, W.M., Setiawan, N.A., Ardiyanto, I. (2016). Rule extraction for fuzzy expert system to diagnose coronary artery disease. In 2016 1st International Conference on Information Technology, Information Systems and Electrical Engineering (ICITISEE), pp. 136-141. Yogyakarta, Indonesia. https://doi.org/10.1109/ICITISEE.2016.7803062
[10] Kasbe, T., Pippal, R.S. (2017). Design of heart disease diagnosis system using fuzzy logic. In 2017 International Conference on Energy, Communication, Data Analytics and Soft Computing (ICECDS), pp. 3183-3187. Chennai, India. https://doi.org/10.1109/ICECDS.2017.8390044
[11] Wedashwara, W., Mabu, S., Ahmadi, C. (2017). Parallel evolutionary association rule mining for efficient summarization of wireless sensor network data pattern. In 2017 5th International Conference on Cyber and IT Service Management (CITSM), pp. 1-6. Denpasar, Indonesia. https://doi.org/10.1109/CITSM.2017.8089232
[12] Li, L., Li, X., Lu, Z., Lloret, J., Song, H. (2017). Sequential behavior pattern discovery with frequent episode mining and wireless sensor network. IEEE Communications Magazine, 55(6): 205-211. https://doi.org/10.1109/MCOM.2017.1600276
[13] Ismail, W.N., Hassan, M.M., Alsalamah, H.A. (2019). Context-enriched regular human behavioral pattern detection from body sensors data. IEEE Access, 7: 33834-33850. https://doi.org/10.1109/ACCESS.2019.2904122
[14] Gawande, P.S., Rathod, A.B. (2016). A design of a fuzzy rule based expert system for predicting cardiac diseases. NCITSE
[15] Jindal, H., Agrawal, S., Khera, R., Jain, R., Nagrath. P. (2020). Heart disease prediction using machine learning algorithms. Materials Science and Engineering, 1022: 012072. 10.1088/1757-899X/1022/1/012072
[16] Diwakar, M., Tripathi, A., Joshi, K., Memoria, M., Singh, P. (2021). Latest trends on heart disease prediction using machine learning and image fusion. Materials Today: Proceedings, 37: 3213-3218. https://doi.org/10.1016/j.matpr.2020.09.078
[17] Boukerche, A., Samarah, S. (2009). In-network data reduction and coverage-based mechanisms for generating association rules in wireless sensor networks. IEEE Transactions on Vehicular Technology, 58(8): 4426-4438. https://doi.org/10.1109/TVT.2009.2020802
[18] Tsai, H.P., Yang, D.N., Chen, M.S. (2009). Mining group movement patterns for tracking moving objects efficiently. IEEE Transactions on Knowledge and Data Engineering, 23(2): 266-281. https://doi.org/10.1109/TKDE.2009.202
[19] Rashid, M.M., Gondal, I., Kamruzzaman, J. (2013) ACSP-tree: A tree structure for mining behavioral patterns from wireless sensor networks. 38th Annual IEEE Conference on Local Computer Networks, pp. 691-694, Sydney, NSW. https://doi.org/10.1109/LCN.2013.6761312
[20] Rashid, M.M., Gondal, I., Kamruzzaman, J. (2014). A novel algorithm for mining behavioral patterns from wireless sensor networks. In 2014 International Joint Conference on Neural Networks (IJCNN), pp. 3713-3719. Beijing, China. https://doi.org/10.1109/IJCNN.2014.6889737
[21] Kalnoor, G., Agarkhed, J. (2016). Pattern matching intrusion detection technique for Wireless Sensor Networks. In 2016 2nd International Conference on Advances in Electrical, Electronics, Information, Communication and Bio-Informatics (AEEICB), pp. 724-728. Chennai, India https://doi.org/10.1109/AEEICB.2016.7538389
[22] Rashid, M.M., Kamruzzaman, J., Wasimi, S. (2019). Sliding window-based regularly frequent patterns mining Over Sensor Data Streams. In 2019 IEEE Asia-Pacific Conference on Computer Science and Data Engineering (CSDE), pp. 1-6. Melbourne, Australia, https://doi.org/10.1109/CSDE48274.2019.9162413
[23] Erdogan, S.Z., Bilgin, T.T. (2012). A data mining approach for fall detection by using k-nearest neighbour algorithm on wireless sensor network data. Iet Communications, 6(18): 3281-3287. https://doi.org/10.1049/iet-com.2011.0228
[24] Ravish, D.K., Shanthi, K.J., Shenoy, N.R., Nisargh, S. (2014). Heart function monitoring, prediction and prevention of heart attacks: using artificial neural networks. In 2014 International Conference on Contemporary Computing and Informatics (IC3I), pp. 1-6. Mysore, India. https://doi.org/10.1109/IC3I.2014.7019580
[25] Tang, D., Yang, C., Zheng, J., Canton, G., Bach, R.G., Hatsukami, T.S., Yuan, C. (2013). Image-based modeling and precision medicine: patient-specific carotid and coronary plaque assessment and predictions. IEEE Transactions on Biomedical Engineering, 60(3): 643-651. https://doi.org/10.1109/TBME.2013.2242891
[26] Samarah, S., Al-Hajri, M., Boukerche, A. (2010). A predictive energy-efficient technique to support object-tracking sensor networks. IEEE Transactions on Vehicular Technology, 60(2): 656-663. https://doi.org/10.1109/TVT.2010.2102375
[27] Manikandan, S. (2017). Heart attack prediction system. In 2017 International Conference on Energy, Communication, Data Analytics and Soft Computing (ICECDS), pp. 817-820. Chennai, India. https://doi.org/10.1109/ICECDS.2017.8389552
[28] Sasidharan, P., Rajalakshmi, T., Snekhalatha, U. (2019). Wearable cardiorespiratory monitoring device for heart attack prediction. In 2019 International Conference on Communication and Signal Processing (ICCSP), pp. 0054-0057. Chennai, India. https://doi.org/10.1109/ICCSP.2019.8698059