Roopa B. Kakkeri* | Dattatraya S. Bormane
© 2022 IIETA. This article is published by IIETA and is licensed under the CC BY 4.0 license (http://creativecommons.org/licenses/by/4.0/).
OPEN ACCESS
Temporomandibular joint (TMJ) disorder is a wide term that encompasses a variety of disorders with varying etiologies. The purpose of this study was to analyses electromyographic signals with wavelet transform for the diagnostic methods which help in TMJ issues in patients who visited the Dental Centre. Due to the increasing importance of electromyography signals in diagnosing muscular disorders, such as temporomandibular joint disorder, it has been widely used. Through various techniques, such as discrete wavelet transform and power spectral density, it is possible to identify and minimize the noise in the signals, which can be very useful in the diagnosis of the disorder. This paper presents an algorithm that combines the features of discrete wavelet transform and multivariate analysis in order to detect temporomandibular joint disorder. Support vector machine model is giving the better performance in terms of training, testing time and accuracy with 93% compared to other models. Multivariate analysis shows the significant difference in the feature variable chosen.
discrete wavelet transform, K-nearest neighbor, support vector machine, random forest, temporomandibular joint, surface electromyograph
Electromyography is a technique that uses electrical signals from the muscles of the central nervous system to diagnose and detect various disorders [1]. This study shows that the signals from the masticatory muscles have been used to detect the temporomandibular joint disorder (TMD). The internal and external muscles of the masticatory joint are two types of muscles. The external muscles are the temporalis and the masseter muscles [2]. The symptoms of temporomandibular joint disorder vary. Some of these include clicking and biting on the jaw joint. It can also cause shoulder and neck pain [3]. This study explores the use of a signal processing tool known as wavelet transform to extract the various features of an electromyography signal. Wavelets were then used to extract the necessary components from an electromyography signal [4]. The resulting signal was reconstructed using minimal interference. The wavelet transform was then used to extract the various features of an effective EMG signal. The results of the study revealed that only the first and second level features of the wavelet transform were able to improve the class separability [5]. The signal-to-noise ratio of an electromyography signal is affected by the size of the electrode's impedance [6]. After recording the signals, the feature extraction, pre-processing, and the reconstruction of the signal were carried out. Techniques used to detect and classify the signals from the muscles are usually advanced [5]. In this study, the wavelet transform was used to remove noise from the surface EMG. In this paper, section 2 is discussed on related work, section 3 on materials and methods, section 4 on experimental results followed by data analysis and conclusion.
Recent studies also reported that the SMEG protocol is not as accurate as electromyography due to the lack of relevant and significant studies [7]. These studies cited various factors such as inadequate sample selection and improper use of equipment [8]. However, these limitations could be overcome if the procedures are followed properly. For instance, if the results are reproducible and follow the same standards, SMEG could be an efficient method to study the electrical activity of masticatory muscles [9].
Current literature supports the use of SMEG for the diagnosis of TMD in the masticatory muscles [10]. The use of the electromyography (EMG) in various medical domains has been widely used. It is commonly used for the diagnosis of various disorders such as neuromuscular disorder and myopathy [11].
The results of the study revealed that the SPO-SVM performed better than other classifiers when it came to classification accuracy. The Random Forest classifier was also able to achieve a higher accuracy than the other classifiers. The temporal features of the EMG signals were extracted using the entropies. They were then classified using the K-NN and DWT classifiers.
3.1 Signal acquisition
A study was carried out at a Noble Hospital and Research Centre in India to identify male and female patients who were screened for various symptoms. The subjects were selected based on their demographic information, with 100 patients with age group of 20-60 years included in the study, 45% male and 55% were females. The study was carried out from 2017 to 2018. Information about the nature of the research project and the conditions that it seeks to study must be provided to enable people to make informed decisions regarding their participation in the study. This information should also include details about the health condition that the study is designed to address. The patients were asked to fill out a consent form. The individuals in this research had no history of orthodontic treatment and had not received any TMJ surgical operation for any underlying illness. The study was approved by the Neurology Department of the hospital and research Centre. All participants were asked to follow proper instructions. The EMG signals were collected simultaneously from two face muscles, the masseter and temporalis, using two pairs of bipolar AG/Agcl electrodes positioned on the midline of each muscle belly [10]. Each bipolar pair has a one-inch center-to-center spacing. On the forehead, the reference electrode was inserted. The two-channel EMG signal system was further connected to a data collecting card (6024 E). On the SEMG for non-invasive assessment of muscles (SENIAM) project, a group of European specialists cooperated to create an established set of criteria for the collection and processing of SEMG signals; one followed these guidelines [12].
3.2 Subjects
Over eighty male and female adolescent participants were evaluated for their muscle function to detect the Temporomandibular joint disorder. The inclusion criteria were based on the participant's informed consent. The exclusion criteria included a history of psychological or medical treatment, previous surgical procedures, and a history of orthodontic treatment for the jaws [11]. Sample size is based on the root mean square and the electromyographic signals from the anterior bundles and masseter muscles with α=0.05, β=0.20 and 80% test power [8]. The current research recruited the support of 84 subjects. There were 41 participants in the monitoring healthy group and the rest were in the study group. Each subject has a full dental history taken and intraoral photographs from an Orth pentagram (OPG) are taken to identify radiographic evaluation of TMJ parameters. The non-invasive method for acquiring EMG signals was chosen over the invasive method [13], which used single use and sticky type electrodes for EMG signal acquisition. Because the study concentrated on the temporal and masseter muscles, the first electrode was put on the masseter, the second on the temporal muscle as a reference electrode, and the reference on the forehead as a ground electrode [14]. The EMG recording of these muscles was done in both groups at rest position and during maximum clenching.
The signals were obtained using an 4-channel module (EMG System do Brasil Ltda®), that consists of a conditioner and a band pass filter with cut-off frequencies of 20 and 1,000 Hz, an amplifier gain of 1,000 and a common mode rejection ratio > 120 dB [9]. All data was acquired and processed using a 16-Bit analog to digital converter with a sampling frequency of 2 kHz.
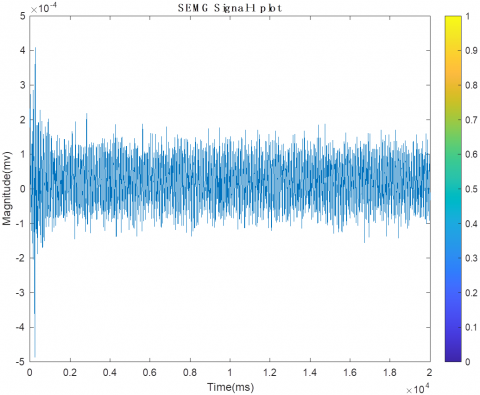
The system was composed of bipolar electrodes positioned on the floor. The participants were asked to remain seated while their heads were parallel to the ground. The attachment sites were cleaned with a cotton ball to remove any impurities. The Ag/AgCl surface electrodes were attached to the belly region of the muscle after performing moderate intercuspation. Bandage tape was utilized to secure the electrodes [15]. The distance between the two electrodes was 20 mm, which is as suggested by an international organization [11]. Figure 1 shows the raw electromyographic signals during maximal voluntary clenching.
Figure 1. Raw EMG signal during maximal voluntary clenching
3.3 Signal processing methods
The wavelet transform is an efficient and suitable tool for non-stationary signals analysis such as EMG [16]. It decomposes the signal into a set of wavelets obtained by dilatation in scale and translation in time of mother wavelet [17]. It can be defined as follows. Generally, the wavelet transform can be expressed by the following Eq. (1):
$F(a, b)=\int_{-\infty}^{\infty} f(x) \varphi_{(a, b)}^{*} x d x$ (1)
where the * is the complex conjugate symbol and function ψ is some function. This function can be chosen arbitrarily provided that it obeys certain rules.
$\emptyset(x)=\sum_{-\infty}^{\infty} a_{k} \emptyset\left(S_{x}-k\right)$ (2)
where, S is a scaling factor [18]. Moreover, the area between the function must be normalized and scaling function must be orthogonal to its integer translations. Discrete wavelet transform can be used for easy and fast denoising of a noisy signal [10]. If we take only a limited number of highest coefficients of the discrete wavelet transform spectrum, and we perform an inverse transform (with the same wavelet basis) we can obtain more or less denoised signal. The wavelet is obtained from the scaling function as:
$\phi(x)=\sum_{k=-\infty}^{k=+\infty}(-1)^{k} a_{N-1-k} \phi(2 x-k)$ (3)
where, N is an even integer [14]. The set of wavelets than forms an orthonormal basis which we use to decompose signal.
3.4 Feature extraction method
Discrete wavelet transform (DWT) is usually used to decompose the digital signals into discrete coefficients [5]. It uses the space-saving coding based on orthogonal or bi-orthogonal wavelet, and thus does not produce the redundant analysis. The DWT decomposition is given by the following Eq. (4).
$D W T(j, k)=\frac{1}{\sqrt{|a|}} \sum_{1=1}^{n} S(i) \varphi_{(a, b)}(i)$ (4)
where a=2j, b= 2j k, S (i) is the original signal, and DWT (j, k) is a sampling of ψ(a, b) at discrete points j and k. The wavelet decomposition is performed by taking into account the selection of the mother wavelet, which should be similar shape. The SEMG is a time and force dependent signal that can be used to define characteristic properties [19]. Data sets are very difficult to analyses, as statistical calculations require many points to be available for analysis. Instead, many of the data points can be obtained through a process known as windowing. The popularity of wavelet analysis has been increasing, as it can be performed in frequency range. This has led to the emergence of discrete wavelet transform, which is a better alternative to continuous wavelet transform. The DWT algorithm has been used for the Denoising of the SEMG [6]. It has yielded better results than the previous method due to the use of a different wavelet for a different window of 40 coefficients.
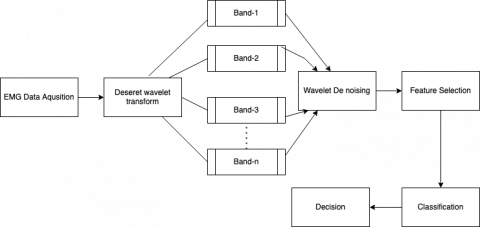
Figure 2. Block diagram of the proposed system
Wavelet denoising happens by performing a multilevel decomposition by obtaining approximation and detailed coefficients then analysing the details and identifying the threshold in techniques and lately they showed the detailed coefficients and reconstructing the signals [20].
Figure 2 shows block diagram of proposed system. DWT helps in representing the SEMG signal with fewer coefficients after De noising and compressing the signal which enables Sparse representation DWT is similar to comparing a signal with discrete multi rate filter bank which is hierarchal [5]. These filters have ability to reconstruct the sub-bands in all level of decomposition with this technique we have captured the signal with few large magnitude DWT coefficient while the smaller DWT coefficients is the noise [9, 10]. we note that filter coefficients for l (low pass) and h (high pass) should be related as follows:
hk=(−1)kln−k−1, k∈{0,...,n−1} (5)
where n denotes the length of the filter.
This is how the multi resolution happens while analysing signals progressively narrow sub bands at different resolution by helping the denoising and compressing [18]. The function outputs the fifth level approximation coefficients along with detailed coefficients from level 1 to 5. These filters in Figure 2 have ability to reconstruct the Sub bands in all levels of decomposition. Machine learning applications in medical domain are discussed in [19]. LRA DNN methods offered a complete overview of the newest neural network known as Capsule Network (CapsNet), which finds use in a variety of sectors including IoT [20].
After taking the energy components from each band and applying different threshold level each feature was scaled and applied to different classifiers [21]. 75% is chosen as the margin to select feature so as dominant feature values are selected. A lower margin value would select values due to noises and a higher value may exclude features vectors of average values which would contribute in detecting the disorder.
Wavelet based features reduces the dimension by spectral analysis and has improved the classification in detecting the TMJ disorder. After applying the extracted and scaled features to different classifiers like logistic regression (LR) [13], Linear discriminant analysis (LDA) [12] and support vector machine (SVM) [11] SVM is giving the better accuracy. A summary of SEMG classification technique is shown in Table 1.
Table 1. Summary of performance of different classifiers
|
Model |
Training process time (SEC) |
Testing process time (SEC) |
Accuracy (%) |
|
LR |
1.80 |
0.28 |
91 |
|
SVM |
0.10 |
0.05 |
93 |
|
LDA |
0.09 |
0.04 |
87 |
|
KNN |
0.11 |
0.06 |
91.5 |
|
Decision tree |
0.11 |
0.042 |
92.1 |
The study demonstrates that by employing sophisticated denoising algorithms, numerous uncertain noise sources in a signal may be greatly reduced. Researchers are employing a variety of signal processing technologies to eliminate or attenuate sounds that arise during recording and processing. Based on the research examined, the DWT showed to be the best strategy. In the case of the TMJ problem detection system, two primary criteria were used: a comprehensive list, as well as reliability and accuracy. He proposed the SVM classifier [14] for classification. Furthermore, a hybrid classification algorithm or a mix of processing methods is proposed for improving classification accuracy and other performance characteristics. Because of the enormous number of recovered features for the filtered signal, the detection accuracy is increased.
The objective of this study is to investigate and examine interaction impact of gender and group on right temporalis rest and left temporalis.
Hypothesis
Hypothesis 1
Null: There is no significant interaction impact of gender and group on right temporalis rest.
Alternative: There is a significant interaction impact of gender and group on right temporalis rest.
Hypothesis 2
Null: There is no significant interaction impact of gender and group on left temporalis MVC.
Alternative: There is a significant interaction impact of gender and group on left temporalis MVC.
Research methodology
The current study adopts descriptive research design and deductive approach of research. Table 2 shows the descriptive statistics for the variable right temporalis rest. Similar calculations are done for other features during rest and maximum voluntary clenching as seen in Table 3. The total sample size is 100 divided into control and experimental group. Probability simple random sampling has been used for the current study. Table 4 represents multivariate analysis for the variable right temporalis rest. Both primary and data collection sourced have been used. SPSS 26 tool and multivariate two-way ANOVA technique [20] is used to evaluate interaction impact of gender and group on right temporalis rest and left temporalis MVC.
Table 2. Descriptive statistics for the variable right temporalis rest (Dependent variable: Right temporalis rest)
|
Gender |
Group |
Mean |
Std. Deviation |
N |
|
male |
experimental |
24.4578 |
7.16797 |
23 |
|
control |
3.9821 |
3.15609 |
22 |
|
|
Total |
14.4475 |
11.72972 |
45 |
|
|
female |
experimental |
18.0968 |
9.01439 |
27 |
|
control |
3.2940 |
3.01229 |
27 |
|
|
Total |
10.6954 |
10.00645 |
54 |
|
|
Total |
experimental |
21.0229 |
8.74308 |
50 |
|
control |
3.6029 |
3.06472 |
49 |
|
|
Total |
12.4009 |
10.92936 |
99 |
Table 3. Multivariate analysis for the variable right temporalis rest (Dependent variable: Right temporalis rest)
|
Source |
Type III Sum of Squares |
df |
Mean Square |
F |
Sig. |
|
Corrected Model |
8017.993a |
3 |
2672.664 |
68.842 |
.000 |
|
Intercept |
15233.077 |
1 |
15233.07 |
392.371 |
.000 |
|
Gender |
304.835 |
1 |
304.835 |
7.852 |
.006 |
|
Group |
7635.096 |
1 |
7635.096 |
196.664 |
.000 |
|
Gender * Group |
197.419 |
1 |
197.419 |
5.085 |
.026 |
|
Error |
3688.196 |
95 |
38.823 |
|
|
|
Total |
26930.575 |
99 |
|
|
|
|
Corrected Total |
11706.189 |
98 |
|
|
|
|
a. R Squared = .685 (Adjusted R Squared = .675) |
|||||
Table 4. Descriptive statistics for the variable left temporalis MVC (Dependent variable: Left temporalis MVC)
|
Gender |
Group |
Mean |
Std. Deviation |
N |
|
male |
experimental |
119.8190 |
21.66850 |
23 |
|
control |
98.8683 |
20.37376 |
22 |
|
|
Total |
109.5764 |
23.34619 |
45 |
|
|
female |
experimental |
128.5338 |
17.73017 |
27 |
|
control |
89.4992 |
13.96943 |
27 |
|
|
Total |
109.0165 |
25.25983 |
54 |
|
|
Total |
experimental |
124.5250 |
19.92135 |
50 |
|
control |
93.7057 |
17.59189 |
49 |
|
|
Total |
109.2710 |
24.28714 |
99 |
Figure 3. Normal Q_Q plot for EMM of right temporalis rest
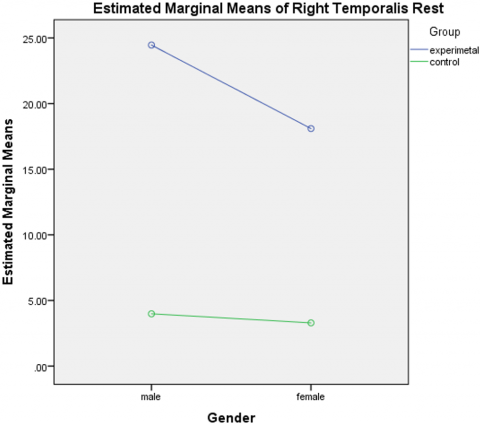
Parametric multivariate two way ANOVA is applied to examine interaction impact of Gender & group (Control and Experimental) on Right Temporalis Rest. Group sizes of Male - control, Male – Experimental, Female – control, Female – Experimental are comparable thus the t-statistics / ANOVA can be quite robust to violence to normality and power of t / f also appear to be relative unaffected by non-normality (Donaldson 1968) p value of Levene’s test > 0.05 indicating homogeneity of variance in four groups.
P value of interaction effect = 0.026 indicating significant interaction impact of gender and group (control and experimental on Right Temporalis Rest. It is seen from Figure 3 that mean score of Right Temporalis Rest is more for both male and female in case of experimental group. Estimated marginal means (EMM) of all features were calculated using normal Q-Q plot to check the normality. The same plot is shown for one of the feature left temporalis MVC in Figure 4.
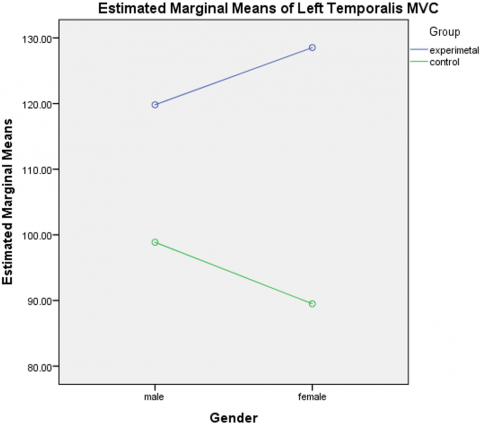
Figure 4. Normal Q-Q plot for EMM of left temporalis MVC
Parametric multivariate two-way ANOVA is applied to examine interaction impact of Gender & group (Control and Experimental) on Left Temporalis MVC. Group sizes of Male - control, Male – Experimental, Female – control, Female – Experimental are comparable thus the t-statistics / ANOVA can be quite robust to violence to normality and power of t / f also appear to be relative unaffected by non-normality (Donaldson 1968) p value of levene’s test > 0.05 indicating homogeneity of variance in four groups.
P value of interaction effect = 0.017 indicating significant interaction impact of gender and group (control and experimental on Left Temporalis MVC. It is seen that mean score of Left Temporalis MVC is more for both male and female in case of experimental group.
The aim of this paper is to process the noise associated with raw SEMG signals and extract the feature features and apply to the classification algorithms followed by multivariate statistical analysis. This study emphasis on wavelet analysis. These methods of de-noising, classifying and analysing with multivariate approach and counter the optimal method for the detection of TMG disorder using SEMG. This method will definitely help the doctors and researchers in diagnosing the disorders related to different muscles. Therefore, this paper developed new approach of signal representation and classification with multivariate approach for further analysis of classification, we can interlink the features of left and right side muscles and there variations to improve the decision. The approach of feature fusion for multiple observations and there inter correlative variations could give better decision in detecting Temporomandibular joint disorder.
|
S |
scaling factor |
|
$\varphi(x)$ |
Scaling function |
|
$F(a, b)$ |
Wavelet transform |
|
N |
Sample size |
|
n |
Length of the filter |
[1] Pitta, N C., Nitsch, G.S., Machado, M.B., de Oliveira, A.S. (2015). Activation time analysis and electromyographic fatigue in patients with temporomandibular disorders during clenching. Journal of Electromyography and Kinesiology, 25(4): 653-657. https://doi.org/10.1016/j.jelekin.2015.04.010
[2] Ishii, T., Narita, N., Endo, H. (2016). Evaluation of jaw and neck muscle activities while chewing using EMG-EMG transfer function and EMG-EMG coherence function analyses in healthy subjects. Physiology & Behavior, 160: 35-42. https://doi.org/10.1016/j.physbeh.2016.03.023
[3] Shi, X., Qin, P., Zhu, J., Zhai, M., Shi, W. (2020). Feature extraction and classification of lower limb motion based on sEMG signals. IEEE Access, 8: 132882-132892. https://doi.org/10.1109/ACCESS.2020.3008901
[4] Benazzouz, A., Guilal, R., Amirouche, F., Slimane, Z. E.H. (2019). EMG feature selection for diagnosis of neuromuscular disorders. In 2019 International Conference on Networking and Advanced Systems (ICNAS), Annaba, Algeria, pp. 1-5. https://doi.org/10.1109/ICNAS.2019.8807862
[5] Burhan, N., Ghazali, R. (2016). Feature extraction of surface electromyography (sEMG) and signal processing technique in wavelet transform: A review. In 2016 IEEE International Conference on Automatic Control and Intelligent Systems (I2CACIS), Selangor, Malaysia, pp. 141-146. https://doi.org/10.1109/I2CACIS.2016.7885304
[6] Santana-Mora, U., López-Ratón, M., Mora, M.J., Cadarso-Suárez, C., López-Cedrún, J., Santana-Penín, U. (2014). Surface raw electromyography has a moderate discriminatory capacity for differentiating between healthy individuals and those with TMD: A diagnostic study. Journal of Electromyography and Kinesiology, 24(3): 332-340. https://doi.org/10.1016/j.jelekin.2014.03.001
[7] Phinyomark, A., Khushaba, R.N., Scheme, E. (2018). Feature extraction and selection for myoelectric control based on wearable EMG sensors. Sensors, 18(5): 1615. https://doi.org/10.3390/s18051615
[8] Sabaneeff, A., Caldas, L.D., Garcia, M.A.C., Nojima, M.D.C.G. (2017). Proposal of surface electromyography signal acquisition protocols for masseter and temporalis muscles. Research on Biomedical Engineering, 33: 324-330. http://dx.doi.org/10.1590/2446-4740.03617
[9] Szyszka-Sommerfeld, L., Machoy, M., Lipski, M., Woźniak, K. (2019). The diagnostic value of electromyography in identifying patients with pain-related temporomandibular disorders. Frontiers in Neurology, 10: 180. https://doi.org/10.3389/fneur.2019.00180
[10] Tanaka, Y., Tsugawa, T., Maeda, Y. (2017). Effect of mouthguards on impact to the craniomandibular complex. Dental Traumatology, 33(1): 51-56. https://doi.org/10.1111/edt.12283
[11] Liu, X., Xi, X., Hua, X., Wang, H., Zhang, W. (2020). Feature extraction of surface electromyography using wavelet weighted permutation entropy for hand movement recognition. Journal of Healthcare Engineering, 2020: 8824194. https://doi.org/10.1155/2020/8824194
[12] Ueda, H.M., Kato, M., Saifuddin, M., Tabe, H., Yamaguchi, K., Tanne, K. (2002). Differences in the fatigue of masticatory and neck muscles between male and female. Journal of Oral Rehabilitation, 29(6): 575-582. https://doi.org/10.1046/j.1365-2842.2002.00869.x
[13] Subasi, A. (2013). Classification of EMG signals using PSO optimized SVM for diagnosis of neuromuscular disorders. Computers in Biology and Medicine, 43(5): 576-586. https://doi.org/10.1016/j.compbiomed.2013.01.020
[14] Sun, H., Zhang, X., Zhao, Y., Zhang, Y., Zhong, X., Fan, Z. (2018). A novel feature optimization for wearable human-computer interfaces using surface electromyography sensors. Sensors, 18(3): 869. https://doi.org/10.3390/s18030869
[15] Osisanwo, F.Y., Akinsola, J.E.T., Awodele, O., Hinmikaiye, J.O., Olakanmi, O., Akinjobi, J. (2017). Supervised machine learning algorithms: classification and comparison. International Journal of Computer Trends and Technology (IJCTT), 48(3): 128-138. https://doi.org/10.14445/22312803/IJCTT-V48P126
[16] Eisenberg, G.D., Fyvie, K. G. H. M., Mohamed, A.K. (2017). Real-time segmentation and feature extraction of electromyography: Towards control of a prosthetic hand. IFAC-PapersOnLine, 50(2): 151-156. https://doi.org/10.3390%2Fs21206863
[17] Jian, C., Wei, M., Luo, J., Lin, J., Zeng, W., Huang, W., Song, R. (2017). Multiparameter electromyography analysis of the masticatory muscle activities in patients with brainstem stroke at different head positions. Frontiers in Neurology, 8: 221. http://dx.doi.org/10.3389/fneur.2017.00221
[18] Bangare, S.L. (2022). Classification of optimal brain tissue using dynamic region growing and fuzzy min-max neural network in brain magnetic resonance images. Neuroscience Informatics, 2(3): 100019. https://doi.org/10.1016/j.neuri.2021.100019
[19] Bangare, S.L., Pradeepini, G., Patil, S.T. (2017). Neuroendoscopy adapter module development for better brain tumor image visualization. International Journal of Electrical & Computer Engineering, 7(6): 3643-3654. http://dx.doi.org/10.11591/ijece.v7i6.pp3643-3654
[20] Shelke, N., Chaudhury, S., Chakrabarti, S., Bangare, S. L., Yogapriya, G., Pandey, P. (2022). An efficient way of text-based emotion analysis from social media using LRA-DNN. Neuroscience Informatics, 2(3): 100048. https://doi.org/10.1016/j.neuri.2022.100048
[21] Gupta, S., Kumar, S., Bangare, S.L., Nuhmani, S., Alguno, A.C., Samori, I.A. (2022). Homogeneous decision community extraction based on end-user mental behavior on social media. Computational Intelligence and Neuroscience, 2022: 3490860. https://doi.org/10.1155/2022/3490860