Jyoti G. Borade* | Arvind W. Kiwelekar | Laxman D. Netak
© 2022 IIETA. This article is published by IIETA and is licensed under the CC BY 4.0 license (http://creativecommons.org/licenses/by/4.0/).
OPEN ACCESS
Manual grading of students’ work takes a long time and it is stressful. Evaluator may be holistic or analytic, lenient or non-lenient, experienced or inexperienced; which leads to non-uniformity in the assessment. Therefore, it is essential to do the automated grading of students' work to overcome human inadequacies through uniform assessment and also, it reduces workload of human evaluators. A novel automatic grading of students' PowerPoint presentation skills using Latent Semantic Analysis (LSA) is proposed. Program is implemented in python to extract features corresponding to the text appearance, graphics, footer, and hyperlink from the PowerPoint presentations. PowerPoint presentations are represented using feature vectors in the Latent Semantic Space using Singular Value Decomposition (SVD). SVD reveals relationships between features and PowerPoint presentations. The grades for the students' PowerPoint presentations are evaluated by finding Cosine similarity with reference presentations or finding k number of nearest reference presentations. The grades of such reference or nearest presentations are used to grade students' presentations. Kneighbors classifier used to find nearest neighbors. Kneighbors and Cosine Similarity approach give 90.90% and 81.81% accuracy, respectively, while predicting the grades for the students’ PowerPoint presentations.
automatic grading, latent semantic analysis, singular value decomposition, Kneighbors, cosine similarity, Euclidian distance
Automated grading is an emerging technology helpful to teachers and students. It reduces the paper load of teachers and assessment-related issues. Some teachers can give overall grades based on one good impression in particular aspects or slight inclination towards their favorite students. It may lead to inconsistencies and inaccuracies in the assessment. Grading of students' work provides feedback to students for enhancing work quality. Hence, there is a need of automated grading system [1, 2]. To grade various kinds of work like reviewing research articles, evaluating programming assignments, poetry, short and long responses, various automatic grading systems have been developed. Page and Paulus employed statistical techniques to relate writing style to grade in 1968, but they neglected actual text. Some researchers applied Natural Language Processing (NLP) to retrieve linguistic features from text and then evaluated it using a variety of machine learning (ML) techniques like Support Vector Machine (SVM), Multilayer Perceptron (MLP), and Linear and Logistic regression, K-nearest Neighbors (KNN), Decision Tree (DT), and Random Forest (RF). Some have designed automated grading system using various deep learning techniques. Deep neural networks can extract features automatically. Many researchers have designed evaluation systems for various languages.
Automated grading system using LSA are also available. LSA is a machine learning method and the theory of information representation. LSA uses a mathematical approach to extract and infer relations from the contextual usage of words in the given dataset. We can evaluate answer sheets, articles, research papers, programming codes using LSA. LSA uses a term-document matrix, and each row represents a term that occurred in the documents, while each column corresponds to each document in the dataset. The matrix is then decomposed using the SVD method into three other matrices, and their dimensions are reduced to remove the noise in the documents. Using SVD, new relationships between terms and documents get uncovered. Then the matrix will be used to obtain the similarity between the student's essay and the reference essay. In LSA, documents are mapped closer in the vector semantic space and cluster similar documents.
There is no study on how to assess the student's presentation skills. Although some researchers may consider it a minor aspect, the student must learn proper presentation skills. Design and delivery of a presentation are soft skills that will help students to increase employability skills in their professional lives. Project and Seminar presentations are essential academic activities in the curriculum of Indian universities in undergraduate studies. Presentation skill covers technical and non-technical aspects like a scholar's knowledge and presentation quality. The presentation should be graded based on the presentation quality and the accuracy and authenticity of the contents covered in the presentation. Our main objective is to evaluate the presentation quality of the PowerPoint presentations. The teachers use rubrics designed by their institute or department or sometimes use their expertise and experience to grade instead of using rubrics. This will lead to inconsistencies and inaccuracies in the assessment. Hence, we have developed automated system to grade students' PowerPoint presentations. The aim of our research study is to evaluate PowerPoint presentations with selected features and compare the grades awarded by LSA approach with grades awarded by the teachers. The features of student’s PowerPoint presentation are compared to the features that are found in a group of reference PowerPoint presentations in the semantic vector space. We have used the LSA approach to represent PowerPoint presentations in the semantic vector space. Students' PowerPoint presentations are graded using similar and nearest reference PowerPoint presentations using Cosine similarity and Kneighbors approach. Kneighbors predicts the grades of students’ PowerPoint presentations with more accuracy as compared to Cosine similarity. Kneighbors and Cosine similarity approach give 90.90% and 81.81% accuracy respectively. Thus, the quality of grading of PowerPoint presentations is more reliable, robust, fast and free from favoritism and inconsistency.
The structure of this research paper is as follows. Literature review is presented in section 2. Section 3 describes methodology for automated grading of PowerPoint presentations using LSA. Feature extraction from PowerPoint presentations is presented in section 4. Singular value decomposition is illustrated in section 5. Grading of PowerPoint presentations using Cosine similarity and Kneighbours approach is illustrated in section 6. Final results using Cosine similarity and Kneighbours approach is discussed in section 7. Our work is concluded in section 8.
Several automated grading systems are available to grade different types of work automatically. Haendchen Filho et al. [3] developed an SVM model to grade high school children's essays. They used features emphasizing on argumentative structure, lexicon diversity, connectives, textual cohesion, and adherence to the theme. Efficiency of the machine learning model can be increased with a small dataset using imbalanced learning techniques [4]. Ajitiono and Widyani [5], Eid and Wanas [6], Contreras et al. [7], and Lam et al. [8] used Natural Language Processing (NLP) to extract a variety of linguistic features presenting the quality of essays like vocabulary, syntax, grammar, spelling, capitalization, and punctuation. Lexical features like whole word, prefix/suffix, stemmed word, lemmatized word. Grammar and syntax-related features like POS, usage of noun, verb, prepositional, conjunction. Also, features like vocabulary per passage, percentage of difficult words, rhetorical features, the proportion of grammar error, and usage errors. Further applied various machine learning techniques to grade essays.
Fazal et al. [9] developed a grading system to grade spellings using rubrics. They classified each word into four categories: simple, common, difficult, and challenging, and counted correct and incorrect words in each class. In the end, marks are assigned based on their rule-based algorithm. Leng et al. [10] proposed reviewing research articles using deep learning, and Parihar et al. [11] proposed a model to grade C programming assignments using clustering of similar submissions and measuring the distance from correct solutions in semantic space. Al-Jouie and Azmi [12] and Bashir et al. [13] graded long answers in Arabic. Ajitiono and Widyani [14] graded descriptive answers in the Indonesian language. Walia et al. [15] graded answers in the Punjabi language. Ratna et al. [16] graded answers in the Japanese language using a winnowing algorithm. In 2010, Peng et al. [17] built automated Chinese essay scoring using Vector Space Models. Suleiman et al. [18] developed poetry grading in Arabic language using Hidden Markov Model (HMM). They used HMM for speech tagging, morphological analysis, syntactic structure, and text classification. Olowolayemo et al. [19] mapped students' answers with model answers to measure textual similarity using Levenshtein distance and Cosine similarity measures. Janda et al. [20] used the graph-based relationship to determine semantic similarity. They used SVM, Random Forest Regressor, and three-layer neural network models for predicting results.
Srihari et al. [21] developed a model to test the students' reading comprehension. Islam and Hoque [22] developed automated scoring for the Bangla language using LSA. Zen et al. [23] used LSA to grade computer programming assignments using cosine similarity between students' and reference assignments. Ratna et al. [24] proposed a grading system using LSA with learning vector quantization, an artificial neural network, and word similarity enhancement to grade answers. LaVoie et al. [25] used LSA techniques to score short answer responses to the consequences test. In 2010, Islam and Hoque [26] used n-gram instead of word for term-document matrix for the AEG system.
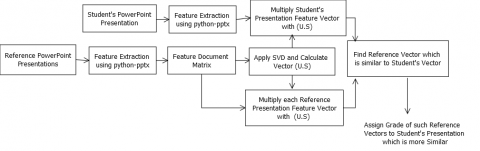
Figure 1 depicts the proposed framework for automated grading of PowerPoint presentations using LSA. The grades of the PowerPoint presentations are evaluated by using the Kneighbors and Cosine similarity approach in Latent Semantic Space. The first process of this system is to extract features contributing to the quality of the PowerPoint presentations from all the PowerPoint presentations. Feature extraction is done by writing a program in python using the python-pptx library [2]. Then prepared a feature-document matrix. Each row of the matrix represents features in the PowerPoint presentations, while each column corresponds to each PowerPoint presentation. The matrix is then decomposed using the Singular Value Decomposition (SVD) method into three other matrices, and their dimensions are reduced to remove noise in the documents and unimportant details from the dataset. The truncated SVD matrices are used to prepare vectors for the PowerPoint presentations. Reference vectors represent the vectors of reference presentations, and query vector represents a vector of student’s presentations whose grade is predicted by our system. The grade of the student's query vector is evaluated by finding cosine similarity with reference presentations or finding k number of nearest reference presentations. The grade of such similar reference presentations is assigned to the query vector. Table 1 contains the list of the features extracted from the PowerPoint presentations. Feature extraction is explained in detail in section 4. Here, we have shown a feature document matrix of 9 PowerPoint presentations.
Figure 1. Block diagram of automated grading of PowerPoint presentations using LSA
Table 1. Feature-PowerPoint document matrix
|
Sr. No. |
Features |
PPT1 |
PPT2 |
PPT3 |
PPT4 |
PPT5 |
PPT6 |
PPT7 |
PPT8 |
PPT9 |
|
1 |
Total Slides |
2 |
2 |
1 |
2 |
2 |
2 |
2 |
2 |
2 |
|
2 |
Tables |
3 |
0 |
3 |
0 |
0 |
0 |
0 |
0 |
3 |
|
3 |
Images |
0 |
3 |
1 |
1 |
1 |
0 |
1 |
1 |
1 |
|
4 |
Font types |
2 |
2 |
0 |
1 |
0 |
1 |
0 |
0 |
2 |
|
5 |
Font color |
2 |
2 |
2 |
0 |
0 |
0 |
1 |
0 |
1 |
|
6 |
Bold |
1 |
1 |
1 |
0 |
1 |
1 |
1 |
1 |
1 |
|
7 |
Underline |
0 |
1 |
1 |
0 |
0 |
0 |
1 |
1 |
1 |
|
8 |
Italic |
0 |
1 |
1 |
0 |
0 |
0 |
1 |
1 |
1 |
|
9 |
Maximum Font Size |
2 |
2 |
2 |
1 |
2 |
1 |
2 |
2 |
2 |
|
10 |
Minimum Font Size |
2 |
2 |
2 |
2 |
2 |
2 |
2 |
2 |
2 |
|
11 |
Hyperlink |
0 |
0 |
1 |
0 |
0 |
0 |
0 |
1 |
1 |
|
12 |
Footer |
2 |
0 |
0 |
0 |
0 |
0 |
2 |
0 |
0 |
|
13 |
Date |
2 |
2 |
0 |
0 |
0 |
0 |
0 |
2 |
2 |
|
14 |
Slide Number |
2 |
2 |
0 |
0 |
0 |
0 |
2 |
2 |
2 |
Python-pptx can be used to create and manipulate PowerPoint presentations. We have collected 86 PowerPoint presentations from our institute's undergraduate students, those were designed for Seminar presentation. They prepared PowerPoint slides using presentation software like MS Office, Python-pptx library. The feature extraction program is implemented in python, using the python-pptx library. We have considered features related to text appearance, graphics, footer, and hyperlink which check the student's efforts and contribute to the quality of PowerPoint presentations. These features will not contribute to the technical components of the student's presentation skills. We have extracted 22 features as shown in Algorithm 1. The PowerPoint presentation can be made effective by using the features related to the appearance of text, graphics, footer, and hyperlink as shown in Table 1. Hence, out of 22 features, we have considered 14 the most important features which contributes to categorize PowerPoint presentations in different grades. Machine learning algorithms require a labelled dataset. Each PowerPoint presentation is represented as a vector of 14 features with output label as its grade. Teachers have rated these presentations with Excellent, Good, and Fair grades. A panel of 3 teachers have independently graded PowerPoint presentations. The majority of the grades are assigned in the dataset as output labels with the permission of the experts. We have used 75 PowerPoint presentations as a training set or reference set in our experimentation and 11 PowerPoint presentations as query set or test set.
Algorithm 1:
Input: PowerPoint presentation
Output: List of the Features
count=1
ppt= Presentation(i), where i=1 to n,
n=total PowerPoint presentations
for slide in ppt.slides:
for shape in slide. Shapes:
if (shape_type==13) indicates Images.
if (shape_type==3) indicates Charts.
if (shape_type==17) indicates Textbox.
if (shape_type==19) indicates Tables.
if (shape_type==14) indicates Placeholders.
hlink=run.hyperlink
font = run.font
font_name= font.name
font_size=font.size.pt
Find Maximum and Minimum font size.
font.bold! = None, font.underline! =None, font. Italic!
=None indicates Bold, Underline, and Italic fonts.
font.color.rgb
phf = shape.placeholder_format
if (phf.type==1) indicates Title.
if (phf.type==2) indicates Body.
if (phf.type==3) indicates Centretitle.
if (phf.type==4) indicates Subtitle.
if (phf.type==15) indicates Footer.
if (phf.type==16) indicates Date.
if (phf.type==13) indicates Slide number.
else
count = count+1 go to step 2.
After extracting features from the PowerPoint presentations, the feature-document matrix is prepared. Here, the document is a PowerPoint presentation. In the feature document matrix, all features are put in a row. Total 14 rows are there in the feature-document matrix corresponding to 14 features, as shown in Table 1. Columns represent PowerPoint presentations. Feature-document matrix is decomposed by using SVD into three different matrices, as shown in Eq. (1). The first and third matrices are orthogonal vectors that describe a row entity and column entity. The second matrix is a diagonal that contains scalar values [24].
$A_{t x d}=U_{t x n} * S_{n x n} * {V_{d x n}}^{T}$ (1)
where, A is the feature-document matrix, U is the matrix that describes a feature, S is the diagonal matrix, and $V^{T}$ describes a PowerPoint presentation document. t is the number of features, i.e., 14, n is the latent semantic space dimension, d represents the number of PowerPoint presentations. Here we have taken PowerPoint presentations. The diagonal matrix S is obtained after applying SVD decomposition. Here, only diagonal values are shown. It is an eigenvector containing eigenvalue in decreasing order. We will consider only the first top 2 values.
S=[13.2563, 4.5605, 3.5058, 3.0361, 2.7971, 2.3939, 1.1474, 0.8404, 0.6206].
U=[[-0.40983662, -0.3101463], [-0.26914913, 0.78641571],
[-0.2344467, -0.28823954], [-0.22563085, 0.13781735],
[-0.23497369, 0.27701628], [-0.20223373, -0.05171161],
[-0.13855827, -0.02911222], [-0.13855827, -0.02911222],
[-0.40465076, -0.1147956], [-0.43350536, -0.23347783],
[-0.0819615, 0.08617316], [-0.11381518, 0.10529971],
[-0.24656913, 0.1259986], [-0.29508169, 0.00986846]]
V=[[-0.43283595, -0.42871556, -0.31376016, -0.19246775,
-0.22122791, -0.19003774, -0.32154873, -0.33003494,
-0.44271205],
[0.50491871, -0.26095493, 0.34964887, -0.29655898,
-0.36328906, -0.24469484, -0.26480748, -0.29757677,
0.34092318]]
Matrices U and V truncated by taking the first two columns and rows from U and V, respectively.
The truncated SVD matrices are used to make the PowerPoint presentation vectors [21]. The two rows in $V^{T}$ represent PowerPoint presentations, and two columns in U represent features across two latent semantic spaces. The PowerPoint presentation vectors dj’ with grades make the reference set or training set. The grade of a student's PowerPoint presentation is calculated as follows:
1. Calculate the dot product of U and S-1 as U. S-1.
2. Calculate dot product of the above result with document vector.
$d_{j}^{\prime}=d_{j}^{T} \cdot U . S^{-1}$
where, djT is the transpose of reference PowerPoint presentation vector.
3. Calculate dot product of student’s PowerPoint presentation vector, i.e., also called as query vector with U.S-1.
qj' = qjT.U. S-1
where, qjT is the transpose of the student’s PowerPoint presentation or query vector.
4. The grades of the student’s presentations are evaluated by finding cosine similarity with reference presentations or by finding k number of nearest reference presentations. The nearest or similar reference presentation grade will be assigned to the student’s presentation. A similar reference presentation is found using Cosine similarity, and the nearest reference presentation is found using the Kneighbors algorithm.
6.1 Cosine similarity
Cosine similarity measures similarity between the two vectors. Let X and Y be two vectors. Cosine similarity between them is calculated as,
$\operatorname{Cosine} \operatorname{Similarity}(X, Y)=\frac{X . Y}{\|X\| *\|Y\|}$
where, ||X|| and ||Y|| are the length of vectors X and Y, respectively. Which are calculated as,
$\|\mathrm{X}\|=\sqrt{\sum \mathrm{Xi}^{2}},\|\mathrm{Y}\|=\sqrt{\sum \mathrm{Yi}^{2}}$ i=1, 2, 3…n
PowerPoint presentation, which has similar features, has a high LSA relationship, and will be positioned near to reference PowerPoint presentations in the latent semantic space and will have cosine similarity near to 1. The grade of such reference PowerPoint presentation will be set as a student's PowerPoint presentation grade.
For illustration, we have considered a feature-document matrix of 9 reference PowerPoint presentations as given in Table 1. Each row represents an individual PowerPoint presentation vector of size 1 x 14. After applying SVD from diagonal matrix S, the top 2 Eigenvalues are considered. Hence dimension of the reference vector becomes 1 x 2. Table 2 shows reference vectors after applying SVD.
Table 2. PowerPoint presentation vectors
|
Reference Presentation Vectors |
Grade |
|
ref1= [-0.43283595, 0.50491871] |
Excellent |
|
ref2= [-0.42871556, -0.26095493] |
Excellent |
|
ref3= [-0.31376016, 0.34964887] |
Good |
|
ref4= [-0.19246775, -0.29655898] |
Fair |
|
ref5= [-0.22122791, -0.36328906] |
Fair |
|
ref6= [-0.19003774, -0.24469484] |
Fair |
|
ref7= [-0.32154873, -0.26480748] |
Good |
|
ref8= [-0.33003494, -0.29757677] |
Good |
|
ref9= [-0.44271205, 0.34092318] |
Excellent |
Query vector is the PowerPoint presentation vector of size 1×14,
query vector=[2, 3, 1, 1, 0, 1, 0, 1, 2, 2, 0, 2, 2, 2]
After applying SVD, query vector of size 1×2 is obtained
query vector= [-0.40850238, 0.28362827]
Cosine similarity between query vector and reference vectors is calculated. Cosine similarity between the query vector and corresponding 9 reference vectors is as follows:
([0.9676087], [0.4051226], [0.973083], [-0.0312192], [-0.0598822], [0.0534046], [0.2715165], [0.2281435], [0.9987835])
We can observe that the query vector has the highest similarity with vector ref9, the 9th reference PowerPoint presentation. The grade of this PowerPoint is Excellent. Hence Excellent grade will be assigned to the student’s PowerPoint presentation.
6.2 Kneighbors
It is a machine learning algorithm. We do not train a model like other machine learning algorithms during the training phase. “Instead, just store the reference presentations’ vectors in the data structures. All presentation vectors are calculated in semantic space”. The nearest reference presentations are found by calculating the Euclidian distance between reference presentations and students’ presentations. Then k number of nearest reference presentations will be selected with minimum Euclidian distance measure. From the k number of neighbors, the most frequent majority output grade is assigned for students’ presentations. Let X and Y be two vectors. Euclidian distance between X and Y is calculated as,
$\text { Euclidian Distance }(X, Y)=\sqrt{\sum(X i-Y i)^{2}}$ i=1, 2, 3…. n
Reference and query vectors are obtained using truncated SVDmatrices. Euclidian distance between query vector and reference vector is as,
([0.2226243],[0.544958],[0.1154764],[0.619103],[0.203513],[0.57171],[0.555286],[0.586478],[0.0667309])
For k=4, depending on Euclidian distance, the nearest vectorsare ref1, ref3, ref5, and ref9 with grades Excellent, Good, Fair, respectively. The majority of the grade is Excellent. Hence Excellent grade is assigned to a student’s presentation.
An Excellent grade is assigned to a student’s presentation in both approaches.
Latent Semantic Analysis uncovers lexical-semantic links between the PowerPoint presentations. We have implemented grading of students' PowerPoint presentations using Cosine similarity and the Kneighbors approach.
7.1 Dataset
We have collected 86 PowerPoint presentations of the undergraduate students of our institute designed for the Seminar presentation. These presentations are evaluated by teachers with Excellent, Good, and Fair grades. Features are extracted using feature extraction program, written in python using the python-pptx library.
Figure 2. PowerPoint presentation dataset
As shown in Figure 2, our data set is a cluster of three classes corresponding to three output classes, i.e., Excellent, Good, Fair. Purple, green, and yellow color data points represent Excellent, Good, and Fair presentations. We have total 86 presentation vectors corresponding to 86 PowerPoint presentations. We have used 75 PowerPoint presentations as a training set or reference set in our experimentation and 11 PowerPoint presentations as query set or test set.
7.2 Experimental analysis using Kneighbors approach
We have used the Kneighbors classifier from the sci-kit-learn library in our experimentation. We have considered 75 PowerPoint presentation vectors for training and 11 vectors for testing. We have repeated training and testing on the vectors by varying the size of vectors by changing eigenvalues from the diagonal matrix. Also we varied number of neighbors for the students’ presentations. For the number of neighbors as 3 and PowerPoint presentation vector size 4 gives maximum accuracy. In grading of the PowerPoint presentation using Kneighbors approach gives 90.90% accuracy.
Table 3. Classification report using Kneighbors
|
Output Class |
Precision |
Recall |
F1-score |
|
Excellent |
1.00 |
0.83 |
0.91 |
|
Good |
0.67 |
1.00 |
0.80 |
|
Fair |
1.00 |
1.00 |
1.00 |
Table 3 shows classification report of PowerPoint presentations using Kneighbors approach. Class Fair has precision, recall, and f1-score equal to 1. It shows that all presentations belonging to the class Fair are correctly classified. While presentations belonging to the class Good and Excellent are misclassified. From Figure 2, we can observe that data points of Excellent and Good classes are mixed at the boundary of the cluster, and Fair class data points are separated from other classes. So here, misclassification is occurring for Excellent and Good data points at the cluster boundary.
7.3 Experimental analysis using Cosine similarity approach
We have considered 75 vectors for training and 11 vectors for testing. We have found the Cosine similarity of each testing vector with all training vectors. We have observed performance by varying the number of elements from the diagonal matrix from 1 to 9. By taking the number of elements as 8, we have achieved accuracy up to 81.81%, as shown in Figure 3. Table 4 shows the classification report for the Excellent, Good, and Fair classes. Table 4 shows the classification report of PowerPoint presentations using Cosine similarity approach.
Table 4. Classification report using Cosine similarity
|
Output Class |
Precision |
Recall |
F1-score |
|
Excellent |
1.00 |
0.83 |
0.91 |
|
Good |
0.50 |
1.00 |
0.67 |
|
Fair |
1.00 |
0.67 |
0.80 |
Figure 3 shows the accuracy achieved in the above experimentations by varying the vectors' dimensions by varying the elements in the diagonal matrix from 1 to 9. The accuracy obtained by the nearest neighbor approach is more significant than the cosine similarity approach. Hence, Kneighbors gives better performance compared to cosine similarity. Using Kneighbors achieved an accuracy of 90.90% for the vector size 4. Using cosine similarity achieved an accuracy of 81.81% for the vector size 8. Kneighbors classifier accuracy gets reduced after increasing vector size greater than 4.
Figure 3. Accuracy using Kneighbors and Cosine similarity approach
We have extracted features from the PowerPoint presentations using the python-pptx library. We have represented students' PowerPoint presentations in the latent semantic space using LSA. The reference PowerPoint presentations similar to a student presentation are found using Cosine similarity and Kneighbors approach. Grades of such reference presentations were used to evaluate the grade of students' presentations. In the Kneighbors classifier, we have considered 3 nearest neighbors to predict the grade of the students' presentations. Kneighbors and Cosine similarity approach predict grades for the student's PowerPoint presentations with an accuracy of 90.90% and 81.81%, respectively. Kneighbors classifier achieved better accuracy compared to the Cosine similarity approach by using a lower-dimensional presentation vector compared to Cosine similarity.
[1] Borade, J.G., Netak, L.D. (2020). Automated grading of essays: A review. In International Conference on Intelligent Human Computer Interaction, pp. 238-249. https://doi.org/10.1007/978-3-030-68449-5_25
[2] Borade, J.G., Kiwelekar, A.W., Netak, L.D. (2022). Feature extraction for automatic grading of students’ presentations. In ICT Systems and Sustainability, pp. 293-301. https://doi.org/10.1007/978-981-16-5987-4_30
[3] Haendchen Filho, A., do Prado, H.A., Ferneda, E., Nau, J. (2018). An approach to evaluate adherence to the theme and the argumentative structure of essays. Procedia Computer Science, 126: 788-797. https://doi.org/10.1016/j.procs.2018.08.013
[4] Haendchen Filho, A., Concatto, F., Nau, J., do Prado, H.A., Imhof, D.O., Ferneda, E. (2019). Imbalanced learning techniques for improving the performance of statistical models in automated essay scoring. Procedia Computer Science, 159: 764-773. https://doi.org/10.1016/j.procs.2019.09.235
[5] Ajitiono, T., Widyani, Y. (2016). Indonesian essay grading module using Natural Language Processing. In 2016 International Conference on Data and Software Engineering (ICoDSE), pp. 1-5. https://doi.org/10.1109/ICODSE.2016.7936117
[6] Eid, S.M., Wanas, N.M. (2017). Automated essay scoring linguistic feature: Comparative study. In 2017 Intl Conf on Advanced Control Circuits Systems (ACCS) Systems & 2017 Intl Conf on New Paradigms in Electronics & Information Technology (PEIT), pp. 212-217. https://doi.org/10.1109/ACCS-PEIT.2017.8303043
[7] Contreras, J.O., Hilles, S., Abubakar, Z.B. (2018). Automated essay scoring with ontology based on text mining and nltk tools. In 2018 International Conference on Smart Computing and Electronic Enterprise (ICSCEE), Shah Alam, Malaysia, pp. 1-6. https://doi.org/10.1109/ICSCEE.2018.8538399
[8] Lam, H.W., Dillon, T., Chang, E. (2011). Determining writing genre: towards a rubric-based approach to automated essay grading. In 2011 IEEE International Conference on Advanced Information Networking and Applications, Biopolis, Singapore, pp. 270-274. https://doi.org/10.1109/AINA.2011.32
[9] Fazal, A., Hussain, F.K., Dillon, T.S. (2013). An innovative approach for automatically grading spelling in essays using rubric-based scoring. Journal of Computer and System Sciences, 79(7): 1040-1056. https://doi.org/10.1016/j.jcss.2013.01.021
[10] Leng, Y., Yu, L., Xiong, J. (2019). Deepreviewer: Collaborative grammar and innovation neural network for automatic paper review. In 2019 International Conference on Multimodal Interaction, pp. 395-403. https://doi.org/10.1145/3340555.3353766
[11] Parihar, S., Dadachanji, Z., Singh, P.K., Das, R., Karkare, A., Bhattacharya, A. (2017). Automatic grading and feedback using program repair for introductory programming courses. In Proceedings of the 2017 ACM Conference on Innovation and Technology in Computer Science Education, pp. 92-97. https://doi.org/10.1145/3059009.3059026
[12] Al-Jouie, M.F., Azmi, A.M. (2017). Automated evaluation of school children essays in Arabic. Procedia Computer Science, 117: 19-22. https://doi.org/10.1016/j.procs.2017.10.089
[13] Bashir, A.M., Hassan, A., Rosman, B., Duma, D., Ahmed, M. (2018). Implementation of a neural natural language understanding component for Arabic dialogue systems. Procedia Computer Science, 142: 222-229. https://doi.org/10.1016/j.procs.2018.10.479
[14] Ajitiono, T., Widyani, Y. (2016). Indonesian essay grading module using Natural Language Processing. In 2016 International Conference on Data and Software Engineering (ICoDSE), Denpasar, Indonesia, pp. 1-5. https://doi.org/10.1109/ICODSE.2016.7936117
[15] Walia, T.S., Josan, G.S., Singh, A. (2019). An efficient automated answer scoring system for Punjabi language. Egyptian Informatics Journal, 20(2): 89-96. https://doi.org/10.1016/j.eij.2018.11.001
[16] Ratna, A.A.P., Luhurkinanti, D.L., Ibrahim, I., Husna, D., Purnamasari, P.D. (2018). Automatic essay grading system for Japanese language examination using winnowing algorithm. In 2018 International Seminar on Application for Technology of Information and Communication, Semarang, Indonesia, pp. 565-569. https://doi.org/10.1109/ISEMANTIC.2018.8549789
[17] Peng, X., Ke, D., Chen, Z., Xu, B. (2010). Automated Chinese essay scoring using vector space models. In 2010 4th International Universal Communication Symposium, Beijing, China, pp. 149-153. https://doi.org/10.1109/IUCS.2010.5666229
[18] Suleiman, D., Awajan, A., Al Etaiwi, W. (2017). The use of hidden Markov model in natural Arabic language processing: A survey. Procedia computer science, 113: 240-247. https://doi.org/10.1016/j.procs.2017.08.363
[19] Olowolayemo, A., Nawi, S.D., Mantoro, T. (2018). Short answer scoring in English grammar using text similarity measurement. In 2018 International Conference on Computing, Engineering, and Design (ICCED), Bangkok, Thailand, pp. 131-136. https://doi.org/10.1109/ICCED.2018.00034
[20] Janda, H.K., Pawar, A., Du, S., Mago, V. (2019). Syntactic, semantic and sentiment analysis: The joint effect on automated essay evaluation. IEEE Access, 7: 108486-108503. https://doi.org/10.1109/ACCESS.2019.2933354
[21] Srihari, S., Collins, J., Srihari, R., Srinivasan, H., Shetty, S., Brutt-Griffler, J. (2008). Automatic scoring of short handwritten essays in reading comprehension tests. Artificial Intelligence, 172(2-3): 300-324. https://doi.org/10.1016/j.artint.2007.06.005
[22] Islam, M., Latiful Haque, A. (2013). Automated Bangla essay scoring system: ABESS. International Conference on Informatics, Electronics and Vision, ICIEV. https://doi.org/10.1109/ICIEV.2013.6572694
[23] Zen, K., Iskandar, D.F.A., Linang, O. (2011). Using Latent Semantic Analysis for automated grading programming assignments. In 2011 International Conference on Semantic Technology and Information Retrieval, pp. 82-88. https://doi.org/10.1109/STAIR.2011.5995769
[24] Ratna, A.A.P., Arbani, A.A., Ibrahim, I., Ekadiyanto, F.A., Bangun, K.J., Purnamasari, P.D. (2018). Automatic essay grading system based on latent semantic analysis with learning vector quantization and word similarity enhancement. In Proceedings of the 2018 International Conference on Artificial Intelligence and Virtual Reality, pp. 120-126. https://doi.org/10.1145/3293663.3293684
[25] LaVoie, N., Parker, J., Legree, P.J., Ardison, S., Kilcullen, R.N. (2020). Using latent semantic analysis to score short answer constructed responses: Automated scoring of the consequences test. Educational and Psychological Measurement, 80(2): 399-414. https://doi.org/10.1177/0013164419860575
[26] Islam, M.M., Hoque, A.L. (2010). Automated essay scoring using generalized latent semantic analysis. In 2010 13th International Conference on Computer and Information Technology (ICCIT). pp. 358-363. https://doi.org/10.1109/ICCITECHN.2010.5723884