Marvin Chandra Wijaya
© 2021 IIETA. This article is published by IIETA and is licensed under the CC BY 4.0 license (http://creativecommons.org/licenses/by/4.0/).
OPEN ACCESS
A system capable of automatically grading short answers is a very useful tool. The system can be created using machine learning algorithms. In this study, a machine system using BERT is proposed. BERT is an open-source system that is set to English by default. The use of languages other than English Language is a challenge to be implemented in BERT. This study proposes a novel system to implement Indonesian Language in the BERT system for automatic grading of short answers. The experimental results were measured using two measuring instruments: Cohen's Kappa coefficient and the Confusion Matrix. The result of measuring the BERT output of the implemented system has a Cohen Kappa coefficient of 0.75, a precision of 0.94, a recall of 0.96, a Specificity of 0.76 and an F1 Score of 0.95. Based on the measurement results, it can be seen that the implementation of the automatic short answer grading system in Indonesian Language using BERT machine learning has been successful.
automatic grading system, BERT, machine learning, Indonesian language
A learning system between teachers and students requires two-way communication to measure learning outcomes. One of the tools to measure learning outcomes is to hold tests, quizzes, or exams for students who take learning classes [1]. The test has a good impact on the learning system because teachers and students can know the effectiveness of the learning being carried out [2]. The exam can be in the form of a pre-test, a test in the middle of the lesson, or at the end of the learning. These three methods have a good impact on the learning process [3]. The rise of online learning at this time also increases the need for a measuring tool to find out distance learning has been successfully implemented [4]. In a learning process, there is a lot of interaction between teachers and students, so that it causes a good social impact that can be measured as well [5]. There are several types of questions in an exam: memory questions, comprehension questions, application questions, analysis questions, synthesis questions, evaluation questions, and process skills questions.
A good exam in measuring the learning system is to make questions in the form of short answer questions. Along with the increasing number of students who must be checked for answers from the exam, a system is needed to assist teachers in checking student answers. The automatic answer checking system can help teachers check answers; at least this system can help if teachers make mistakes in grading exam results from students.
The grading system for short answers is automatically difficult compared to the multiple-choice answer checker, and this is because student answers vary widely. The variations of these answers must be studied properly in order to get proper results. However, if the automatic grading system can be realized properly, then it can be very helpful for teachers in their learning system. The Machine Learning Algorithm proposed in this study must be able to make the classification correctly [6].
Currently, many short answer question grading systems have been studied to get better grading accuracy. In 2019 Hasanah et al. [7] conducted a study entitled “A scoring rubric for automatic short answer grading system”. This study aims to perform grading without using language semantic’s tool.
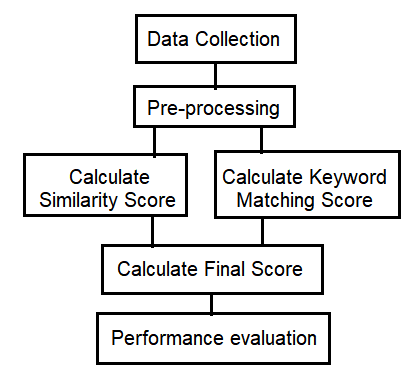
Figure 1. Research flow by Uswatun Hasanah
Experiments were carried out on seven questions, with thirty-four for alternative answers, and tested on two hundred and twenty-four students. The experimental results produce a Pearson correlation of 0.65 - 0.66 with a mean absolute error of 0.95 - 1.24 [7]. The steps used in this research are: data collection, pre-processing, calculate similarity score, calculate keyword matching score, calculate the final score, and performance evaluation, as shown in Figure 1.
Similarity scores are calculated using four formulas: Longest Common Subsequence (LCS), Jaccard Index, Cosine Coefficient, and DICE Coefficient. LCS calculates the similarity value between the two sentences being compared (sentence 1 and sentence 2) using the following formula:
$\operatorname{sim} l c s=\frac{2 \times|\operatorname{LCS}(s 1, s 2)|}{|s 1|+F P|s 2|}$ (1)
where:
sim lcs = LCS value
s1 = sentence 1
s2 = sentence 2
Jaccard Index is the percentage of the same terms from all combined terms of the two documents (document 1 and document 2). The Jaccard Index formula is as follows:
$\operatorname{sim} j i=\frac{|\operatorname{doc} 1 \cap \operatorname{doc} 2|}{|\operatorname{doc} 1 \cup \operatorname{doc} 2|}$ (2)
where:
sim ji = Jaccard Index value
doc1 = document 1
doc2 = document 2
The cosine Coefficient measures the comparison of angular cosine on the similarity between two documents and the multiplication of two documents. The Cosine Coefficient formula is as follows:
$\operatorname{sim} c c=\frac{|\operatorname{doc} 1 \cap \operatorname{doc} 2|}{|\operatorname{doc} 1|^{0.5}\quad \cdot|\operatorname{doc} 2|^{0.5}}$ (3)
Dice Coefficient is twice the calculation of the percentage of the same term in both documents with the number of terms in each document. The Dice Coefficient formula is as follows:
$\operatorname{sim} d c=2 \times \frac{|\operatorname{doc} 1 \cap \operatorname{doc} 2|}{|\operatorname{doc} 1| \times|\operatorname{doc} 2|}$ (4)
Similarity score will be taken from the highest value from the calculation results of LCS value, Jaccard Index value, Cosine Coefficient value, and DICE Coefficient.
Keyword Matching Score calculates the number of keywords from student answers and alternative answers, where each keyword from the alternative answers will be compared with student answers. The highest match score in the calculation will be used as the Keyword Matching Score.
The final score is a combined calculation between similarity score and keyword match score. The final score will be calculated from the average multiplication of the similarity score with the answer score and the keyword match score with the answer score, as in the following formula:
$F S=\frac{(\operatorname{sim} \times a s)+(k m \times a s)}{2}$ (5)
where:
FS = Final score
sim = similarity score
km = keyword matching score
as = answer score
In 2020, Süzen et al. [8] conducted a study entitled “Automatic short answer grading and feedback using text mining methods”. This research uses a standard data mining model answer to process automatic short answer questions. Experiments were carried out by groups of students for grading short answers by making comparisons between student answers and model answers [8]. This study uses the Bag of Words model to represent the text in the short answer question and the Frequency Term to represent the relevance of the term in the short answer question.
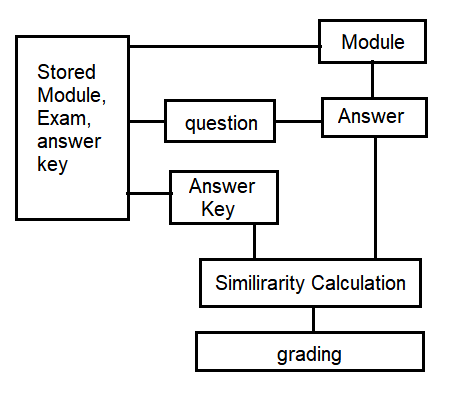
In 2021, Ince and Kutlu [9] conducted a study entitled “Web-Based Turkish Automatic Short Answer Grading System” which focused on research on the Turkish Language for grading short answer questions. The steps used in this research are: instructor module, stored exams, questions, answer keys, exam grades, student module, exam module, student answer, similarity calculations, calculated question point, and total exam grade, as shown in Figure 2.
Figure 2. TASAG System by Ebru Yilmaz Ince
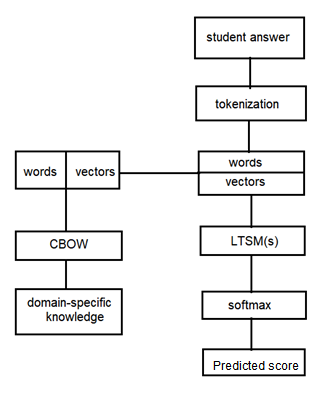
In 2019, Zhang et al. [10] conducted a study entitled “An automatic short answer grading model for semi open-ended questions”. In this study, the model used is a long short-term memory recurrent neural network to process the grading of semi open-ended questions, as shown in Figure 3.
Figure 3. Automatic Grading Model by Lishan Zhang
In 2015, Pado and Keifer conducted a study entitled “Short Answer Grading: When Soring Helps and When it Doesn’t”. This study uses a domain-independent system to process the short answer grading [11]. The evaluation of the experiment in this study using CREG and Computer Science Short Answer in German (CSSAG) has an average grading speed of 1.6 seconds.
There are several algorithms that can improve the accuracy in the classification of student answers for each class, such as using the K-Means algorithm. The K-Means algorithm uses cluster analysis to segment a data set into several clusters. Cluster analysis is a methodology for grouping data based on certain similarities [12]. K-means is used to predict student answers using an algorithm, where K is used to cluster several segments to find the closest proximity to each cluster. Each data set point is taken and connected to each cluster centre point, and this step is repeated to get the best cluster centre point. With this repetition, every time learning is carried out, the performance of student assessment clustering will be more accurate. The formula used in this method is as follows:
$a c c=$ mean $+k \times(n q-c o r r)$ (6)
mean $=\frac{(r d+a t)}{(\operatorname{corr}+1)}$ (7)
where:
acc = accuracy
nq = number of questions
corr = number of correct answers
rd = read time
at = answer time
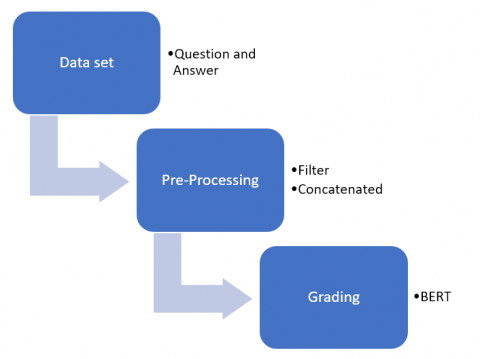
This method section will discuss the data set, pre-processing, and Bidirectional Encoder Representation from Transformer (BERT), as shown in Figure 4. There are three main steps proposed in this study: collecting data sets (consisting of questions and answers), pre-processing (consisting of filters and concatenated), and grading process using BERT. The proposed machine learning algorithm is able to optimize the resulting output [13].
Figure 4. Method
3.1 Data set
The important thing in starting the BERT machine learning process is to prepare the data set in advance [14, 15]. The data set consisted of short answers made to a quiz between students from high school in Bandung, Indonesia. About 60 students responded to questions related to Computer and Information Technology (CIT) subjects. There are two kinds of data sets: training datasets and testing data sets. The training set is taken from the question and answer data bank provided by the teacher. There are 100 questions and answers in the data bank for Computer and Information Technology (CIT) subjects.
The testing dataset was taken from the student’s responses. Respondents consisted of 60 students consisting of 35 men and 25 women. Respondents are 10th-grade students aged between 15 - 17 years. Each student is given ten questions which are taken randomly from the question data bank. The data set of each student consists of 10 different questions with relative information in the context of the questions. The initial rankings are settled by experts, and each answer was categorized into four categories, namely: true, true-but-incomplete, contradictory, and incorrect.
3.2 Data preprocessing
The data set that has been obtained from 60 students is pre-processed before being processed to the next stage. Data sets with incomplete answers are deleted. From 60 respondents, a filter was conducted to find complete answers, and 48 complete answers were obtained.
Grading on a short answer question is sometimes not only correct or incorrect; it can also be true but incomplete or contradictory. However, these four rating categories can make the grading process using BERT Machine Learning more complex. The four existing rating categories were shrunk into two to become binary response variables (correct answer or wring answer) to be processed later. In non-binary classification, you have to manage the number of data sets in each category. This setup process makes the pre-processing step more complex. In this study, a binary process was carried out on the classification according to the needs of the respondents being tested. Responses that are considered “correct” answers are in the correct category, while the other categories (true but incomplete, contradictory, and incorrect) are considered “wrong” answers.
The next step is to combine the question context text with the answer itself. Then, the combined text is tokenized using the base-BERT-uncased tokenizer, as shown in Figure 5. There are two steps in the process, which are as follows:
Step 1: The concatenated process combines questions and answers.
Step 2: The tokenizer process by analyzing the sentences that have been concatenated. The sentence is segmented into tokens that have a single meaning. The stop word in the sentence is also omitted.
An example of this process is:
Question: “Indonesia is located on the continent of Asia. What are the two continents and two oceans closest to Indonesia?”
Answer: “Indonesia is located between the continents of Asia and the continent of Australia. Indonesia is located between the Pacific Ocean and the Indian Ocean.”
The results of the process of the questions and answers are as follows:
Token 1: “The country of Indonesia is located on the continent of Asia”.
Token 2: “What are the two closest continents and two oceans of Indonesia”.
Token 3: “Indonesia is located between the continents of Asia and the continents of Australia”.
Token 4: “Indonesia lies between the Pacific Ocean and the Indian Ocean”.
Figure 5. Implementation steps
3.3 Bidirectional Encoder Representation from Transformer (BERT) – Machine Learning
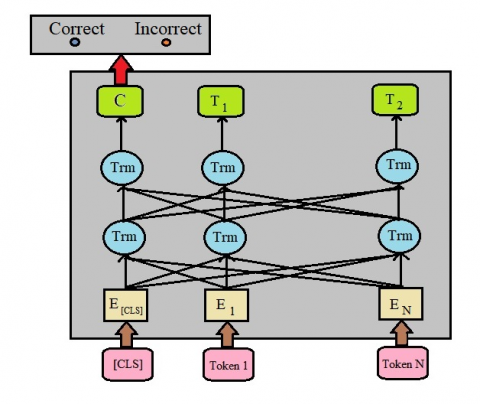
BERT is an open-source machine learning framework for natural language processing (NLP) designed to help computers understand language meaning in the text [16]. BERT is a Bidirectional Encoder Representations based on Transformers, using a deep learning model as shown in Figure 6 [17].
Figure 6. BERT Model
E1 - EN represents the token generated from the tokenizer and then inserted into the Trm (Intermediate representation) and T1 - TN (Final Output) layers. The classification (C) used is binary classification (Correct and Incorrect).
Each output element is connected to each input element, and the weights between those elements are calculated dynamically based on the connection. Masked Language Model (MLM) training aims to train to predict the hidden word based on the context of the word [18]. The Next Sentence Prediction training indicates whether the two sentences given have a logical connection and the two sentences are sequential [19].
Figure 7. BERT processes for non-English language
BERT has been previously trained to use only the unlabeled plain text corpus [20] (i.e. Brown Corpus and the entirety of the English Wikipedia). In order for BERT to be used for non-English languages, training in other languages is required, so a separate process is needed as shown in Figure 7.
Figure 8. BERT representation
The input representation of BERT is constructed by summing the corresponding tokens, segments, and position placements. Figure 8 shows an example of an input representation consisting of two segments (segment A and segment B). In this example, it can be seen that the embedding tokens are summed with the embedding segment and the embedding position. The modeling of the machine learning will classify the answers [21].
BERT by default, already has a data set in English. To use BERT in other languages (besides English) some initial adjustments are required. First of all, by installing the simple transformer library in accordance with the language that will be used. After the library is installed, then choose the training that is suitable for the language model used. The training requires a number of datasets according to the needs of the application to be made. As discussed in the previous section, the training dataset is taken from the question and answer data bank that the teacher has prepared.
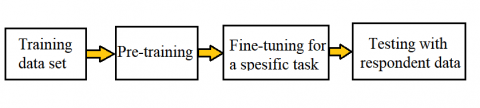
In this study, it is for the needs of the grading system. There may be a need to fine-tune the training model system created during the training, as shown in Figure 9. Fine-tuning is used to adapt the deep learning process to the given task. In this study, BERT was specifically given the task of grading short answer questions so that fine-tuning was carried out to separate tokens between questions and answers.
Figure 9. BERT workflow with pre-training and fine-tuning phases
These steps can be repeated as needed by evaluating the results of the training. After the pre-training and fine-tuning are completed, it can be continued with testing using respondent data. The model can then be tested to predict a real example, which is to create an automatic grading system application.
3.4 Measurement instrument – Cohen’s Kappa
Cohen’s kappa coefficient (κ) is a statistic used to measure inter-rater reliability (as well as intra-rater reliability). This is generally considered a more effective measure than a simple percentage agreement calculation.
Cohen’s Kappa formula is as follows:
$K=\frac{\operatorname{Pr}(a)-\operatorname{Pr}(e)}{1-\operatorname{Pr}(e)}$ (8)
where:
Pr(a) = Percentage of the number of measurements that are consistent between raters.
Pr(e) =Percentage of number of measurement changes between raters.
If Cohen’s Kappa score is <0.20, the consistency is poor. If it is 0.21 - 0.40, the consistency is fair. If it is 0.41 - 0.60, the consistency is moderate. If it is 0.61 - 0.80, the consistency is good. If it is 0.81 - 1.00, the consistency is very good.
3.5 Measurement instrument – Confusion Matrix
The Confusion Matrix can be used as a reference in evaluating the algorithm performance of Machine Learning (especially supervised learning) as shown in Figure 10. The Confusion Matrix represents the predictions and actual conditions of the data generated by the Machine Learning algorithm. Based on the Confusion Matrix, Accuracy, Precision, Recall, and Specificity can be determined.
Figure 10. Confusion Matrix
Precision is the ratio of positive correct predictions to the overall positive predicted results. The Precision Formula is as follows:
Precission $=\frac{T P}{T P+F P}$ (9)
Recall (Sensitivity) is the ratio of true positive predictions compared to the overall data that are true positive. The formula for the recall is as follows:
Recall $=\frac{T P}{T P+F N}$ (10)
Specificity is the correctness of predicting negative compared to the overall negative data. The formula for Specificity is as follows:
Specificity $=\frac{T N}{T N+F P}$ (11)
F1 Score is a weighted comparison of the average precision and recall. The formula for the F1 Score is as follows:
F1 Score $=\frac{2 \times \text { Recall } \times \text { Precission }}{\text { Recall }+\text { Precisiion }}$ (12)
The grading system for short answer questions has been experimented with a high school student in Bandung, Indonesia. There were 60 students, grade 10 in a high school in Bandung, who were taken as respondents. The initial filter is to process those who have complete answers (no blank answers). Of the 60 students, there are 48 complete answer sheets. The first step is to prepare a table for the module of learning that contains context, questions, and answers. Table 1 is an example of a data set in Indonesian language.
These examples were graded using an automatic grading system and a manually grading system using humans. Table 2 is an example of comparing the results of automatic and manual assessments for forty-eight (48) students who have complete answers, and each student gets ten (10) random questions.
The results of the two assessments were compared using Cohen’s Kappa method. Cohen's Kappa is a measure that states the consistency of measurements made by two raters or the consistency between two measurement methods or can also measure the consistency between two measurement tools. Cohen's kappa coefficient is only applied to the results of qualitative data measurement (Category). The experiments that have been carried out have resulted in consistent equivalence, as shown in Table 3.
Table 1. Example of Data Set (Indonesian Language)
|
Question Context |
Question |
Answer |
||
|
Istilah Komputer |
Komputer berasal dari kata |
Komputer berasal dari kata Computare |
||
|
Alat masukan |
Contoh alat masukan adalah |
Contoh alat masukan adaah tetikus |
||
|
Alat keluaran |
Contoh alat keluaran adalah |
Contoh alat keluaran adalah layar |
||
|
Prosesor |
Contoh prosessor komputer adalah |
Contoh prosesor komputer adalah INTEL dan AMD |
||
Table 2. Examples of automatic and manual grading comparison
|
Student no. |
Question no. |
Automatic Grading |
Manual grading |
|
1 |
1 |
Correct |
Correct |
|
1 |
2 |
Correct |
Correct |
|
. |
. |
. |
. |
|
. |
. |
. |
. |
|
1 |
10 |
Correct |
Incorrect |
|
2 |
1 |
Incorrect |
Incorrect |
|
. |
. |
. |
. |
|
. |
. |
. |
. |
|
2 |
10 |
Correct |
Incorrect |
|
. |
. |
. |
. |
|
. |
. |
. |
. |
|
48 |
1 |
Correct |
Correct |
|
. |
. |
. |
. |
|
. |
. |
. |
. |
|
48 |
10 |
Incorrect |
Correct |
Table 3. Consistency
|
|
|
Automatic Grading system |
|
|
|
|
Correct |
Incorrect |
|
Manual Grading |
Correct |
76% |
5% |
|
System (by Human) |
Incorrect |
3% |
16% |
$K=\frac{(0.76 \times 0.16)-((0.81 \times 0.79)+(0.19 \times 0.21))}{1-((0.81 \times 0.79)+(0.19 \times 0.21))}$$=0.75$
The automatic grading system made using BERT produces a Cohen's Kappa value of 0.75. This automatic grading system has a value similar to that of a human appraiser. The Machine Learning Algorithm proposed in this study is able to classify and provide an assessment of these answers.
The experiments carried out were also measured using a confusion matrix. The first measurement is to calculate how precise the machine learning algorithm is implemented. The calculation is as follows:
$\mathrm{TP}=76 \%$
$\mathrm{FP}=5 \%$
$\mathrm{FN}=3 \%$
$\mathrm{TN}=16 \%$
Precission $=\frac{76 \%}{76 \%+5 \%}=0.94$
Meanwhile, the sensitivity or recall of the machine learning algorithms implemented are as follows:
Recall $=\frac{76 \%}{76 \%+3 \%}=0.96$
The capabilities of the machine learning algorithms implemented to predict wrong answers are as follows:
Specificity $=\frac{16 \%}{16 \%+5 \%}=0.76$
The comparison of the weighted average precision and recall of the implemented machine learning algorithms is as follows:
F1 Score $=\frac{2 \times 0.96 \times 0.94}{0.96+0.94}=0.95$
A novel system proposed in the study is a system that is able to implement Indonesian language in machine learning algorithms using BERT. BERT is an open-source system that by default has limitations because it is set for English. This study proposes a novel system to implement Indonesian in the BERT system for automatic grading of short answers. The experimental results were measured using two measuring instruments: Cohen's Kappa coefficient and the Confusion Matrix.
The result of measuring the BERT output of the implemented system has a Cohen Kappa coefficient value of 0.75, which means that the implemented algorithm has a good consistency.
In measuring the success of the algorithm that is presented using the confusion matrix, it produces the following values: Precision of 0.94, Recall of 0.96, Specificity of 0.76, and F1 Score of 0.95. Based on the measurement results, it can be seen that the implementation of the automatic short answer grading system in Indonesian Language using BERT machine learning has been successful.
Thank you for the support from Computer Laboratory, Department of Computer Engineering, Maranatha Christian University, Indonesia, in carrying out this study.
[1] Nederhand, M.L., Tabbers, H.K., Jongerling, J., Rikers, R.M. (2020). Reflection on exam grades to improve calibration of secondary school students: A longitudinal study. Metacognition and Learning, 15(3): 291-317. https://doi.org/10.1007/s11409-020-09233-9
[2] Friedrich, D. (2019). Effectiveness of peer review as cooperative web-based learning method applied out-of-class in a role playing game: A case study by quasi-experimental approach. Smart Learning Environments, 6(19): 1-22. https://doi.org/10.1186/s40561-019-0102-5
[3] Basey, J.M., Maines, A.P., Francis, C.D., Melbourne, B., Wise, S.B., Safran, R.J., Johnson, P.T. (2014). Impact of pre-lab learning activities, a post-lab written report, and content reduction on evolution-based learning in an undergraduate plant biodiversity lab. Evolution: Education and Outreach, 7(1): 1-9. https://doi.org/10.1186/s12052-014-0010-7
[4] de Bruin, A.B., Kok, E.M., Lobbestael, J., de Grip, A. (2017). The impact of an online tool for monitoring and regulating learning at university: Overconfidence, learning strategy, and personality. Metacognition and Learning, 12(1): 21-43. https://doi.org/10.1007/s11409-016-9159-5
[5] Wenzel, K., Reinhard, M.A. (2020). Tests and academic cheating: Do learning tasks influence cheating by way of negative evaluations? Social Psychology of Education, 23(3): 721-753. https://doi.org/10.1007/s11218-020-09556-0
[6] Boukhari, Y. (2020). Application and comparison of machine learning algorithms for predicting mass loss of cement raw materials due to decarbonation process. Revue d’Intelligence Artificielle, 34(4): 403-411. https://doi.org/10.18280/ria.340404
[7] Hasanah, U., Permanasari, A.E., Kusumawardani, S.S., Pribadi, F.S. (2019). A scoring rubric for automatic short answer grading system. Telkomnika, 17(2): 763-770. https://doi.org/10.12928/TELKOMNIKA.V17I2.11785
[8] Süzen, N., Gorban, A.N., Levesley, J., Mirkes, E.M. (2020). Automatic short answer grading and feedback using text mining methods. Procedia Computer Science, 169(2019): 726-743. https://doi.org/10.1016/j.procs.2020.02.171
[9] Ince, E.Y., Kutlu, A. (2021). Web-based Turkish Automatic Short-Answer Grading System. Natural Language Processing Research, 1(3-4): 46-55. https://doi.org/10.2991/nlpr.d.210212.001
[10] Zhang, L., Huang, Y., Yang, X., Yu, S., Zhuang, F. (2019). An automatic short-answer grading model for semi-open-ended questions. Interactive Learning Environments, pp. 1-14. https://doi.org/10.1080/10494820.2019.1648300
[11] Pado, U., Kiefer, C. (2015). Short answer grading: When sorting helps and when it doesn’t. In Proceedings of the Fourth Workshop on NLP for Computer-Assisted Language Learning, pp. 42-50.
[12] Vankayalapati, R., Ghutugade, K.B., Vannapuram, R., Prasanna, B.P.S. (2021). K-means algorithm for clustering of learners performance levels using machine learning techniques. Revue d’Intelligence Artificielle, 35(1): 99-104. https://doi.org/10.18280/ria.350112
[13] Sharma, R., Hooda, N. (2019). Optimized ensemble machine learning framework for high dimensional imbalanced bio assays. Revue d’Intelligence Artificielle, 33(5): 387-392. https://doi.org/10.18280/ria.330509
[14] Satla, S.P., Sadanandam, M., Suvarna, B. (2020). Dangerous Prediction in Roads by Using Machine Learning Models. Ingénierie des Systèmes d’ Information, 25(5): 637-644. https://doi.org/10.18280/isi.250511
[15] Singla, S.K., Garg, R.D., Dubey, O.P. (2020). Ensemble machine learning methods to estimate the sugarcane yield based on remote sensing information. Revue d’Intelligence Artificielle, 34(6): 731-743. https://doi.org/10.18280/RIA.340607
[16] Das, S., Deb, N., Cortesi, A., Chaki, N. (2021). Sentence embedding models for similarity detection of software requirements. SN Computer Science, 2(2): 1-11. https://doi.org/10.1007/s42979-020-00427-1
[17] Devlin, J., Chang, M.W., Lee, K., Toutanova, K. (2018). BERT: Pre-training of deep bidirectional transformers for language understanding. arXiv preprint arXiv:1810.04805. https://doi.org/10.18653/v1%2FN19-1423
[18] Alzubi, J., Alzubi, J.A., Jain, R., Singh, A., Parwekar, P., Gupta, M. (2021). COBERT: COVID-19 question answering system using BERT. Arabian Journal for Science and Engineering, pp. 1-11. https://doi.org/10.1007/s13369-021-05810-5
[19] Sur, C. (2020). RBN: Enhancement in language attribute prediction using global representation of natural language transfer learning technology like Google BERT. SN Applied Sciences, 2(1): 1-15. https://doi.org/10.1007/s42452-019-1765-9
[20] Kanerva, J., Ginter, F., Pyysalo, S. (2020). Dependency parsing of biomedical text with BERT. BMC Bioinformatics, 21(23): 1-12. https://doi.org/10.1186/s12859-020-03905-8
[21] Ahmed, M.Z., Mahesh, C. (2021). A weight based labeled classifier using machine learning technique for classification of medical data. Revue d’Intelligence Artificielle, 35(1): 39-46. https://doi.org/10.18280/ria.350104